

Two numerical experiments were performed by using the Community Atmosphere Model version 3 (CAM3) with different sea ice datasets to assess the contribution of the decline of Arctic sea ice to warming in the Northern Hemisphere. One experiment was driven by observed sea ice cover data; for the other one, the authors used the sea ice data of the 4×CO2 scenario simulated by the fourth-generation European Centre Hamburg atmospheric general circulation Model of Istituto Nazionale di Geofisica e Vulcanologia, Italy (INGV_ECHAM4). The comparison of the two experiments indicates that the decline of the Arctic sea ice leads to a dramatic warming over the high latitudes of the Northern Hemisphere, characterized by a maximum warming of more than 26°C over the Arctic region. The significant warming is closely related to the enhanced atmospheric heat source. A 40-60 W m-2 increase in the apparent heat source was simulated in winter due to the decline of Arctic sea ice. In contrast, no significant change was found in the atmospheric apparent heat source in summer. As a result, the summer temperature change induced by the decline of Arctic sea ice appears to be weak. This study suggests that accurate sea ice cover data is crucial for future climate projection of air temperature in high latitudes.
The increase in CO2 concentration in the atmosphere is responsible for global warming and Arctic sea ice melting ( Vinnikov et al. , 1999; Ridley et al. , 2008; Wang and Zhang, 2010), but the decline of Arctic sea ice can also cause warming. The atmosphere-ocean-sea ice coupled models predict maximum warming over high latitudes with increasing CO2 concentration. What is the role of sea ice feedback in high latitudinal warming? Almost all research results indicate that the decline of sea ice would cause an increase in air temperature to a certain extent and there will be an obvious lower troposphere warming in high latitudes ( Royer et al. , 1990; Singarayer et al. , 2006; Ma et al. , 2011, 2012). However, the relative impact of the various heating sources associated with Arctic warming has not been investigated in detail. In this study, we will assess the sensitivity of Arctic sea ice feedback to global warming in terms of changes in air temperature and atmospheric heating source.
The model used was the Community Atmosphere Model version 3 (CAM3), a general circulation model (GCM) with a resolution of T42 (approximately 2.8° × 2.8°) and 26 vertical layers. CAM3 is coupled with the Community Land Model (CLM) to account for the land surface process. The monthly sea surface temperature (SST) and sea ice were prescribed based on their climatological mean of 1971-2000 and did not include year-to- year variations. The changes in SST and sea ice alter the albedo, land-atmosphere fluxes, and the water flux and in turn impact on the atmosphere; however, the atmospheric changes do not alter the SST and sea ice cover. We can therefore examine the response of the atmosphere to the sea ice changes by using CAM3. CAM3 and its predecessors have been widely used by meteorologists around the globe. According to existing evaluations (e. g. , Dickinson et al. , 2006; Hurrell et al. , 2006; Meehl et al. , 2006; Rasch et al. , 2006), CAM3 is suited for investigating the issues related to climate changes despite the evident model bias.
In order to examine the response of the Northern Hemispheric air temperature to Arctic sea ice melting, we designed two experiments using different sea ice cover data. The control (CTR) experiment was run with observed climatological mean sea ice cover from 1971-2000. The sensitivity experiment (SEN) was run with the sea ice cover data from the fourth-generation European Centre Hamburg atmospheric general circulation Model of Istituto Nazionale di Geofisica e Vulcanologia, Italy (INGV_ ECHAM4) model under the 4×CO2 scenario in the third phase of the Coupled Model Intercomparison Project (CMIP3). The sea ice area of the control experiment and sensitivity experiment are shown in Table 1. The Arctic sea ice area shows a remarkable decrease in the SEN experiment relative to that in the CTR experiment throughout the year. The Arctic sea ice cover in the SEN experiment shows a clear annual cycle with its minimum area in late summer and early autumn. An ice-free Arctic clearly appears in summer in the SEN experiment. The sea ice cover in the SEN experiment mimics the sea ice distribution in the future under the ongoing global warming. In this paper, we examine the difference between the CTR experiment and the SEN experiment and assess the role of sea ice melting in the warming process of the Northern Hemisphere. Different atmospheric heating factors are computed by using the model results to elucidate the causes of warming in the high latitudes of the Northern Hemisphere. Both the CTR experiment and SEN experiment were run for 40 years. The first 10-year simulations were discarded for spinning up while the last 30-year simulations were used for the analysis.
The decrease in sea ice cover alters the energy flux and water flux between the ocean ice or sea ice and the atmosphere which in turn impacts on the atmosphere. Figure 1 illustrates the change of surface air temperature in summer and winter. The dark and light grey shaded areas denote the 99% and 95% confidence level, respectively. A slight but significant warming is simulated in the high latitudes of the Northern Hemisphere in summer (June- July-August, Fig. 1a). In contrast, the surface air temperature in the winter (December-January-February, Fig. 1b) shows a dramatic increase over the high latitudes of the Northern Hemisphere with a maximum warming of more than 26°C over the Arctic Ocean. The warming is generally limited to the high latitudes of the NorthernHemisphere. One interesting phenomenon is that a significant cooling is simulated over East Asia against the warming in the Arctic region due to the Arctic sea ice melting. This result is qualitatively consistent with previous studies which also demonstrate a cooling effect in East Asia due to the lower sea ice concentration ( Wu et al. , 2011; Liu et al. , 2012). The cooling over East Asia is related to the strengthening of the winter Siberian High (Fig. 1c). The enhanced Siberian High leads to a stronger East Asian winter monsoon which in turn results in a colder winter over East Asia. This is a possible reason why cold winters occur frequently under the effect of global warming.
The sea ice melting-induced change in zonal mean air temperature is shown in Fig. 2 as a function of latitude. In winter (Fig. 2a), the most significant warming is located over the high latitudes north of 50°N. The intensity of the warming decreases rapidly with height. As a result, the significant warming induced by the decline of sea ice is limited to the lower troposphere below 700 hPa. This may imply that sensible heat plays a very important role in the atmospheric warming of the Arctic area. The Arctic atmosphere is relatively stable in winter, which suppresses the upward transfer of heat. Thus, most of the energy is confined to the lower troposphere. There is a cooling over the upper-troposphere and stratosphere but the change is not significant at the 95% confidence level (Fig. 2a). In summer (Fig. 2b), a slight but significant warming is found around 40°N and at latitudes north of 60°N. The positive change in air temperature is generally less than 1°C but the significant warming area extends upward near 200 hPa in summer. The atmosphere appears to be relatively unstable in summer compared to winter which is favorable for the upward transfer of the warm anomaly.
For the attribution of high latitudinal warming, we adopt the method of Yanai and Tomita (1998) to calculate the apparent heat source Q1,where QR is the radiative heating rate, Lis the latent heat of condensation, Pis the precipitation rate, S is the sensible heat flux, g is the gravity acceleration, pt is the tropopause pressure, and ps is the surface pressure. Figure 3 shows the difference between the CTR and SEN simulations of the apparent heat source and its individual components of sensible heat flux, latent heat release from precipitation, and net radiation in winter.
The decline of sea ice results in a dramatic increase of 60 W m-2 in the apparent heat source over the Arctic Ocean in winter (Fig. 3a). The sensible heat flux increases by 30 W m-2 which accounts for roughly half of the increase of apparent heat source over the whole Arctic area (Fig. 3b). More exposed sea water area tends to evaporate more water vapor into the atmosphere which is favorable to the increase of precipitation. The release of latent heat from precipitation increases by 15 W m-2over the Arctic area accounting for about 25% of the increase of apparent heat source (Fig. 3c). A positive change of 10-15 W m-2 is also found in the net radiation which suggests the long-wave radiative cooling is reduced due to the decline of the Arctic sea ice (Fig. 3d). Given the importance of water vapor and cloud in radiation transfer, the decrease in long-wave radiation is likely related to the increase in atmospheric moisture and cloud due to the enhanced evaporation from the sea surface in the SEN experiment relative to the CTR experiment. The change in apparent heat source is much weaker in summer than in winter; almost no significant change is observed in the simulated results (figure not shown). As a result, the change in air temperature is also weak.
| Table 1 The Arctic sea ice area (×106 km2). |
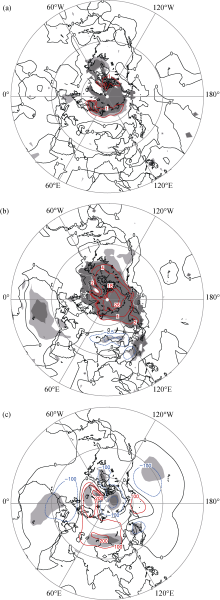 | Fig. 1 The difference between CTR and SEN: (a) Surface air temperature in summer (°C), (b) surface air temperature in winter (°C), and (c) sea level pressure in winter (Pa). The dark and light grey shaded areas show the 99% and 95% confidence level areas, respectively. |
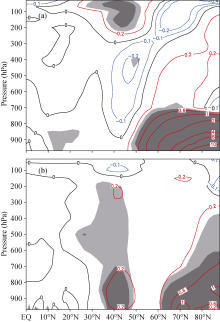 | Fig. 2 Cross-section of zonally averaged temperature difference between CTR and SEN: (a) winter (°C) and (b) summer (°C). The dark and light grey shaded areas indicate the 99% and 95% confidence level areas, respectively. |
The impact of the decline of sea ice on the Northern Hemispheric warming was examined by using the CAM3 model with current sea ice cover data and the sea ice cover under the 4×CO2 scenario produced by the INGV_ECHAM4 model. The result shows that the decline of the Arctic sea ice results in a dramatic warming over high latitudes of the Northern Hemisphere characterized by a maximum warming of more than 26°C over the Arctic area in winter. The warming is generally confined to altitudes below 700 hPa because the atmosphere is relatively stable which suppresses the upward transfer of the warm anomaly. The warming anomaly in winter is closely related to the enhanced atmospheric apparent heat source. The apparent heat source increases by about 60 W m-2 over the Arctic region in association with the decline of sea ice. The increase of sensible heat flux accounts for roughly 50% of the increase of the apparent heat source. The release of latent heat from precipitation accounts for about 25% of the increase of the apparent heat source and the change in net radiation accounts for most of the remaining 25%. The impact of the decline of sea ice on summer air temperature is weak. Our results suggest that the decline of Arctic sea ice contributes considerably to the high-latitude warming in winter. Therefore an accurate simulation of the melting of Arctic sea ice is of great importance. Unfortunately, almost all coupled models underestimated the rate of Arctic sea ice melting, which results in underestimation of the warming in future climate projection.
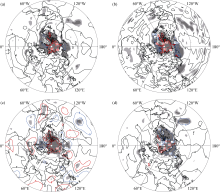 | Fig. 3 The heat source difference between CTR and SEN in winter (W m-2): (a) apparent heat source, (b) sensible heat flux, (c) latent heat of precipitation, and (d) net radiation. The dark and light grey shaded areas show the 99% and 95% confidence level areas, respectively. |
| 1 |
|
| 2 |
|
| 3 |
|
| 4 |
|
| 5 |
|
| 6 |
|
| 7 |
|
| 8 |
|
| 9 |
|
| 10 |
|
| 11 |
|
| 12 |
|
| 13 |
|
| 14 |
|
| 15 |
|
| 16 |
|
| 17 |
|
| 18 |
|
| 19 |
|
| 20 |
|
| 21 |
|