

Validated satellite-derived sea surface temperatures (SSTs) are widely used for climate monitoring and ocean data assimilation systems. In this study, the Fengyun-3A (FY-3A) SST experimental product is evaluated using Advanced Very High Resolution Radiometer (AVHRR)-merged and in situ SSTs. A comparison of AVHRR-merged SSTs reveals a negative bias of more than 2 K in FY-3A SSTs in most of the tropical Pacific and low-latitude Indian and Atlantic Oceans. The error variance of FY-3A SSTs is estimated using three-way error analysis. FY-3A SSTs show regional error variance in global oceans with a maximum error variance of 2.2 K in the Pacific Ocean. In addition, a significant seasonal variation of error variance is present in FY-3A SSTs, which indicates that the quality of FY-3A SST could be improved by adjusting the parameters in the SST retrieval algorithm and by applying regional and seasonal algorithms, particularly in key areas such as the tropical Pacific Ocean. An objective analysis method is used to merge FY-3A SSTs with the drifter buoy data. The errors of FY-3A SSTs are decreased to -0.45K comparing with SST observations from GTSPP.
Sea surface temperature (SST) is an important indicator of climate variability. SST variation in the tropical Pacific Ocean is one of the most important indices of El Niño-Southern Oscillation (ENSO), which strongly affects the Asian monsoon and global climate change ( Kawai and Kawamura, 1997). Therefore, global SST observations with high accuracy and fine resolution are necessary in climate research ( Donlon et al. , 2002). Satellite observations of the ocean that provide global coverage and high-accuracy measurements of SST have become the primary tool for studying SST variability.
Satellite-derived SST products are available in two types, infrared and microwave sensors, according to the sensors equipped on the satellites. Infrared sensors, which include the Advanced Very High Resolution Radiometer (AVHRR), are affected by clouds and volcanic aerosols in the atmosphere ( Guan and Kawamura, 2003;
As the amount of FY-3A SST experimental products increase, it becomes increasingly important to employ them in climate research and ocean data assimilation systems ( Tang et al. , 2004; Zheng et al. , 2006, Zheng and Zhu, 2010). However, it is necessary to validate the accuracy of satellite-derived SSTs in the FY-3A product before assimilated into the ocean model. Currently, the number of available in situ ocean observations is increasing, which also increases the reliability of satellite SST validation results. In this study, we evaluate the first distributed FY-3A SST experimental product with in situ observations to detect errors and provide insight to improve the quality of the final product prior to its public release. In addition, an objective analysis method is used to merge the FY-3A SSTs and in situ observations.
The evaluated FY-3A SSTs include VIRR SST products. VIRR contains two infrared channels in wavelength ranges of 10.3-11.3 μm (channel 4) and 11.5-12.5 μm (channel 5). The multichannel sea surface temperature (MCSST) algorithm was used to retrieve SSTs with accuracy of 1.0-1.5 K ( Dong et al. , 2009). The FY-3A SST measurements are based on radiance measurements from a VIRR sensor onboard the FY-3A polar orbiting satellite. These radiances were collected by FY-3A ground stations and were post-processed to produce MCSST estimates. A detailed description of the methodology for producing MCSST observations is given by McClain et al. (1985). The FY-3A data are supplied as an averaged clear-sky radiance product with a spatial resolution of 1.1 km. The daily averaged product was stored as an Hierarchical Data Format 5 (HDF5) data type and was used to decrease the match-up time window of the five-day, 10-day, and monthly averaged products.
We used the AVHRR merged product (ftp://eclipse.ncdc.noaa.gov/pub/OI-daily/) created through optimal interpolation (OI) to investigate the spatial distribution of bias in the FY-3A product. The spatial grid resolution was 0.25°, and the temporal resolution was one-day ( Reynolds et al. , 2007). Two available products are based on the merging of in situ observations of different satellite products to adjust satellite biases. One employs satellite infrared data from AVHRR, and the other uses both AVHRR and satellite microwave data from the Advanced Microwave Scanning Radiometer (AMSR). In this study, we used the AVHRR-only product to compare with FY-3A SSTs, which is provided from January 1985 to the present. Further details can be found in Reynolds et al. , 2007.
GTSPP is an international operational activity designed to provide timely access to the highest quality, highest resolution temperature and salinity profile data available (http://www.nodc.noaa.gov/GTSPP/). The primary goal of the GTSPP is to conduct global measurements of ocean temperature and salinity and to offer quick and easy access to the results. The GTSPP handles all temperature and salinity profile data, which include observations by using water samplers and continuous profiling instruments such as Argo floats and other devices to measure conductivity, temperature, and depth (CTDs) ( Chu, 2011). Including the Argo floats data, the yearly number of tem-perature and salinity profiles was approximately 1.7 mil-lion in 2009. Quality control of the GTSPP data is divided into real-time and delayed-time modes and is handled by various offices ( Sun et al. , 2009). We downloaded real- time GTSPP data from the Internet to obtain further quality control and more reliable in situ SSTs.
To examine simple quality control for the FY-3A SSTs data, we calculated the area-mean (MEANa) and standard deviation (STDa) of available satellite derived SSTs in each area of 0.25°×0.25°. When an absolute value of (SST-MEANa) was greater than twice the STDa, the SST observation was discarded. The selected FY-3A SSTs were then interpolated linearly onto AVHRR grids with spatial resolution of 0.25° to reduce high resolution of the FY-3A SST product.
Availability of FY-3A SSTs was defined as the ratio of the number of available FY-3A SSTs to the total number of ocean grid points in the AVHRR grids ( Qiu et al. , 2009). The monthly mean SST availabilities of FY-3A SSTs were in the range of 24.1%-29.3% with an annual mean value of 26.5% (not shown). The daily availability of FY-3A SSTs changed significantly during February 2012, which may have been caused by the process of cloud detection. The distributions of annual mean AVHRR-merged SSTs and FY-3A SSTs, shown in Figs. 1a and 1b respectively, indicate that the FY-3A SSTs were cooler than AVHRR-merged SSTs. The difference between these two satellite products was investigated by subtracting AVHRR-merged SSTs from FY-3A SSTs (Fig. 1c). A cool bias of more than 2 K was present in most of the tropical Pacific and low-latitude Indian and Atlantic Oceans in the FY-3A SSTs. However, a 2 K warm bias was present in the Arctic waters. The difference in these two products was relatively smaller in middle-latitude oceans. Thus, the SST retrieval algorithm could be improved by using an area-dependent algorithm in the future.
In situ SST observations are used to assess the accuracy of FY-3A and AVHRR-merged SSTs and to confirm actual cool/warm bias in FY-3A. The in situ SST observations were obtained from GTSPP. A matchup database among FY-3A, AVHRR-merged, and in situ observed SSTs containing collocated observations was produced. We averaged the SST observations from GTSPP within each AVHRR grid (0.25°×0.25°) for daytime (7:00-19:00 LT) to correlate with FY-3A and AVHRR-merged SSTs, which is similar to the method used by Qiu et al. , 2009.
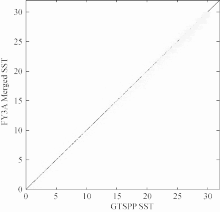
The relationship between the satellite-derived and in situ SSTs is shown in Fig. 2. FY-3A SSTs had a negative bias in the range of approximately 25-31 K and both negative and positive bias in the range of approximately 15-22 K. The range of approximately 0-5 K was observed more in AVHRR-merged SSTs than that in FY-3A SSTs. Mean bias±STD of FY-3A and AVHRR-merged SST was -2.77±1.65 K and -0.01±0.47 K, respectively. The bias and STD of AVHRR-merged SST were smaller than those of FY-3A. The monthly variation of biases between the satellite-derived SSTs and in situ observations is shown in Fig. 3. The bias of FY-3A SSTs was negative at approximately -3 K and did not exhibit obvious seasonal variations. In contrast, AVHRR-merged SSTs showed a small positive bias from March to April 2012 and a smaller negative bias in other months. Although FY-3A SSTs were not merged in the in situ observations as AVHRR SSTs, the error in FY-3A SSTs is significantly large; thus, the algorithm of FY-3A SSTs should be improved in the future.
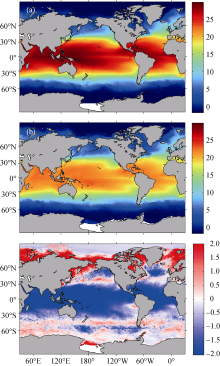 | Figure 1 Annual mean (a) AVHRR-merged SSTs, (b) FY-3A SSTs, and (c) difference between AVHRR-merged and FY-3A SSTs during the period of 1 April 2011 to 1 April 2012. |
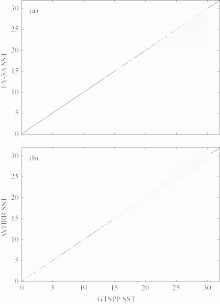 | Figure 2 Scatter diagrams of (a) FY-3A and GTSPP SSTs and (b) AVHRR and GTSPP SSTs. Black lines indicate satellite SSTs equal to GTSPP SSTs (units: °C). |
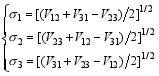
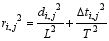
It is important to understand of the error characteristics of FY-3A SSTs before they are used in global ocean data assimilation. Following ( O’Carroll et al., 2008), the error variance in the FY-3A, AVHRR-merged, and in situ observed SSTs can be estimated from the observation difference statistics, assuming the errors of these three observation types are unrelated. A set of simultaneous equations for estimating the error variances
To determine the regional error for these observation types and to develop the area-dependent algorithm for FY-3A SSTs, we estimated the error variance in the Pacific Ocean, Indian Ocean, North Atlantic Ocean, and South China Sea. The estimated error variances of these three observation types are summarized in Table 1. Error variance differences were significant in specific areas for FY-3A SSTs, with the maximum (minimum) error variance existing in the Pacific Ocean (North Atlantic Ocean). The difference between maximum and minimum values of error variance reached up to 0.5 K, while the regional error variance difference in AVHRR-merged SSTs was smaller. The error of in situ observation was less than 0.5 K, and the largest error existed in the South China Sea, which may be related to complex observing conditions and relatively fewer observations. In addition, the seasonal variation in error variance of FY-3A SSTs was significant, particularly in the boreal winter and autumn, which was also detected in AVHRR-merged SSTs. The regional and seasonal variations of error variance in FY-3A SSTs were obvious, which encourages the development of regional and seasonal SST retrieval algorithms, particularly in key area such as the tropical Pacific Ocean.
A global operational SST product with appropriate resolution in space and time is required in the global ocean data assimilation system. The quality of FY-3A SSTs should be improved before they can be assimilated in the second generation of the Global Ocean Data Assimilation System of the Beijing Climate Center (BCC_ GODAS2.0). A relatively simple method used to decrease the errors of FY-3A SSTs is the merging of these temperatures with drifter buoy SSTs (http://www.meds-sdmm.dfo-mpo.gc.ca/isdm-gdsi/index-eng.html). The system errors are partly eliminated by calculating the difference between monthly averaged FY-3A and AVHRR- merged SSTs. Objective analysis is then applied to merge the FY-3A and drifter buoy SSTs to further decrease the errors, which is similar to the method introduced by Guan and Kawamura (2003):
Considering that various SST data are available with irregular spatial and temporal gaps from drifter buoy data, the weighting matrix W is given by: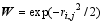
FY-3A and drifter buoy data obtained during one year from April 2011 to March 2012 were merged. However, those from high-latitude oceans in excess of 60° were exempted because they offer few observations and are influenced by sea ice. The in situ SSTs from GTSPP were used to evaluate the accuracy of the merged SST products. Figure 4 shows the comparison of merged and buoy 10-day mean SSTs. The errors of FY-3A were obviously decreased, and the biases between the FY-3A and GTSPP SSTs were decreased from -2.77 to -0.45 K.
| Table 1 Seasonal and regional error variance of FY-3A, AVHRR- merged, and GTSPP. |
FY-3A SST experimental product was quantitatively evaluated for one year from April 2011 to April 2012 in global oceans by using AVHRR-merged SSTs and in situ SST observations from the GTSPP. A comparison of AVHRR-merged SSTs revealed a negative bias of more than 2 K for FY-3A SSTs in the tropical Pacific and Indian Oceans and a positive bias of 2 K in the Arctic waters. Validation of the two satellite-derived SSTs by using in situ observations showed that the mean bias±STD of FY-3A and AVHRR-merged SST were -2.77±1.65 K and -0.01±0.47 K, respectively. The FY-3A SSTs exhibited regional error variance in the global oceans with a maxi- mum error variance of 2.2 K. The regional and seasonal differences between the maximum and the minimum value of error variance were more than 0.5 K, which indicates that the quality of FY-3A SST could be improved by adjusting parameters in the SST retrieval algorithm and by applying regional and seasonal algorithms. An objective analysis method was used to merge FY-3A SSTs with the drifter buoy data. The errors of FY-3A SSTs were decreased to -0.45 K over SST observations from the GTSPP. The FY-3A SST product merged by using the objective analysis method is only a substitute for global ocean data assimilation with an improved FY-3A SST product, including a new retrieval algorithm, which will be released in the near future.
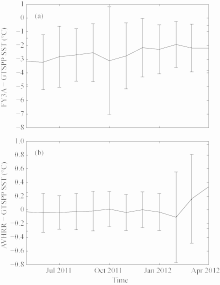 | Figure 3 Monthly bias and standard deviations of (a) FY-3A and (b) AVHRR against GTSPP SSTs during the period of 1 April 2011 to 1 April 2012. |
 | Figure 4 Comparison of FY-3A merged and GTSPP 10-day mean SSTs from April 2011 to March 2012 (units: °C). |
| 1 |
|
| 2 |
|
| 3 |
|
| 4 |
|
| 5 |
|
| 6 |
|
| 7 |
|
| 8 |
|
| 9 |
|
| 10 |
|
| 11 |
|
| 12 |
|
| 13 |
|
| 14 |
|
| 15 |
|