

The present study quantifies the relationship between ultraviolet-B (UVB) and broadband solar radiation (
A portion of the radiation emitted by the Sun that crosses the atmosphere to reach the Earth’s surface is known as total shortwave, broadband, or global solar radiation ( G). The spectrum of this radiation includes visible, ultraviolet (UV), and infrared wavelengths. The extra-terrestrial solar spectrum has a UV component that accounts for 9.3% of all solar radiation ( McKenzie et al., 1995). The complete UV waveband covers the wavelength range of 100-400 nm. According to biological responses, UV radiation can be divided into three bands: UVA (315-400 nm), UVB (280-315 nm), and UVC (100- 280 nm). The Earth’s surface receives only UVA and UVB because the UVC component is removed by absorption through the protective ozone layer (O3). Before passing through the atmosphere, the UVA and UVB radiations represent 5.9% and 1.33%, respectively, of the total radiation ( Iqbal, 1983). Although the UVB radiation band represents only a small fraction of extraterrestrial solar radiation, it accounts for 80% of the harmful effects of exposure to the Sun ( Cañada et al., 2007). The beneficial and damaging effects of UVB radiation on humans, the ecosystem, animals, plants, and materials have been extensively studied and reported by several authors (e.g., Juzeniene et al., 2011; Calbó, 2005; McKinlay and Diffey, 1987; Vander Lean et al., 1989; Kripke, 1992; Webb, 1998).
Additional details about the evolution of UVB values at ground level in Qena, Egypt, can be found in works by El-Noubi (2006), Adam and El Shazely (2007), Basset and Korany (2007), Robaa (2008), Adam ( 2010, 2011a, b, 2012), and El-Noubi (2012). Adam (2011a) assessed the role of the atmosphere as a protective cover that shields the biosphere from damaging doses of UVB. Adam (2011a) concluded that although average hourly UVBext represents 1.56% of the corresponding value of extraterrestrial global solar radiation, the ratio of average hourly UVB to the corresponding values of global solar radiation (UVB/ G) at the Earth’s surface was 0.27% because the degree of attenuation of the UVB is significantly greater. On average, 93.42% of UVB radiation is lost as it passes through the atmosphere, and only 6.58% reaches the Earth’s surface. Moreover, an average of 52.17% of G solar radiation is reduced during its path through the atmosphere. Adam (2011a) also discussed the dependence of the hemispherical transmittance of UVB on the solar zenith angle. In addition, Adam and El Shazely (2007) studied the UVB reducing effect of cloud macrophysical parameters and summarized that the difference between high- and mid- and low- level is apparent if more than 10% of the sky is covered. Furthermore, Adam ( 2010) showed the effect of stratospheric ozone in UVB reaching the Earth’s surface in Qena and determined that the value of the UVB radiation amplification factor was equal to 1.05.
Further, Adam ( 1995, 2011a), El Shazly et al. (1997), and Ahmed (2008), discussed Gvariability over Qena. Adam ( 1995) studied the characteristics of G and its diffuse component related to aerosols, and clearly showed the abundance of solar energy in Qena and the suitability of its climate for various applications. In addition, Adam (2011b) described the effect of clouds (macro-physical parameters) on G, which shows a very low cloud effect for cloud amounts less than three octas. No obvious effect of high-level cloud amounts is apparent in G; the strongest effect is due to low-level cloud amounts. In addition, G is reduced considerably more by mid-level clouds than that by high-level clouds.
Discussion of the variability of UVB and G is beyond the scope of this study; however, this study does describe the relationship of the reach of UVB and G solar radiation to ground level under all sky conditions. However, Escobedo et al. (2011) reported that one practical way to estimate UV is by using empirical expressions derived from the correlation between G and its spectral component. The major advantage of this empirical expression is that it is simple to use and depends only on G at the surface, which is the type of solar radiation data most widely available. However, previous studies developed empirical relationships between the daily integrated totals for UVB as a function of those totals for G; Webb and Steven (1986), used a monthly basis, and Basset and Korany (2007) and Robaa (2008) used a period basis. In addition, Kudish and Evssev (2000) established empirical models to estimate UVB from G by using hourly data of both parameters on monthly and seasonal bases. This study has adopted an approach similar to those studies by using monthly and seasonal bases and has utilized hourly values of both UVB and G. Moreover, a general expression from 2001 to 2009 was developed.
Thus, the main objective of this work is to develop empirical models for UVB as a function of G. The significance and performance of these empirical models have been evaluated with the aid of several procedures of statistical analysis.
The site of this study was South Valley University, Qena (26.2°N, 32.75°E, and 96 m above mean sea level). Qena is the capital city of Qena governorate, which has three million inhabitants, according to a 2006 estimate. The city itself has 220000 inhabitants (2009 estimate) and an area of 1800 km2 situated on the east bank of the Nile in the southern part of Egypt between the western and eastern desert. It lies within the subtropical region, and its terrain is semi-desert. The climate of Qena is characterized by a hot season from March to September and a cold season from October to February ( Robaa, 2008).
The present study used data from 10-year hourly integrated totals of both UVB and G (26400 hours) at South Valley University (SVU) meteorological research station. For the purpose of developing the empirical model for estimating UVB, 23880 hourly measurements of UVB and G from 2001 to 2009 were used. Verification results of the derived empirical models were performed through data obtained during 2000 (2520 hours). Many sources offer good descriptions of UVB and G at the SVU meteorological research station (e.g., Adam, 2011a, b, 2012; Adam and El Shazly, 2007; El-Noubi, 2006). Adam ( 2011a, b) reported that the station conducted measurements of hourly UVB value (MJ m-2h-1) and hourly G (MJ m-2h-1) at the horizontal surface. Model UVB-1 Ultraviolet Pyranometer No. 960842, Yankee Environmental Systems, Inc. (YES), was used to measure the total irradiance from 280 to 320 nm. In addition, the Precision Spectral Pyranometer (PSP) No. 16317IS, which is an ISO (International Standardization Organization) 9060 secondary standard Pyranometer with a spectral range of 295-2800 nm, was used to precisely measure G. The PSP is the Pyranometer most commonly used by national meteorological officials in worldwide meteorological networks. The Combilog Datalogger (No. 1020, TH. Friedrichs & Co. “Germany”) recorded the values of hourly UVB and G. The accuracy of the Pyranometer corresponds to the first class, according to the World Meteorological Organization classification. The Egyptian Meteorological Authority (EMA) is responsible for the scientific advice and calibration of the Egyptian Monitoring Network ( Adam, 2010). Pyranometer calibration is performed by using the method recommended by the World Meteorological Organization, which involves running an additional reference Pyranometer on an outdoor test stand at the same time and comparing the results. These instruments are calibrated each year against a reference instrument traceable to the World Radiometric Reference (WRR) maintained at Davos, Switzerland (World Radiation Centre (WRC), 1985, 1995). The absolute accuracy of calibration is ±3%-4% ( El-Metwally, 2004). The resolution of these instruments is 1 W m-2.
First, the primary statistics of the database used in this study were employed. The values of both G and UVB, in MJ m-2h-1, were reported as average hourly values (Ave) throughout the entire period of this study (2000-09, Table 1). In addition, the maximum (Max), minimum (Min), standard deviation (Std), and the number of hours ( n) within the entire period of this study are listed in the table. The results show, that the maximum of the average hourly G was 2.952±0.720 MJ m-2h-1at 1200 LST and that the maximum of the average hourly UVB was 0.010±0.003 MJ m-2h-1at 1200 LST. The averages of hourly values of both G and UVB reduced steadily from 1200 to 0800 LST (1.437±0.700 MJ m-2h-1 and 0.003±0.002 MJ m-2h-1, respectively), and G and UVB also reduced from 1200 to 1700 LST (0.844±0.679 MJ m-2h-1 and 0.002±0.001 MJ m-2h-1, respectively). These results reflect a similar behavior for both Gand UVB, which may be due to the diurnal apparent motion of the Sun around the Earth. Moreover, the coefficient of variation, which is defined as the ratio of the standard deviation to the mean values, gives an indication of the dispersion of the values ( Lee, 2002). For both G and UVB, the coefficients of variation values were relatively high at 22%-80% and 32%-76%, respectively, which may be due to the average hourly values of G and UVB and their standard deviation being calculated throughout the entire period ( Adam, 2011a; Kudish et al., 2005).
To examine the relationship between hourly values of both G and UVB parameters, many types of correlation including first-, second-, and third-order polynomials in addition to power and exponential functions were used to determine the best fit between them for each year through the period of this study. Figure 1a shows the dependence of the hourly values of UVB on G for each year from 2000 to 2009. According to our results, the second-order polynomial had the highest correlation of determination ( r2) between the two parameters; the values of r2 were greater than 0.96 for the various years. The scattered data shown in Fig. 1a may be due to multiple factors affecting the different bands of the solar radiation such as clouds and aerosols. As previously mentioned, this study does not discuss the effects of these factors on both UVB and G; rather, it describes the relationship between them at ground level under all sky conditions. Figure 1a reflects that the data are in good agreement whereby the values of UVB increase with increasing G. This result enabled us to investigate an empirical relationship for estimating UVB from the values of G under all sky conditions.
For the purpose of developing a general empirical model to estimate UVB, all cases of hourly measurements of both UVB and G during 2001-09 were used. Figure 1b shows the relationship between the two parameters at the study area during 2001-09. Data obtained during 2000 was used to test the validity of the derived empirical regression models. In addition, monthly and seasonal (cold and hot season) empirical models were employed during the same period. For the three cases (monthly, seasonal, and 2001-09), the second-order polynomial had the highest correlation of determination between the two parameters. For each month and season, as well as for the period from 2001 to 2009, the following functional relationship between UVB and G was obtained:
UVB= aG2+ bG, (1)
where aand b are coefficients.
Table 2 illustrates the values of a, b, r2, and the number of observations ( n) of Eq. (1) for the three cases. The values of r2 varied from 0.90 in January to 0.97 in September. In addition, the r2 value was greater in the hot season than that for the cold season at (0.95 and 0.93, respectively. This table reflects differences in the values of r2from month to month, as well as from season to season, which may be due to the variations in some geometrical and atmospheric factors that affect both parameters. Previous studies indicate that the atmospheric compounds showing the strongest influence on UVB radiation are ozone, aerosols, and clouds. Moreover, other gases such as water vapor control the radiation levels in the G range on the ground ( Marín et al., 2007, Jacovides et al., 2009, Bilbao et al., 2011, de Miguel et al., 2011); this effect will be examined in detail in a forthcoming paper. Therefore, our models may be applicable to our region and those with similar climatic features. These values of r2 are comparable to those reported in previous research such as that by Kudish and Evssev (2000). For the period from 2001 to 2009, r2 value of the relationship between UVB and G was equal to 0.96, which indicates that the computed regression line has explained approximately 96% of the variability of UVB. This result indicates that all proposed empirical regression functions show satisfactory accuracy and can be used to predict an estimated value for the UVB component. A similar value of r2 has been reported by other authors such as Basset and Korany (2007) and Robaa (2008). Basset and Korany (2007) studied the relationship between daily values of UVB and G in the study area from April 2000 to September 2001 and deduced a linear formula for estimating daily values of UVB from the G with an r2 value of 0.96. Robaa (2008) also established a linear regression formula to estimate the daily values of UVB from G at Qena and determined the same r2 value. Although the r2 of Eq. (1) is effective (see Table 2), good model accuracy is not automatically indicated ( Willmott, 1981, 1982). Therefore, according to the recommendation of Calbó et al. (2005), additional statistical parameters were used to assess model performance ( Spokas and Forcella, 2006, Mayer and Butler, 1993), which include the modeling index ( d), ME, RMSE, MBE, and MAE. The values of modeling index vary between zero and one, with a value of one indicating perfect model agreement. Coefficients of modeling efficiency vary between minus infinity and one, with higher values closer to one indicative of superior model performance ( Legates and McCabe, 1999).
The proposed equation (Eq. (1)) was used to estimate UVBfor new measurements of G at Qena as a test of validity. Measured data of hourly Gduring a new period (2000) are introduced in (Eq. (1)) to estimate the corresponding values of UVB under all sky conditions. These estimated values were compared with the corresponding measured values of hourly UVB during the same period for the monthly and seasonal models, as well as a general expression for the period from 2001 to 2009. Table 3 shows the values of r2, d, ME, RMSE, MBE, and MAE for the monthly and seasonal models in addition to the general expression for the period from 2001 to 2009. The coefficient of correlation and the number of hours comprising the individual databases are also listed in the table. The results reflect that the values of d and ME are close to one for all three cases, which indicates good agreement between the measured and estimated values of UVB. In addition, the values of RMSE, MBE, and MAE were lower than the experimental errors at less than 0.18%, 0.16%, and 0.16%, respectively, which indicates that all proposed models, including those for monthly and seasonal bases, can be used to estimate the hourly UVB from the hourly G. In addition, the general expression can be used to determine UVB by using G data for simplifying the prediction process. Figure 1c represents the measured versus estimated values of UVB during 2000 by using the general expression; the correlation coefficient ( R) between these values was 0.98. In addition, Fig. 1d shows the diurnal variation of UVB values estimated by using the general expression and those measured for various days selected during 2000 that include cloudless and cloudy hours. Good agreements of estimated and measured values of UVB were obtained. The R values were high for all of the chosen days and varied from 0.98 to 0.99.
The above statistical analysis indicates that the hourly UVB estimated from the measured hourly G are in relatively good agreement with the values measured at Qena. This indication applies to all three statistical measures, with relatively low values of RMSE, MBE, and MAE. The results of this analysis are similar to those reported by other authors who used the daily values of UVB and G to develop empirical models between them such as Webb and Steven (1986), Basset and Korany (2007), and Robaa (2008). In addition, Kudish and Evssev (2000) used the hourly values of UVB and G to assess the relationship between them at Neve Zohar (Dead Sea) and Beer Sheva for each month and season. They concluded that the relationship between UVB and Gwas an ineffective predictor of UVB hourly values. However, the seasonal relationship was determined to be as good as that of the corresponding individual monthly predictors.
| Table 1 Average, maximum, minimum, standard deviation, and number of observation of hourly global solar radiation ( G) and ultraviolet-B (UVB), in MJ m-2h-1, under all sky conditions at Qena, Egypt, from 2000 to 2009. |
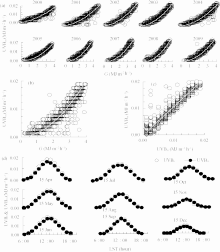 | Figure 1 The relationship between ultraviolet-B (UVB) and global solar radiation ( G) for (a) each year and (b) the period from 2001 to 2009; (c) Scatter plots of estimated (UVBe) versus measured (UVBm) values of UVB through 2000; (d) Diurnal variation of UVBe and UVBm values of UVB for selected days during 2000. |
| Table 2 Values of a, b, and the correlation of determination ( r2) of Eq. (1) and number of observations ( n) for each month and season, as well as for the period from 2001 to 2009. |
Statistical analysis of 10-year hourly measurements of both UVB and G on a horizontal surface was performed at SVU meteorological research station. The results are summarized in the following points:
Relationships between hourly UVB and hourly G have been determined to be effective predictors of hourly UVB.
On monthly and seasonal bases, the accuracy of UVB estimation was tested to assess model performance. The values of d and ME were close to 1; values for each month and season were greater than 0.99. In addition, the values of RMSE, MBE, and MAE were lower than the experimental errors at less than 0.18%, 0.16%, and 0.16%, respectively.
To simplify the prediction process, a general expression was tested to quantify the relationship between the reach of UVB and G to the ground level, and hourly values for both parameters were used during the period from 2000 to 2009. This expression was determined to be as good as the corresponding individual monthly or seasonal equations. The R value between the measured and estimated UVB was 0.98. This general expression is recom mended for estimation of the hourly UVB values when it difficult to obtain measurements or when measurements are available only for limited periods at the studied region or at those with similar climates.
| Table 3 Values of r2, modeling index ( d), coefficient of modeling efficiency (ME), root mean square error (RMSE), mean bias error (MBE), and mean absolute error (MAE) for the relationship between measured and calculated values of UVB based on monthly and seasonal values in addition to the entire period of study; n used in each relation is also illustrated. |
The authors would like to thank the Program Research Center at Arabic Language Institute, Deanship of Scientific Research, King Saud University, Riyadh, Saudi Arabia, for funding and supporting this research.
| 1 |
|
| 2 |
|
| 3 |
|
| 4 |
|
| 5 |
|
| 6 |
|
| 7 |
|
| 8 |
|
| 9 |
|
| 10 |
|
| 11 |
|
| 12 |
|
| 13 |
|
| 14 |
|
| 15 |
|
| 16 |
|
| 17 |
|
| 18 |
|
| 19 |
|
| 20 |
|
| 21 |
|
| 22 |
|
| 23 |
|
| 24 |
|
| 25 |
|
| 26 |
|
| 27 |
|
| 28 |
|
| 29 |
|
| 30 |
|
| 31 |
|
| 32 |
|
| 33 |
|
| 34 |
|
| 35 |
|
| 36 |
|
| 37 |
|
| 38 |
|