

The changes in hydrological processes in the Yellow River basin were simulated by using the Community Land Model (CLM, version 3.5), driven by historical climate data observed from 1951 to 2008. A comparison of modeled soil moisture and runoff with limited observations in the basin suggests a general drying trend in simulated soil moisture, runoff, and precipitation-evaporation balance (P-E) in most areas of the Yellow River basin during the observation period. Furthermore, annual soil moisture, runoff, and P-E averaged over the entire basin have declined by 3.3%, 82.2%, and 32.1%, respectively. Significant drying trends in soil moisture appear in the upper and middle reaches of the basin, whereas a significant trend in declining surface runoff and P-E occurred in the middle reaches and the southeastern part of the upper reaches. The overall decreasing water availability is characterized by large spatial and temporal variability.
Water availability is a key factor affecting the socio- economic development of a region. Therefore, an understanding of changes in water availability is important for management and ensuring future availability to meet continuing demands. In recent years, increasing attention has been paid on climate change and its effects on global and regional water availability. Scientists have determined that the timing and magnitude of soil moisture and runoff are changing as the climate warms ( Dai et al., 2009; Sheffield and Wood, 2008). Additionally, rising temperatures result in less snowfall and earlier melting of snow in middle and high latitudes as well as in mountainous regions, which in turn leads to marked changes in the amplitude and phase of runoff in those regions ( Feng and Hu, 2007; Stewart et al., 2005). Studies based on both observations and models show significant declines in various categories of water availability in middle latitudes following climate warming; furthermore, these decreases vary in intensity by region ( Dai et al., 2004; Sheffield and Wood, 2008).
The Yellow River basin covers a semi-humid to semi- arid portion of northern China and supports more than 100 million residents and 10 million hectares of cultivated land. The Yellow River basin is well known for its long history and rich culture in addition to its fragile ecological environment and limited water availability ( Fu et al., 2004; Ringler et al., 2010). Recent climate and land use-land cover changes have caused complex changes in water availability in the basin. Observations suggest decreases in annual precipitation and increases in mean annual temperature in the basin since the 1970s ( Huang et al., 2009). Between 1900 and 2000, observed runoff decreased, zero-flow days occurred frequently, and the timing of hydrologic events tended to be earlier ( Zhang et al., 2009). An additional measurement of water availability, soil moisture that modulates water and energy transfer between land and air, showed considerable variations over the entire basin ( Wang et al., 2010). These changes necessarily affect the local and regional climate and ecological environment.
Although water availability is important to the ecological environment and local climatic conditions in the Yellow River basin, only a few studies at a limited number of stations have been conducted within this basin to evaluate changes in water availability based on observed stream flow, precipitation, and soil moisture. In this study, we focus on temporal and spatial variations of water availability. We develop a high spatial-temporal resolution atmospheric forcing field based on in-situ observations from 1951 to 2008. In addition, we simulate the complete hydrological cycle over the basin. On the basis of our results, we analyze the spatial distributions and long-term trends of water availability for the entire Yellow River basin.
The hydrological processes of the Community Land Model (CLM, version 3.5) consist of canopy interception, snow accumulation and ablation, infiltration, surface and subsurface runoff, and soil moisture movement. Detailed physical processes and modifications in CLM3.5 have been reported by Oleson et al. ( 2004, 2008) and Stockli et al. ( 2008). CLM3.5 has recently been updated to CLM4.0, which includes modification of the hydrology scheme and snow model, extension of a carbon-nitrogen model, and incorporation of other minor changes ( Lawrence et al., 2011; Oleson et al., 2010). In this study, the exploration of water availability variations in the Yellow River basin is based on CLM3.5 simulations; however, some developments of the hydrological processes determined by CLM4.0 have been incorporated.
For this study, atmospheric forcing consisted of air temperature, wind speed, specific humidity, surface pressure, total incident solar radiation, and total precipitation. The subdaily air temperature, wind speed, precipitation, and surface pressure were obtained from the in-situ observations of Chinese weather stations during 1951-2008. The quality of these variables was verified by following the procedures described by Feng et al. (2004). Although the number of weather stations in service has changed over the years, more than 650 stations have measured the above four weather variables since 1958. These stations are fairly evenly distributed in the Yellow River basin. Specific humidity was calculated from observed dry and wet bulb temperatures. These five six-hourly variables were interpolated to three-hourly temporal resolutions and 0.5° × 0.5° latitude and longitude grid cells using geostatistical interpolation and quality control schemes ( Li et al., 2011). Due to limited observations, however, solar radiation was obtained from the dataset described by Sheffield et al. (2006) and was then aggregated into the same 0.5° × 0.5° latitude and longitude resolution. Because five of the six weather variables were determined through observations, this forcing field, referred to as ObsFC, largely reduced the biases in regional climate simulations such as National Centers for Environmental Prediction (NCEP) and European Centre for Medium-Range Weather Forecasts 40-year re-analysis (ERA40) ( Bosilovich et al., 2008; Reid et al., 2001). On a fine spatial resolution such as that used in this study, observation-based forcing is a more realistic method used to record local weather changes such as local precipitation, air temperature, wind speed, and surface pressure. Therefore, this forcing field is helpful for investigating the regional surface processes occurring within the Yellow River basin.
Observed soil moisture and stream flow were compiled to evaluate the performance of CLM3.5. These soil moisture data were obtained from measurements of Chinese Agro-meteorological Stations (CAS) from the 1980s or 1990s to 2002, depending on location; details have been described by Li and Ma (2010). We selected 25 stations of CAS with relatively complete and lengthy measurements in the Yellow River basin and 40 stations from the global soil moisture data bank over China ( Robock et al., 2000) to validate the soil moisture simulation by CLM3.5/ObsFC. The naturalized stream flow, gauged at Lijin station during 1950-2001, was used to evaluate total runoff simulations including surface runoff and subsurface drainage.
CLM3.5, driven by ObsFC and Moderate-resolution Imaging Spectroradiometer (MODIS) land use-land cover data refined by Lawrence and Chase (2007), was run repeatedly eight times during 1951-2008 to ensure that the deep soil water cycle was in complete equilibrium. The simulation used the available land surface data released with CLM3.5. For each model run, dynamic global vegetation and river transport models were activated. The spatial resolution of hydrological simulation by CLM3.5 was 0.5°, which is the same as the forcing field, and the temporal resolution was three-hour. This simulation is referred to as CLM3.5/ObsFC.
The water availability simulation of CLM3.5 was evaluated by comparing simulated soil moisture and runoff with gauging data. Soil moisture observations were available only on a sparse station network with lengthy gauging intervals of approximately 10 days. Two common issues were observed during evaluation of the simulated soil moisture: 1) the soil layer depths for the model did not fully correlate with those of observations and 2) simulated soil moisture represented space-time mean while observations were instantaneous values. Although a number of technical methods can be used to solve these issues, all include interpolation errors. In this study, the grid cells with available observations were selected first. Simulated soil moisture for layers one to six (0-49.29 cm) on these grid cells were then averaged and compared to observed soil moisture for 0-50 cm soil layers. Simulations below 50 cm were not compared due to a lack of available observations.
The comparison of daily soil moisture from CLM3.5/ ObsFC with observations indicates significant correlation at most of the grid cells; 19 of the 25 grid cells were at the 99% confidence level, and one cell was at the 95% confidence level according to the two-tailed t-test. However, the correlation coefficients ( r) were less than 0.3, and the standard deviations of observations were less than 0.4 in some locations. In particular, the correlation coefficients for the middle and lower reaches were all at the 99% confidence level. The simulated annual mean soil moistures were significantly correlated with observations in middle and lower reaches at r = 0.782 and 0.965, respectively. Moreover, simulated and observed annual soil moisture showed consistently decreasing linear trends during the overlapping period.
To further evaluate the model simulations, we compared averaged soil moisture simulations with the observations at 40 stations from the global soil moisture data bank from 1981 to 1991. The model effectively captured annual variations of observed soil moisture. The correlation between the observed and simulated value was as high as 0.83 and at the 99% confidence level. In addition, the simulated runoff showed interannual variations and linear trends similar to those of the naturalized stream flow reported at Lijin station during 1960-2000. The correlation of r = 0.80 between simulated runoff and observations was highly significant. Moreover, comparisons of modeled soil moisture from multiple forcing also indicate that observation-based forcing facilitated soil moisture simulation ( Li and Ma, 2010).
In this section, the variations in water availability over the Yellow River basin are described in terms of modeled and observed stream flow at Lijin station.
Here we analyze temporal variations in observed precipitation, air temperature, simulated soil moisture, runoff, and precipitation-evaporation balance (P-E), which is defined as precipitation minus evaporation, averaged over the entire Yellow River basin. Annual precipitation slightly decreased at a rate of 0.34 mm yr-1 during 1951-2008 (1.08 mm yr-1 during 1958-2008), which resulted in a decrease of 4.5%, or 20 mm, during the past 58 years. On the contrary, annual air temperature increased by 3.3°C during the past 58 years. These results are generally consistent with analyses reported by Huang et al. (2009) on the trends of precipitation and temperature for 1957-2005. Rising temperature and reducing precipitation collectively led to significant decreases in total runoff, P-E, and soil moisture. Measured stream flow, P-E, and soil moisture decreased linearly by 82.2% (1950-2001), 32.1%, and 3.3%, respectively, during the past 58 years. The decreasing trends in water availability accelerated since late 1980s following an intense warming trend.
Seasonal changes in simulated soil moisture and gauged stream flow showed appreciable downward trends. Although soil moistures in winter (December-January- February, DJF), summer (June-July-August, JJA), and autumn (September-October-November, SON) decreased with nearly the same linear trends at -0.014 v v-1 yr-1, while that detected in spring (March-April-May, MAM) was nearly double at -0.027 v v-1 yr-1, suggesting that soil moisture is more sensitive to the climate changes in spring. Stream flow in wet seasons of JJA and SON showed a more significant reduction than that in dry seasons of DJF and MAM. Of the latter two, the reducing trend in MAM is more intense.
To characterize the influence of temperature and precipitation on soil moisture and runoff production, we analyzed nine-year running correlations between soil moisture and runoff with observed precipitation and temperature. Considerable fluctuations were observed in the relationships during 1951-2008. Precipitation generally had a stronger correlation with runoff than soil moisture, whereas temperature was slightly closer to soil moisture than runoff. These correlations changed periodically with time. Stronger correlations were observed between the two variables and precipitation and temperature around 1970 and 1985, whereas weaker correlations were observed around 1975 and 1990. Since the late 1990s, soil moisture and runoff have had almost no correlation with precipitation and temperature. These changes in correlation are associated with the variations of precipitation and temperature. Decreasing precipitation with rising temperature allows the attributes of soil and land coverage to exert more dominant impacts on the variations of water availability, while increasing precipitation with falling temperature causes variations in water availability to be more consistent with the climatic elements.
Spatial distribution of the components of water availability averaged from 1970 to 2000 (Fig. 1) shows that soil moisture decreased gradually from southeast to the northwest in the basin. Additionally, soil moisture was relatively high in the eastern plain and the Weihe River catchment and was lower over the mountains. The lowest soil moisture value was reported over the Mu Us sandy land and the northwestern arid regions. Modeled soil moisture was relatively high in the Yellow River source area due to the effects of numerous lakes and the humid plateau climate. The spatial distribution of simulated soil moisture generally agreed with observationally based results ( Zhou et al., 2008) and remote-sensing soil moisture patterns ( Nie et al., 2008; Piao et al., 2003, 2005). The geographic distribution of runoff was characterized by a gradual decline from south to north in the basin, which resembled the spatial pattern of P-E but did not quite match that of soil moisture. The similarity between mean surface runoff and precipitation and P-E indicates dominant control by P-E on a long-term scale. Both spatial patterns of mean magnitude and trends were quite similar between runoff and P-E (Figs. 1 and 2), which indicates that P-E is a fundamental factor in determining the spatial patterns of runoff and its variations on a long-term scale. Regarding soil moisture, runoff, and other components of surface water availability, a shortage of water availability was observed over the area north of 36°N latitude and west of 110°E longitude; however, water was comparatively abundant in the southern and eastern regions of the basin.
Figure 2 shows the spatial patterns of linear trends indicated by the slope of the least-squares regression line of the components of water availability from 1960 to 2008; the uniform period of 1951-1959 was eliminated. Soil moisture decreased across the major regions of the Yellow River basin except for the lower reaches. A weak increase in soil moisture of approximately 1.5% of the entire basin appeared in the lower reaches. Relatively significant drying trends occurred across the middle-upper reaches, parts of the northern region, and middle reaches such that soil moisture showed a maximum decrease of 7.4% points from 1960 to 2008. Similar drying trends were identified in the semi-arid regions of China using observation data ( Liu et al., 2009; Ma and Fu, 2003), suggesting that water shortages were more severe during 1960-2008 in those areas of scarce water availability.
The spatial changes in runoff were characterized by significant decreasing trends over the southeastern upper reaches and middle reaches. Weak increasing trends appeared over the northwestern upper reaches and lower reaches. Although runoff increased in the lower reaches, its effect was minimal on the total stream flow variations at Lijin station compared with those of the entire Yellow River basin due to a very small drainage area in the lower reaches. A comparison of the spatial patterns of soil moisture, runoff, precipitation, and evapotranspiration suggests that the influence of precipitation on the varia tions in runoff was stronger than those in soil moisture. The biochemical processes associated with local soil texture led to complex and lagged soil moisture responses to precipitation.
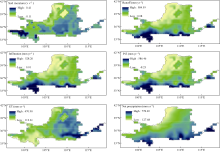 | Figure 1 Spatial patterns of annual mean water availability components averaged for 1970 to 2000. |
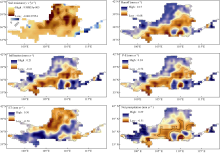 | Figure 2 Spatial patterns of linear trends of water availability components for 1960 to 2008. Dashed lines denote 95% confidence level of the trends. |
On the basis of observational data, atmospheric forcing with high resolution was constructed for the period from 1951 to 2008. Using this forcing data, land surface water availability was simulated with CLM3.5. Comparisons of simulations with in-situ observations suggest that CLM3.5/ObsFC is capable of reproducing the spatial and temporal variations of water availability over the Yellow River basin.
A general downward trend in water availability was observed in this region. The drying trends in soil moisture were more significant in the middle-upper and middle reaches than those in the lower reaches, with accelerated drying trends reported after the late 1990s. The total runoff was reduced due to a decrease in runoff in the main runoff producing areas, particularly in the upper reaches. Compared with soil moisture, the responses of runoff to changes in precipitation and evapotranspiration were rapid and strong. This declining water availability is consistent with the eastward expansion of arid and semi-arid regions. Therefore, the decreases in soil moisture, runoff, and P-E suggest water shortages in the relatively arid regions with increasing severity, which challenges current efforts to protect the fragile ecosystems in these arid and semi-arid regions.
Currently, hydrological simulations are still subject to uncertainty due to limitations in atmospheric forcing and simplified physical process descriptions. In future, we will focus on uncertainty quantification analysis and improvement of hydrological modeling based on multiple forcings and approaches.
This work was supported by the National Basic Research Program of China (973 Program, 2012CB956202), the National Key Technology R&D Program of China (2012BAC22B04), the National Natural Science Foundation of China (41105048), and the Special Fund for Meteorological scientific Research in the Public Interest (GYHY201106028). The authors also thank the anonymous reviewers and the editor-in-chief for their valuable comments and suggestions, which have led to the improvement of this paper.
| 1 |
|
| 2 |
|
| 3 |
|
| 4 |
|
| 5 |
|
| 6 |
|
| 7 |
|
| 8 |
|
| 9 |
|
| 10 |
|
| 11 |
|
| 12 |
|
| 13 |
|
| 14 |
|
| 15 |
|
| 16 |
|
| 17 |
|
| 18 |
|
| 19 |
|
| 20 |
|
| 21 |
|
| 22 |
|
| 23 |
|
| 24 |
|
| 25 |
|
| 26 |
|
| 27 |
|
| 28 |
|
| 29 |
|