

The ice water content (IWC) distribution in a mixed-phase cloud system was investigated using CloudSat data, aircraft measurements, and the Weather Research and Forecasting (WRF) model. Simulated precipitation and IWC were in general agreement with rain gauge, satellite, and aircraft observations. The cloud case was characterized by a predominant cold layer and high IWC throughout the cloud-development and precipitation stages. The CloudSat-retrieved products suggested that the IWC was distributed from 4.0 to 8.0 km, with the maximum values (up to 0.5 g m-3) at 5.0-6.0 km at the earlymature stage of cloud development. High IWC (up to 0.8 g m-3) was also detected by airborne probes at 4.2 and 3.6 km at the late-mature stage. The WRF model simulation revealed that the predominant riming facilitated rapid accumulation of high IWC at 3.0-6.0 km.
Many precipitating cloud systems in northern China are multilayered mixed-phase clouds including cirrus, altostratus, and stratocumulus. For those clouds, ice water content (IWC) is an important parameter for calculating both radiative transfer and precipitation formation. There are two ways to obtain IWC from airborne data: one method is to use in situ measurements based on condensed- and gas-phase water ( Hallar et al., 2004); the other is by calculation from measured ice particle sizes and images ( Mitchell et al., 1990; Heymsfield et al., 2007). In addition, IWC data retrieved from CloudSat measurements has also been evaluated in comparison with aircraft data, and is considered to be in quite good agreement with in situ data ( Barker et al., 2008; Noh et al., 2011).
Although many aircraft observations of stratiform cloud microphysics have been conducted in China, previous studies have generally focused on ice particle growth modes by analyzing only particle habits and concentrations ( Hou et al., 2010), while referring little to IWC. The objective of the present study is to characterize the distribution of IWC in one mixed-phase cloud system at certain times and levels using aircraft and CloudSat measurements. Due to the limitation of observation times, the Weather Research and Forecasting (WRF) model simulation is also conducted to show the vertical profiles of IWC at various precipitation stages.
Two Y-12E aircrafts, from the Shanxi and Beijing Weather Modification Bureaus, equipped with cloud microphysical probes manufactured by Droplet Measurement Technology (DMT) were used to conduct aircraft observations. The Shanxi aircraft was instrumented with a Cloud Droplet Probe (CDP) with a size range of 2-50 μm, a 2D Cloud Imaging Probe (CIP) with a size range of 25-1550 μm, and a Precipitation Imaging Probe (PIP) with a size range of 100-6200 μm. The Beijing aircraft was equipped with a Cloud, Aerosol, and Precipitation Spectrometer (CAPS), including a Cloud and Aerosol Spectrometer (CAS) with a size range of 0.6-50 μm, and with a CIP and PIP with the same size ranges as those in the Shanxi aircraft.
IWC was calculated from the CIP particle size distributions based on the mass-dimensional relationship of Mitchell et al. (1990):
m = 0.022 D2.0 ,
where m (mg) represents the mass of an ice particle, and D (mm) is the maximum dimension with a valid size range of 0.2-7.7 mm, and can be used for rimed and unrimed ice particles with different habits. Korolev and Isaac (2005) suggested considering the effect of particle shattering during analysis of aircraft data, as the number of fragments in the images of shattered particles may reach several hundreds. Therefore, although the minimum detectable size was 25 μm for CIP, only particles in the size range 200-1550 μm were considered valid for IWC calculation. It should be noted that the estimates still have discrepancies of a factor of 2 ( Fleishauer et al., 2002).
As one of the A-Train satellites, CloudSat observes the vertical structure of clouds using 94-GHz Cloud Profiling Radar (CPR). The CloudSat observations have provided unique microphysical products since June 2006 and have been evaluated based on other observations ( Stephens et al., 2008; Protat et al., 2010). In this study, the standard data products 2B-CWC-RO (radar-only combined water content) and the auxiliary data products ECMWF-AUX (auxiliary data built from European Centre for Mediam-range Weather Forecasts) are used.
We used the Advanced Research WRF (ARW, version 3.0) model initialized from the National Centers for Environmental Prediction’s (NCEP) final analysis field at 1° × 1° resolution. The two model domains consisted of an outer domain with 12-km horizontal grid spacing and a two-way nested 4-km grid spacing domain. A complex Morrison microphysics scheme was used in both domains. The outer 74 × 74 grid domain that covers part of eastern China produced a 30-h forecast from 0000 UTC 30 April to 0600 UTC 1 May 2009. The inner 76 × 76 grid 4-km domain started 12 h later, at 1200 UTC 30 April and ended at 0600 UTC 1 May 2009.
The cloud system was in the developing stage from 0000 to 1800 UTC 30 April 2009, with a maximum 18-h cumulative precipitation of only 0.7 mm from rain-gauge measurement. According to aircraft observations from 0930 to 1200 UTC 30 April 2009 (not shown), a very small number of cloud particles was detected until the aircraft ascended to an altitude of 6.0 km, indicating that the cloud-formation process started with the appearance of high-level cirrus. Obvious precipitation was recorded since 1800 UTC 30 April 2009, with the main precipitation region moving from the northwest to the southeast of Zhangjiakou (ZJK)-Chongli (CL).
To illustrate the cloud system development, as well as CloudSat and aircraft observation data, Fig. 1 shows the infrared (IR) images obtained at 1800 UTC 30 April and 0000 UTC 1 May 2009 from satellite FY-2C, part of CloudSat track and flight paths. Figure 1a suggests that there were two precipitating clouds at 1800 UTC 30 April 2009, one primarily to the north of latitude 40°N ("Cloud A") and the other one in the south ("Cloud B"). The red dot, part of Cloud A, represents our target area. Six hours later (Fig. 1b), Cloud A had moved northeastwards, but our target area was still affected by the same cloud system.
CloudSat passed over northern China from 1839:42 to 1842:53 UTC 30 April 2009 with a latitude range from 34.6 to 46.1°N and longitude range from 111.2 to 115.9°E, about 40 minutes later than the image shown in Fig. 1a. Figure 1c shows part of the CloudSat ground track, which was the part that was closest to the flight paths. It was difficult for us to design an aircraft fight path along the CloudSat ground track at close to the same time. Aircraft observations occurred about 7 h later than the CloudSat overpass. The Beijing aircraft (Fig. 1c) flew 4.5 level flight legs between ZJK and CL at 3.6 km from 0130 to 0215 UTC 1 May 2009. The Shanxi aircraft (Fig. 1c) was at an altitude of 4.2 km during that time. By that time, LWC had an extremely low value, only 0.001 g m-3, and ice particle concentration was less than 5 L-1 between 4.8 and 6.0 km. Therefore, the CloudSat overpass took place at the early-mature stage of cloud development, while aircraft observations occurred at the late-mature stage.
Figure 2 presents the cross-section of IWC retrieved from the CloudSat CPR reflectivities. It can be seen in Fig. 2a that there were large amounts of IWC in the cloud system, with the IWC vertical distribution from 4.0 to 8.0 km and the maximum values (up to 0.5 g m-3) at 5.0-6.0 km. The top of the narrow IWC region, at 41.0°N, was up to a height of 8.5 km, indicating existence of convective cells inside the stratiform clouds. In contrast to the significant IWC, no LWC was observed, except at the rather small region around latitude 41.0°N (Fig. 2b). Hence, the cloud system was characterized by predominantly cirrus and altostratus clouds contributed from ice particles at this stage.
Figure 3 presents the variability of IWC and LWC at 4.2 km (-5 to -6°C) and at 3.6 km (-3 to -4°C), and corresponding CIP size bins, during horizontal aircraft traverses on 1 May 2009. The IWC, LWC, and size bins shown in Fig. 3 have been averaged over 10 s to reduce spurious variability due to the small sample volume of the cloud probes ( Fleishauer et al., 2002). It can be seen that IWC (Fig. 3a) generally varied from 0.2 to 0.87 g m-3 during 0130 and 0145 UTC, and declined to relatively low values (0.1-0.4 g m-3) during 0145 and 0205 UTC. These data indicated gradual southeastward movement of the cloud system. In contrast, LWC at 4.2 km was extremely low (mostly< 0.01 g m-3), with a maximum value of only 0.12 g m-3.
Similar to that at 4.2 km, high IWC was detected at 3.6 km (Fig. 3b), with values of 0.3-0.8 g m-3 during 0130 and 0145 UTC, and a gradual decrease to 0.1-0.3 g m-3 later. LWC at this level was slightly higher, but still mostly< 0.05 g m-3. The general decrease of both IWC and LWC from 0130 to 0205 UTC at 3.6 km is in agreement with the weakening of precipitation along the ZJK-CL line.
The size-bin values in Figs. 3c-d are 10-s average particle numbers from sampling volumes; the relative proportion, rather than the numeric concentration, of each bin demonstrates the primary contribution of each bin to IWC. Comparison of CIP size bins with IWC shows that the general decrease of IWC was also shown in a decreasing number of particles in size bins 8 through 14 (200-350 μm). In addition, larger particles (> 350 μm) contributed significantly to peak values of IWC. Overall, both satellite and aircraft data demonstrated high IWC and low LWC values at the early- and late-mature stages.
 | Figure 1 Infrared images at (a) 1800 UTC 30 April and (b) 0000 UTC 1 May 2009 from FY-2C; and (c) CloudSat ground track (black) and aircraft flight paths with the red line indicating the Beijing aircraft and the blue line indicating the Shanxi aircraft. SY = Shangyi, ZJK = Zhangjiakou, CL = Chongli. |
 | Figure 2 Cross section of (a) IWC (g m-3) and (b) LWC (g m-3) from CloudSat retrieval (part of the CloudSat Granule 15995 during 1839:42 and 1842:53 UTC 30 April 2009). Black dotted lines represent ECMWF temperatures in Celsius. IWC = ice water content, LWC = liquid water content, ECMWF = European Centre for Medium-Range Weather Forecasts. |
To better understand the evolution of IWC with time, the rainfall case was simulated using the WRF model. Overall, the WRF model was successful in simulating the major rainfall coverage, with better rainfall coverage at the mature stage than that at the dissipating stage. The hourly cumulative precipitation for stations SY (Shangyi) and ZJK from observations and model simulations is presented in Fig. 4. For station SY (Fig. 4a), precipitation was observed during 1700 and 2200 UTC with the peak value (4.6 mm h-1) occurring at 1900 UTC. In comparison, the modeled rainfall started 1 h earlier than observed rainfall, so was the maximum value. The model results for ZJK (Fig. 4b) were better, as peak values from both observations and model simulation appeared at 2200 UTC. The results suggest that the simulated precipitation was in general agreement with rain gauge measurements, so model results can be used to analyze microphysical processes.
Figure 5 shows the variation of simulated IWC and LWC at selected times for stations SY and ZJK. At 1700 UTC (Fig. 5a), IWC was distributed throughout the cold layer up to 11.2 km, with the maximum value (0.12 g m-3) at 4.8 km. At that time, LWC was< 0.04 g m-3. With cloud development, IWC and LWC maximum values increased to 0.2 and 0.32 g m-3 respectively at 1900 UTC (Fig. 5b). By 2100 UTC (Fig. 5c), IWC increased significantly to 0.43 g m-3 but LWC decreased to< 0.12 g m-3. Ice particles grew mainly through vapor deposition at 5.0-8.0 km during the developing stage, which was the prerequisite for aggregation and riming. With the increase of LWC through vapor condensation and formation of ice particles, riming gradually predominated below 5.0 km and facilitated rapid accumulation of IWC at the mature stage.
Similar variation of IWC can be seen from model results at ZJK (Figs. 5d-f), including a maximum IWC of only 0.16 g m-3 at 1800 UTC and rapid accumulation, from 0.44 g m-3 at 2100 UTC to the maximum of 1.24 g m-3 at 2200 UTC. Compared with aircraft observations, the modeled IWC fell in the range of cloud probe observations. However, the simulated late mature stage should occur at 2300-0000 UTC, which was 2 h earlier than the real clouds observed from aircraft probes. In other words, the simulated clouds dissipated faster than the observed clouds.
CloudSat retrieval of IWC was based on the hypothesis that radar reflectivities arose from ice crystals alone when temperature was< -20°C, from droplets alone when temperature was > 0°C, and from both crystals and droplets for the middle mixed layer. For this case, the top of simulated IWC was below 6.1 km (-20°C) except at the top of one hour at ZJK, which was in general agreement with the CloudSat LWC top assumption. Comparing the simulated IWC shown in Figs. 5a, 5b, and 5d with that retrieved from CloudSat, we can see that the simulated IWC profiles within 4-8 km were in agreement with the magnitude of retrieved IWC.
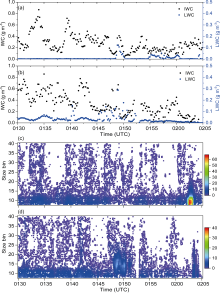 | Figure 3 IWC (black) and LWC (blue) calculated from CIP at (a) 4.2 km from Shanxi aircraft measurement; (b) 3.6 km from Beijing aircraft measurement on 1 May 2009; and corresponding CIP size bins 8-40 (200-1000 μm) at (c) 4.2 km, and (d) 3.6 km. |
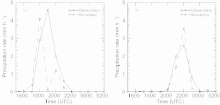 | Figure 4 Precipitation rates during 1500 UTC 30 April and 0200 UTC 1 May 2009 from observations and model simulation at (a) SY and (b) ZJK. |
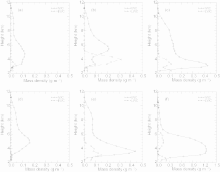 | Figure 5 Variation of simulated IWC and LWC with height, at (a) 1700 UTC, (b) 1900 UTC, and (c) 2100 UTC at station SY, and at (d) 1800 UTC, (e) 2100 UTC, and (f) 2200 UTC at station ZJK. |
The ice water content in a mixed-phase cloud case was studied using CloudSat data, aircraft measurements, and the WRF model. The cloud system, consisting of cirrus, altostratus, and lower stratocumulus clouds at the mature stage, was characterized by a predominant cold layer and high IWC throughout the cloud-development and precipitation stages. The CloudSat-retrieved IWC was in general agreement with model results in terms of the magnitude of maximum IWC values and IWC profiles within 4-8 km at the early-mature stage of cloud development. Aircraft data suggested that high IWC, over 0.8 g m-3, was also detected at 4.2 and 3.6 km at the late-mature stage.
The WRF model was quite successful in capturing the primary precipitation regions as well as peak rainfall rates. The ice particle growth modes first included vapor deposition at 5.0-8.0 km at the developing stage, and later riming below 5.0 km. The riming process facilitated rapid accumulation of high IWC from 3.0 to 6.0 km. Comparison of model rainfall with rain gauge and aircraft measurements suggested that simulated clouds in the WRF model started to dissipate about 1-2 h earlier than actual clouds.
The objective of this study was to investigate the IWC distribution at different cloud development stages by using as much available data as possible. Future work is needed, to analyze errors in observational data and to investigate key parameters affecting aggregation and other microphysical processes.
This work was supported by the National Basic Research Program of China (973 Program, Grant No. 2013CB430105), the Knowledge Innovation Program of the Chinese Academy of Sciences (Grant No. KZCX2-EW-203), and the National Natural Science Foundation of China (Grant No. 41105095).
| 1 |
|
| 2 |
|
| 3 |
|
| 4 |
|
| 5 |
|
| 6 |
|
| 7 |
|
| 8 |
|
| 9 |
|
| 10 |
|