

Characterization of aerosols is required to reduce uncertainties in satellite retrievals of global aerosols and for modeling the effects of these aerosols on climate. Aerosols in the North China Plain (NCP) are complex, which provides a good opportunity to study key aerosol optical properties for various aerosol types. A cluster analysis of key optical properties obtained from Aerosol Robotic Network (AERONET) data in Beijing and Xianghe during 2001–11 was performed to identify dominant aerosol types and their associated optical prop-erties. Five dominant aerosol types were identified. The results show that the urban/industrial aerosol of moderate absorption was dominant in the region and that this type varied little with season. Urban/industrial aerosol of weak absorption was the next most common type and mainly occurs in summer, followed by that strong aerosols occur-ring mainly in winter. All were predominantly fine mode particles. Mineral dust (MD) and polluted dust (PD) oc-curred mainly in spring, followed by winter, and their absorption decreased with wavelength. In addition, aero-sol dynamics and optical parameters such as refractive index and asymmetry factor were examined. Results show that the size of coarse mode particles decreased with AOD indicating the domination of external mixing between aerosols.
Aerosols, which create a substantial amount of uncertainty in climate change (Intergovernmental Panel on Climate Change (IPCC), 2007), affect the global radiation budget indirectly by altering cloud lifetimes and precipitation formation and directly by scattering and absorbing solar radiation ( Twomey, 1977; Albrecht, 1989; Alam et al., 2011). Aerosols are more inhomogeneous and variable than atmospheric gases. In addition, they show distinct physical, chemical, and optical properties that vary dramatically with space and time. Thus, detailed characterizations of aerosols are of utmost importance.
Identification of aerosol types improves accuracy when assessing their impacts on radiation and is thus important for climate modeling ( Diner et al., 1999). Various optical and microphysical parameters have been used for aerosol classification. The spectral dependence of aerosol optical depth (AOD), expressed by the Ångström exponent (AE), is a good indicator of particle size. Gobbi et al. (2007) used this parameter and its spectral curvature to propose a graphical method for evaluating the contribution of fine mode particles to AOD and to track mixtures of pollution containing dust; Schuster et al. (2006) determined that variation in AE wavelength pairs is sensitive to aerosol composition. In addition, the spectral extinction and absorption of aerosols can be approximated with a power law ( Bergstrom et al., 2007). Russell et al. (2010) determined that the absorption Ångström exponent (AAE) was close to 1 for urban/industrial aerosols over the East Coast of the United States, 1.45 for biomass burning, and 2.27-2.34 for dust in the Sahara and Asia. Giles et al. (2012) suggested that a combination of AE and AAE distinguishes aerosols more effectively than that when AAE is used alone. Qin and Mitchell (2009) combined single scattering albedo (SSA) with AOD and the asymmetry factor to identify four episodic aerosol types over the Australian continent. Spectral lidar ratio has also been used in aerosol classification ( Omar et al., 2009). However, few studies have been conducted in the North China Plain (NCP), which is a significant source region of anthropogenic aerosols.
In the NCP, aerosols are complex and variable. Rapid expansion of urbanization and industrialization heighten the amount of anthropogenic aerosols emitted into the atmosphere. Long-range transportation of desert dust from Mongolia and the Gobi in spring delivers abundant coarse particles to the region ( Xia et al., 2007). Coal combustion, emissions by motor vehicles, and the burning of crop stubble contribute to heavy aerosol loading in the NCP. In past decades, most studies on aerosol optical properties of China focused only on specific cases or aerosol type; few studies reported systemic aerosol classification and related differences in optical properties ( Wang et al., 2010; Han et al., 2007; Che et al., 2009a) due to limited available data. As part of Aerosol Characterization Experiment (ACE-Asia), Cimel sun photometers were used for temporal observation of aerosol optical properties in spring 2001 at Beijing and Xianghe, a suburban site approximately 70 km southeast of the city. This equipment has been used for continuous observation since April 2002 at Beijing and September 2004 at Xianghe. Although there is little difference between the two sites due to their similar meteorological field and emission sources, Beijing has heavier pollution and therefore a larger amount of absorbing aerosols. For the present study, long-term data obtained from the Aerosol Robotic Network (AERONET) in urban Beijing and suburban Xianghe during 2001-11 were used to determine aerosol statistics in the NCP. Major aerosol types were identified, and their associated optical properties and seasonal variations are presented in this paper.
A brief description of data and methods used is given in Section 2. Detailed classification of aerosol types and analysis are provided in Section 3, and the summary and conclusions are presented in Section 4.
AERONET is a globally distributed network that provides ground-based remote sensing observation of aerosol optical properties with wavelengths ranging from UV to near infrared. The CE-318 sun photometer is the standard instrument used by the network. Direct solar radiances are measured at eight wavelengths centered at 340, 380, 440, 500, 675, 870, 940, and 1020 nm. The radiance at 940 nm is used for retrieving precipitable water; the remaining seven are generally used for deriving aerosol optical depth. Sky radiances are measured at four wavelengths of 440, 675, 870, and 1020 nm for retrieving aerosol properties such as aerosol size distribution, aerosol absorption, SSA, and asymmetry factor, which are combined with measurements of direct solar radiation ( Holben et al., 1998; Dubovik and King, 2000). Three two-wavelength AEs were derived from AODs at 440 and 675 nm, 675 and 870 nm, 440 and 870 nm. The calculation of AAE was similar to that of AE; however, the aerosol absorption optical depths were at 440 and 870 nm.
Five parameters derived from AERONET data including three two-wavelength AEs, AAE between 440 and 870 nm, and SSA at 675 nm were used in the classification. Each parameter was normalized by scaling the minimum to 0.0 and maximum to 1.0 prior to cluster analysis for ensuring the comparable contribution of each parameter to the distance calculation. The K-means algorithm was used for classification, which is a typical distance-based clustering method that uses the distance between parameters and cluster center as the similarity evaluation criterion among various aerosol types. The ultimate function of the K-means algorithm is to assign the distance within classes as minimum and that between classes as maximum ( Knobelspiesse et al., 2004; Che et al., 2011).
Five types were classified on the basis of several trials and include urban/industrial aerosol with weak absorption (UIWA), urban/industrial aerosol with moderate absorption (UIMA), urban/industrial aerosol with strong absorption (UISA), mineral dust (MD), and polluted dust (PD). To simplify comparison, we further classified these types into two categories: fine mode dominated aerosols (FMDAs), which include UIWA, UIMA, and UISA, and coarse mode dominated aerosols (CMDAs), which include MD and PD.
Table 1 shows the frequency of occurrence (FO) and the values of cluster parameters for each aerosol type detected in the NCP. Due to the variation of solar zenith angle, the number of available records differs significantly. Therefore, we used the normalized FO calculated as, where i is the aerosol type, jis the month number, fij is the occurrence frequency of aerosol type i in month j, and FO i is the occurrence frequency in the NCP.
The three FMDA types identified by cluster analysis include UIWA, UIMA, and UISA. In the NCP, the major aerosol types are dominated by fine mode particles in which the AE is larger than 1.0 and the volume ratio between fine and coarse mode particles is larger than 0.7. Of the FMDAs, UIMA was the most frequently occurring type, with an FO of ~45.32%, and UISA was the most uncommon type, with an FO of ~14.80%. Although the FO of UIMA varied little with season, the value of UIWA was highest in summer; that of UISA was highest in winter.
As shown in Table 1, the mean AAE varied from 1.57 for UIWA to 1.28 for UISA. Such values are comparable to those determined by in situ measurement at Xianghe ( Yang et al., 2009). As previously mentioned, the magnitude of AAE is an effective parameter for distinguishing aerosol type. In general, the theoretical value of AAE is 1.0 for black carbon. The value for biomass burning is larger, and that for dust is largest ( Clarke et al., 2007; Russell et al., 2010). Russell et al., 2010 analyzed measurements obtained by aircraft during the Megacity Initiative: Local and Global Research Observations (MILAGRO) project in Mexico City in 2006 and determined that the AAE was close to 1.0 in the absence of dust and organic aerosols. Moreover, they reported that the value increased with an increase in the organic fraction of non- refractory aerosol masses, including all organic species and most inorganic salts, when dust was absent. In the NCP, the AAE increased with absorption, which is likely attributed to variation in absorbing organic carbon (OC) or fine reported in the NCP ( Arola et al., 2011; Yang et al., 2009; Han et al., 2007).
To obtain a better understanding of the differences in optical properties and dynamics of FMDAs, we selected records with the same AOD at 440 nm (0.7), as suggested by Dubovik et al. (2002), to analyze the characteristics of each aerosol type (Fig. 1).
As shown in Fig. 1a, SSA among FMDAs varied significantly, particularly at blue and infrared spectral regions. Such high variability in SSA is likely attributed to differences in meteorology and aerosol composition ( Che et al., 2009b). The NCP has four distinct seasons. In the dry and windy spring, winds from north and northeast deposit large amounts of dust particles. The summer is rainy and humid, autumn is dominated by anticyclones which atmosphere is more stable, and winter is cold, dry, and windy. UIWA occurs mainly in summer whereby high relative humidity contributes to the hygroscopic growth of water-soluble particles and results in a higher SSA. High concentrations of water-soluble particles have been observed in summer in Beijing ( Sun et al., 2012). Heating in winter in the NCP produces a large amount of carbonaceous aerosols, which results in strong absorption of aerosols. Duan et al. (2005) analyzed carbonaceous aerosols in Beijing and determined that in the heating season, the concentration of elemental carbon (EC) was nearly twice that observed during the non-heating season. In addition, Yang et al. (2011) reported clear seasonal variations in carbonaceous aerosols at Beijing such that the concentration was high in winter and significantly lower in summer and spring. The weakest absorption oc mode mineral particles. High concentrations of organics the size distribution of FMDAs at the same AOD level (AOD440~ 0.7) is shown in Fig. 1b. For the same extinction, UIWA showed the largest size of fine mode particles (the effective radius of fine mode particles, rf~ 0.20 µm) but at a lower concentration (the volume concentration of fine mode particles, Vf ~ 0.091 µm3 µm-2), while UISA showed the smallest size of fine mode particles (rf ~ 0.16 µm) but at a moderate volume concentration (Vf~ 0.087 µm3 µm-2). A comparison of urban/industrial aerosols of the same AOD level presented by Dubovik et al. (2002) in which the AE was larger than 1.5 revealed that the AE of FMDAs in the NCP is smaller than 1.25, which indicates a higher concentration of coarse particle emissions in North China. Correspondingly, the volume ratio between fine and coarse modes was smaller than 1.0, while that of Dubovik et al. (2002) was as high as 3 for aerosols measured at Goddard Space Flight Center (GSFC) near Washington, D. C., and 2.5 for those recorded in Creteil near Paris with comparable volume concentrations of fine mode particles but higher concentrations of coarse mode particles. By using in situ aircraft measurements obtained near South Korea and Japan during ACE-Asia, Anderson et al. (2003) observed that pollution aerosols were always accompanied by a significant concentration of coarse mode particles, suggesting a co-emission of fine mode and dust particles.
Parameters regressed by aerosol optical depth can be used to outline the dynamics of aerosol optical properties associated with the growth of aerosol size and aerosol processes stimulated by an increase in atmospheric aerosol loading ( Dubovik et al., 2002). A method similar to the dynamic model reported by Dubovik et al. (2002) used in the present study is shown in Table 2. Compared with urban/industrial aerosols shown by Dubovik et al. (2002), the increase in fine mode size with AOD was not remarkable in the NCP. This discrepancy is likely attributed to the larger aerosol loading and larger particle size in the NCP. Dubovik et al. (2002) reported that the AOD range of urban/industrial aerosols was small (AOD440<1.0) at GSFC, Crete, and Maldives and higher at Mexico City (AOD440<1.8). In the NCP, however, approximately 44.61% of FMDA samples were larger than 1.0. Therefore, the sizes of fine mode particles were also larger than those recorded at the other sites. Among FMDAs, the initial size of UIWA was largest, which may be attributed to hygroscopic growth and a high rate of gas-to-particles conversion. It is interesting to note that the sizes of coarse mode particles of FMDAs decreased with increasing AOD, particularly for UISA. This result may be attributed to external mixing of fine and coarse mode particles.
Refractive index is a measure of aerosol refraction and absorption efficiency. In the NCP, the real part of the refractive index ( n( λ)) was not sensitive to spectral variation; however, the imaginary part ( k( λ)) showed a higher value at 440 nm than those at longer wavelengths. For FMDAs, a high SSA correlated with a lower n( λ), and strong absorption correlated with a higher k( λ). Dubovik et al. (2002) attributed the lower n( λ) to hygroscopic growth resulting from high relative humidity and higher k( λ) to the high concentration of black carbon. Together with size distribution, k( λ) determines the magnitude of SSA. The k( λ) of FMDAs increased with absorption from 0.0084 for UIWA to 0.0250 for UISA at 440 nm, which is comparable to the 0.0225 value for Beijing (SSA ~ 0.84) obtained from the ground-based broadband diffuse solar radiation retrieval presented by Qiu et al. (2004). The k value was larger than the values presented by Dubovik et al. (2002) for urban/industrial aerosols.
| Table 1 Frequency of occurrence (FO) and cluster parameters of each aerosol type. |
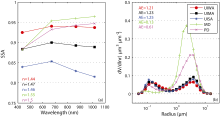 | Figure 1 Averaged optical properties of various aerosol types recorded in the North China Plain (NCP) (SSA and n were shown in (a); the volume size distribution and Ångström exponent (AE) were shown in (b)). Aerosols are shown for aerosol optical depth of AOD440 = 0.7. The AE was estimated by using an optical thickness of 440-870 nm. |
The two CMDAs identified in the NCP include MD and PD. The FO of CMDAs was smaller at 10.04% than that of FMDA and occurred mainly in spring and winter.
As shown in Table 1, the particle size of CMDAs was larger (AE440-870<1.0). Strong absorption of dust particles in the blue spectral region resulted in higher absorption spectral dependence. The AAE of MD was 2.16, and that of PD was 1.74, which is consistent with results published in previous studies. Russell et al. (2010) recalculated the AAE of dust-dominated cities presented by Dubovik et al. (2002) and determined that the AAE was > 2.0 in Bahrain, > 1.5 in Solar Village, and > 2.5 in Cape Verde. In situ measurement obtained during ACE-Asia also showed that aerosols dominated by MD reached 2.27 for mixed dust and pollution in Asia ( Russell et al., 2010).
As shown in Fig. 1a, the domination of larger particles and strong absorption at the blue spectral region resulted in a more obvious spectral dependence of SSA for CMDAs. The SSA of CMDAs increased with wavelength. At the same aerosol loading level (AOD440=0.7), the SSA was 0.88 and 0.89 at 440 nm and 0.94 and 0.96 at 1020 nm for MD and PD, respectively.
Although the typical refractive index for dust is 1.53- 0.005 i( Dey et al., 2004), this value differs significantly among previous studies. Wu et al. (2009) analyzed the dust events in Beijing by ground-based in situ measurement and suggested a refractive index of 1.58-0.005 i. Woodward (2001) assumed that actual value of dust at 550 nm is constant at 1.53 and that the simulated value varies between 0.0003 and 0.0052. For CMDAs, in agreement with the high scattering efficiency at corresponding wavelengths, the n( λ) of CMDAs was higher than that of FMDAs, and the n for MD and PD was 1.55 and 1.53, respectively. These results are consistent with available dust measurements such as those of 1.48-1.56 retrieved from AERONET dust sites and presented by Dubovik et al. (2002). In contrast with stronger absorbing FMDAs, simulated values were lower with k440 ~0.005 and ~0.0074 for MD and PD, respectively. The spectral dependence for k was more noticeable than that of n at corresponding wavelengths, particularly at 440 and 675 nm. As shown in Table 2, the k at 440 nm was nearly two to three times that of longer wavelengths.
| Table 2 Summary of aerosol optical properties of all aerosol types recorded in the North China Plain (NCP). |
In this study, the AE derived from AOD at three wavelength pairs of 440-675 nm, 675-870 nm, and 440-870 nm; the AAE derived from absorption AOD at wavelength a pair of 440-870 nm; and an SSA at 675 nm retrieved from AERONET data were used in cluster analysis to identify the dominant aerosol types and associated optical properties in the NCP. Five urban/industrial aerosol types were classified including three FMDAs such as UIWA, UIMA, and UISA, and two CMDAs such as MD and PD.
FMDA was the dominant aerosol type in the NCP. UIWA and UISA showed significant seasonal variation. UIWA, occurring mainly in summer, was characterized by larger fine mode radius and weak absorption; UISA, occurring mainly in winter, was dominated by absorbing aerosols. The AAE of FMDAs was small and ranged from 1.57 to 1.28, decreasing with absorption. Contrary to urban/industrial aerosol characteristics reported in previous research, the spectral dependence of SSA was not monotonic at the NCP and showed a high value at the middle visible spectral region. This result may be attributed to the contribution of absorption by organic carbon. For urban/industrial aerosols, k ranged from 0.006 to 0.0191, and n ranged from 1.47 to 1.51.
MD and PD were concentrated in spring and winter with larger particles and high absorption spectral dependence. The AAE of dust was as high as 2.16, and that of PD reach a maximum of 1.74. Contrary to that observed in FMDAs, absorption decreased with an increase in wavelength. With the exception of SSA, the spectral dependence of optical properties was not significant. The refractive index of MD was ~ 1.55-0.0026 i, and that of PD was ~ 1.53-0.0043 i.
High emission of anthropogenic aerosols in the NCP resulted in strong absorption of particles. The high coarse mode concentration resulted in larger particles. Contrary to that observed at other sites, the sizes of coarse mode particles decreased with aerosol optical depth. This result may be attributed to the external mixing of aerosols.
This work was supported by the National Basic Research Program of China (2013CB955801) and the National Natural Science Foundation of China (41175031), the "Strategic Priority Research Program" of the Chinese Academy of Sciences (XDA05100300).
| 1 |
|
| 2 |
|
| 3 |
|
| 4 |
|
| 5 |
|
| 6 |
|
| 7 |
|
| 8 |
|
| 9 |
|
| 10 |
|
| 11 |
|
| 12 |
|
| 13 |
|
| 14 |
|
| 15 |
|
| 16 |
|
| 17 |
|
| 18 |
|
| 19 |
|
| 20 |
|
| 21 |
|
| 22 |
|
| 23 |
|
| 24 |
|
| 25 |
|
| 26 |
|
| 27 |
|
| 28 |
|
| 29 |
|
| 30 |
|
| 31 |
|
| 32 |
|
| 33 |
|