

The different spatial distributions of aerosol-induced direct radiative forcing and climatic effects in a weak (2003) and a strong (2006) East Asian summer monsoon (EASM) circulation were simulated using a high-resolution regional climate model (RegCM3). Results showed that the atmospheric circulations of summer monsoon have direct relations with transport of aerosols and their climatic effects. Both the top-of-the-atmosphere (TOA) and the surface-negative radiative forcing of aerosols were stronger in weak EASM circulations. The main difference in aerosol-induced negative forcing in two summers varied between 2 and 14 W m-2 from the Sichuan Basin to North China, where a maximum in aerosol-induced negative forcing was also noticed in the EASM-dominated areas. The spatial difference in the simulated aerosol optical depth (AOD) in two summers generally showed the similar pictures. Surface cooling effects induced by aerosols were spatially more uniform in weak EASM circulations and cooler by about 1-4.5° C. A preliminary analysis here indicated that a weaker low-level wind speed not conducive to the transport and diffusion of aerosols could make more contributions to the differences in the two circulations.
Direct and indirect radiative forcing of atmospheric aerosols can affect the earth’ s radiation budget. Aerosols play a non-negligible role in climate change, but major uncertainties are associated with the assessment of their impact on climate (Intergovernmental Panel on Climate Change(IPCC), 2007). The climatic impacts of aerosols have drawn more attention in the recent decade (Ramanathan et al., 2001; Menon et al., 2002).
In the past decades, East Asia has been experiencing rapid population growth, and industrial and economic development, which have increased emission of aerosol precursors produced by fossil fuel combustion and biomass burning; this situation is likely to continue in the future. East Asian summer monsoon (EASM) is an important circulation system; consequently, the complex relationship between the EASM and aerosols is becoming a focus topic in the research on the impacts of aerosols on regional climate (Zhang et al., 2010; Zhu et al., 2012).
In previous studies, the relationship between the monsoon and aerosols was discussed using some global climate models (GCMs) (e.g., Lau et al., 2006). However, because of highly localized nature of emissions and relatively short lifetime of aerosols, aerosol forcing possibly contributes significantly to the climate at a regional scale (Menon et al., 2002). Therefore, it was expected that using a high-resolution regional climate model would help understand the mechanism of these interactions better.
Early attempts of investigating the radiative effects of aerosols using a regional climate model (RCM) were made byQian and Giorgi (1999). After that, more extensive simulations on radiative forcing and climate effects of aerosols were performed using RCMs (Giorgi et al., 2002; Qian et al., 2003; Wu et al., 2004; Han, 2010; Ji et al., 2011; Ju and Han, 2011; Nair et al., 2012) in different regions of the world.
Two simulations were conducted to discuss the differences in climatic impacts of aerosols based on the strength of EASM (Li and Zeng, 2002), one for the year 2003 when a weak EASM circulation dominated over East Asia, and one for 2006 when there was a strong EASM circulation. The regional climate model (RegCM3) (Pal et al., 2007) coupled with an aerosol module was used here. In section 2, we describe the model and its experimental design. The results of our simulations are analyzed in section 3. Section 4 presents the main conclusions.
The model employed in this research was the Regional Climate Model version 3 (RegCM3) developed at the Abdus Salam International Centre for Theoretical Physics (ICTP) (Pal et al., 2007). Radiative transfer processes were computed from the Community Climate Model (CCM3) from the National Center for Atmospheric Research (NCAR) package (Kiehl et al., 1996). Land surface processes were described by the Biosphere-Atmosphere Transfer Scheme (BATS; Dickinson et al., 1993). The nonlocal planetary boundary layer scheme byHoltslag et al. (1990) was used to depict boundary layer processes. The Grell cumulus parameterization scheme (Grell, 1993) was used for describing convective precipitation and the subgrid explicit moisture scheme (SUBEX) for nonconvective precipitation. An important aspect of our work was that a desert dust module (Zakey et al., 2006) and simplified anthropogenic aerosol modules (Solmon et al., 2006) were implemented within the RegCM3. In the two modules, scattering and absorption of solar and infrared radiations by aerosols were parameterized along with optical properties of aerosols; transport, diffusion, dry deposition, and wet removal processes of aerosols were also taken into consideration. Aerosol module of the RegCM3 included sulfate, black carbon (BC; hydrophilic and hydrophobic), organic carbon (OC; hydrophilic and hydrophobic), and dust (Qian and Giorgi, 1999; Solmon et al., 2006; Zakey et al., 2006). The RegCM3 was used to simulate effects of aerosols on regional climate in different areas across the world (e.g.,Zhang et al., 2009; Ji et al., 2011; Ju and Han, 2011; Nair et al., 2012; Zanis et al., 2012).
The simulation domain covered East Asia with 144× 90 grid points, with the center being at 33° N, 105° E. A 60-km horizontal resolution and 18 nonuniform vertical layers were prescribed. The RegCM3 was driven by initial and 6-hr updating lateral boundary conditions from the National Centers for Environmental Prediction (NCAR/NCEP) reanalysis data (Kalnay et al., 1996).
In this study, dust emission was calculated online in RegCM3 using the soil texture dataset. The anthropogenic emission inventory of SO2, BC, and OC was obtained from the David Streets’ 2006 emission inventory (http://www.cgrer.uiowa.edu/EMISSION_DATA_new/data/intex-b_emissions/) over the area of 0-53.5° N, 60-157.5° E and from the Emission Database for Global Atmospheric Research (EDGAR) database for the year 2000 (Solmon et al., 2006) covering other areas. Monthly mean data of biomass burning emissions were taken from the study results ofLiousse et al. (1996). The chemical conversion of SO2 to SO42- follows two oxidation pathways: one in the gas phase and the other in the aqueous phase.
Two continuous integrations were carried out with RegCM3: one from November 2002 to December 2003 and the other from November 2005 to December 2006. In case of both the simulations, the first month was considered as spin-up. In this article, only the situations occurring in summer (June-July-August, JJA) were analyzed.
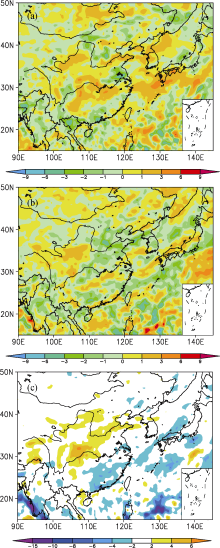
Figure 1 shows the simulated clear-sky direct aerosols radiative forcing in two summers and their differences at the top of the atmosphere (TOA). The aerosols (dust, sulfate, BC, and OC) were assumed to mix externally, producing negative forcing at the TOA over most areas of East Asia, except for a small area in the north fringe of the Tibetan Plateau where positive effect was observed. Two dominant negative centers, one covering Northwest China and one spreading from Southwest China to the northeast of East Asia, were observed during the study period. The northwest dominant center (not entirely shown in this figure) was mainly induced by dust and it’ s out of the domain controlled by the EASM. This article focused only on the other key negative EASM-dominated areas in East Asia where the main sources of aerosols were human activities. In our study, we found that aerosols could induce stronger negative radiative forcing in the relatively weak EASM circulations in 2003 from Southwest China to Northeast East Asia, especially over the Sichuan Basin and North China, than in the relatively strong circulations in 2006. In the Sichuan Basin, the largest negative forcing was up to -30 W m-2 in 2003, but only -12 to -15 W m-2 in 2006. In North China, the negative forcing in 2003 was generally stronger by 3-6 W m-2 than that in 2006.
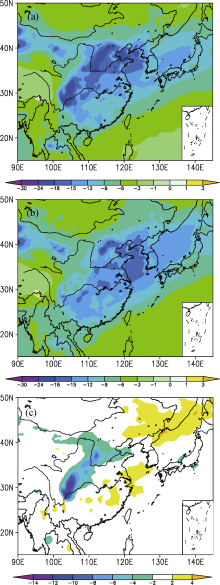 | Figure 1 Simulated aerosol-induced radiative forcing at the TOA in summer (JJA) for (a) 2003, (b) 2006, and (c) their difference (former minus latter) (units: W m-2). |
At the surface (figure not shown), aerosols induced negative forcing around the whole research areas. Spatial distributions of the radiative forcing at the surface were similar to those at the TOA both in 2003 and 2006, but the negative forcing effects at the surface were stronger. In the EASM-dominated areas, the maximum negative forcing could exceed -40 W m-2. In the Sichuan Basin, the difference in aerosol-induced surface forcing between the two summers could reach 15 W m-2. In North China, negative radiative forcing was also stronger in 2003.
Figure 2 shows the simulated aerosol optical depth (AOD) at 350-640 nm. The simulated AOD by RegCM3 was in the same range as that of satellite data retrieved using instruments such as the Moderate Resolution Imaging Spectroradiometer (MODIS) and the Multiangle Imaging Spectroradiometer (MISR) (figures not shown). Like aerosols direct radiative forcing, spatial distributions of AOD also exhibited local differences. The simulated AOD was in the range of 0.2-1.5 in both summers. The main difference between the two summers was that a center with higher-magnitude AODs (a maximum of up to 1.5) occurred in 2003 in the Sichuan Basin, but no center occurred in 2006. In North China, AODs with larger values generated over a wider area and their magnitudes were larger by about 0.2-0.4 in 2003 than those in 2006.
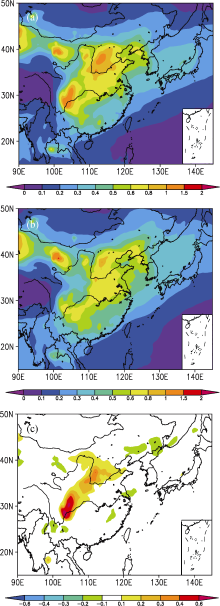 | Figure 2 Simulated aerosol-induced AOD in JJA for (a) 2003, (b) 2006, and (c) their difference (former minus latter). |
Because the emission inventory of aerosols used in the two simulations was the same, the differences in radiative forcing in the EASM-dominated areas in the two summers were related to the monsoon circulations. From the difference of wind velocity at a height of 10 m (Fig. 3), we could realize preliminarily that the transport and diffusion of aerosols by wind played a key role in that difference of radiative forcing. Compared with 2003, the wind velocity from the Sichuan Basin to the middle and lower reaches of the Yellow River were stronger by 0.5-2 m s-1 in 2006, which were conducive to the downward transport of the aerosols by the southwest wind guided by EASM. Increased transport of aerosols led to a decrease in their concentrations in the source areas and further to the weakening of the aerosol-induced radiative forcing.
Figure 4 shows aerosol-induced changes in surface temperatures, as simulated by the model. In general, the dimming effects of aerosols cooled the surface, but the spatial distributions of the changes in surface temperature were nonuniform. In 2003, surface temperature decreased by 0-1.5° C in most parts of the EASM-dominated areas, and a small increase of 0-0.5° C occurred around the southeast coast areas and the southern part of Shandong Peninsula. The maximum cooling dominated the middle reaches of the Yellow River, just west to the negative center of the radiative forcing in North China. Compared with 2003, the pattern of surface temperature change was complex in 2006. The cooling effects extended from the Sichuan Basin to the middle reaches of the Yellow River, and the maximum magnitude of cooling reached up to -1.5° C. However, there were two areas that warmed by up to 1.5° C: One was located northeast of the Sichuan Basin along the Yangtze River and the other in the lower reaches of the Yellow River. In certain areas, changes in temperature resulted from combined effects of aerosol radiative forcing and other important factors, such as water vapor or cloud change. Aerosol forcing may induce changes in the atmospheric structure, consequently affecting circulation, transport of water vapor, and cloud distribution, which in turn affect incident solar flux and surface temperature. We found that, during strong EASM (2006), the cloud cover (figure not shown) in the above areas decreased due to changes in the circulation, resulting in more solar radiation reaching the surface and an increase in temperature, whereas during weak EASM (2003), changes in the cloud cover were little and hence the temperature was controlled by aerosols’ radiative cooling effect. Therefore, changes in temperature were governed by a complex interplay among radiation, circulation, and cloud.
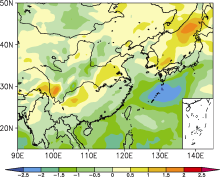 | Figure 3 Difference of wind velocity at a height of 10 m between summers of 2003 and 2006 (former minus latter) (units: m s-1). |
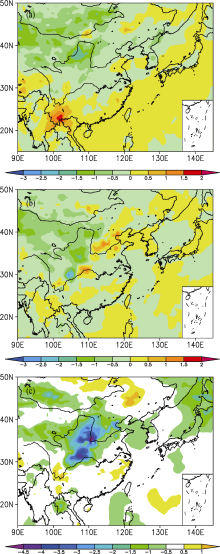 | Figure 4 Simulated aerosol-induced change of surface temperature in JJA for (a) 2003, (b) 2006, and (c) their difference (former minus latter) (units: ° C). |
Compared with the impacts of aerosols on surface temperature, aerosol-induced changes in precipitation were found to be more complicated and uncertain (Fig. 5). In general, spatial distributions of aerosol-induced pre-cipitation change were very different in the two summers.
 | Figure 5 Simulated aerosol-induced change of precipitation in JJA for (a) 2003, (b) 2006, and (c) their difference (former minus latter) (units: mm d-1). |
In the Sichuan Basin, middle reaches of Yangtze River, and lower reaches of Yellow River, the signs of precipitation were nearly opposite in these two periods, leading to a 2-6 mm d-1 increase in precipitation in 2003 than in 2006 over these regions. On the other hand, precipitation decreased by about 2-4 mm d-1 in the southeast regions of China in 2003, compared to that in 2006. We also noticed an interesting phenomenon in 2003 that spatial distributions of the surface cooling along the middle and lower reaches of the Yangtze River were nearly consistent with the increase in precipitation. A possible explanation might be that the dimming effect of aerosols caused land surface cooling, which reduced the temperature difference between the land and the ocean, further weakening the EASM and increasing precipitation along the Yangtze River (Zhang et al., 2003).
Using of a regional climate model that included chemistry/aerosol modules, we simulated the difference in climatic effects of aerosols in weak (2003) and strong (2006) EASM circulations. In East Asia, model results showed that aerosols induced stronger negative direct radiative forcing in weak EASM circulations. The differences of radiative forcing were prominent in the Sichuan Basin and North China, two main sources of aerosols in the EASM-dominated areas. At the TOA, the negative forcing in 2003 was generally stronger by 12-15 W m-2 than that in 2006 in the Sichuan Basin and by 3-6 W m-2 in North China. The aerosol-induced surface negative forcing in the Sichuan Basin was stronger roughly by 15 W m-2 in weak monsoon circulations.
In general, the dimming effects of aerosols cooled the surface. The trend of surface cooling was more uniform in weak EASM circulations. In strong monsoon circulations, spatial distributions of aerosol-induced changes in surface temperature were complicated. The changes in aerosol-induced precipitations were significantly different in the two summers and were even of opposite signs in some regions.
In this article, we compared only the differences in aerosol-induced radiative forcing and climatic changes in two individual strong and weak EASM circulations. Although some valuable conclusions can be drawn about the impacts of the EASM circulations on the aerosol-induced climatic effects on the basis of the findings of this study, it is necessary to include more examples to better understand the mechanism in the future.
| 1 |
|
| 2 |
|
| 3 |
|
| 4 |
|
| 5 |
|
| 6 |
|
| 7 |
|
| 8 |
|
| 9 |
|
| 10 |
|
| 11 |
|
| 12 |
|
| 13 |
|
| 14 |
|
| 15 |
|
| 16 |
|
| 17 |
|
| 18 |
|
| 19 |
|
| 20 |
|
| 21 |
|
| 22 |
|
| 23 |
|
| 24 |
|
| 25 |
|
| 26 |
|
| 27 |
|