

A comparison of sensitivity in extratropical circulation in the Northern Hemisphere (NH) and Southern Hemisphere (SH) is conducted through observational analyses and diagnostic linear model experiments for two types of El Niño events, the traditional El Niño with the strongest warmth in the eastern tropical Pacific (EP El Niño) and the El Niño Modoki with the strongest warmth in the central tropical Pacific (CP El Niño). It is shown that CP El Niño favors the occurrence of a negative-phase Northern Annular Mode (NAM), while EP El Niño favors that of the Pacific-North American (PNA) pattern. In SH, both EP and CP El Niño induce a negative phase Southern Annular Mode (SAM). However, the former has a greater amplitude, which is consistent with the stronger sea surface temperature (SST) warmth. The difference in the two types of El Niño events in NH may originate from the dependence of heating-induced extratropical response on the location of initial heating, which may be associated with activity of the stationary wave. In SH, the lack of sensitivity to the location of heating can be associated with weaker activity of the stationary wave therein.
Extratropical atmospheric circulation plays an important role in the formation of anomalous weather and climate. Due to strong internal variability and chaotic features in the extratropical atmosphere, determination of the predictive signals from the lower boundary, particularly that of the tropical ocean, has been a crucial research project for the climate prediction community. From this perspective, El Niño events have gathered special attention.
Numerous previous studies have noted El Niño’ s substantial effect on the extratropical atmosphere, among which two types of anomalous circulation patterns, the Pacific-North America (PNA) and the Northern Annular mode (NAM) were reported in addition to its regional manifestation, North Atlantic Oscillation (NAO; Thompson and Wallace, 1998; Trenberth et al., 1998; Palmer and Anderson, 1994; Pozo-Vasquez et al., 2001, 2005; Cassou and Terray, 2001; Li and Lau, 2012). Such coexistence of the two different circulation types has also been observed among El Niño-Southern Oscillation (ENSO) events (e.g., Mathieu et al., 2004) and decades (e.g., Sutton and Hodson, 2003) and may originate from the sensitivity of thermodynamic-driven linear atmospheric responses to the location of tropical heating and amplification of this response due to transient eddy involvement (e.g., Li et al., 2006; Shin and Sardeshmukh, 2010; Li and Lau, 2012). Such sensitivity occurs because the east tropical Pacific sea surface temperature anomalies (SSTAs) induce a PNA response, while western Pacific SSTAs induce an NAM/NAO pattern (Li et al., 2006). The inseparability of the two effects may be related to the difficulty in isolating the effect of the tropical east Pacific from that of the tropical west Pacific for both observational analyses and experiments similar to the Atmospheric Model Intercomparison Project (AMIP) because sea surface temperatures (SSTs) in the eastern and western basin are oppositely correlated on an interannual timescale (Rasmusson and Carpenter, 1982).
Traditional El Niño events feature maximum SST warmth in the eastern tropical Pacific. However, an additional type of El Niño event exhibits maximum SST warmth in the central near-equatorial Pacific Ocean and has occurred more frequently during recent decades. The latter, known as the central Pacific El Niño (CP El Niño) (Fu et al., 1986) or El Niño Modoki (Ashok et al., 2009), exerts different impacts on the climate in many regions (Larkin and Harrison, 2005; Ashok et al., 2007; Chang et al., 2008; Weng et al., 2007; Yeh et al., 2009; Kim et al., 2009; Hendon et al., 2009; Lee and McPhaden, 2010; Feng et al., 2010, 2011; Feng and Li, 2011). However, it remains unclear whether the influence on extratropical circulation exerted by the CP El Niño differs from that by the eastern Pacific El Niño (EP El Niño). The aforementioned sensitivity of extratropical circulation to the location of tropical heating implies such a possibility. Such a consideration has motivated the present study, which compares the sensitivity of the extratropical atmosphere to the two types of El Niño phenomena through observational composite analyses and diagnostic dynamical linear baroclinic model (LBM) experiments.
Monthly SST datasets with a resolution of 2° × 2° for 1860-2010 were obtained from the Extended Reconstruction SST version 3 (ERSST v3) provided by the National Oceanic and Atmospheric Administration (NOAA; Smith et al., 2008). The atmospheric circulation data were obtained from the National Centers for Environment Prediction/National Center for Atmospheric Research (NCEP/ NCAR) reanalysis (Kalnay et al., 1996). Monthly precipitation dataset used was obtained from NOAA Climate Prediction Center (CPC) Merged Analysis of Precipitation (CMAP) (Xie and Arkin, 1997). Monthly anomalies were calculated by removing the long-term climatological seasonal cycle from the original monthly mean. The climatological norm is referred to as the mean during the 30-year period of 1971-2000. A de-trending process was performed prior to all observational analyses.
The classification approach for the two types of El Niño was based on the Niño 3 or Niño 4 index (Kug et al., 2009; Kim et al., 2009; Yeh et al., 2009). An EP El Niño was defined under conditions such that (1) the three-month running mean SSTA over the Niño 3 region was greater than 0.5° C and persisted for five months, and (2) the seasonal mean of normalized Niño 3 index was greater than that of the normalized Niño 4 index during the mature phase (September-October-November-December-January-February; SOND(0)JF(1)). As such, a total of 10 EP El Niño events were obtained for 1950-2010 and include 1951-52, 1957-58, 1963-64, 1965-66, 1969-70, 1972-73, 1976-77, 1982-83, 1991-92, and 1997-98. As reported by Kug et al. (2009), the case of 1986-88 was excluded from the canonical events because the maximum SST anomalies were located between 120° W and 150° W. For the CP El Niño events, (1) the three-month running mean of Niño 4 and the SSTA index was greater than 0.5° C and persisted for five months, and (2) the seasonal mean of normalized Niño 4 index was greater than that of the normalized Niño 3 during the mature phase (SOND(0)JF(1)). As such, a total of seven CP El Niño events were identified to include 1968-69, 1977-78, 1990-91, 1994-95, 2002-03, 2004-05, and 2009-10. The composite SSTA shown in Fig. 1 clearly indicates that the strongest warmth for the EP El Niño occurs in the eastern Pacific with the maximum SSTA near 120° W (Fig. 1a), while that for the CP El Niño occurs at the dateline near 170° W (Fig. 1b).
To understand the initial sensitivity of the extratropical atmospheric sensitivity to tropical heating, an LBM was used to conduct sensitive experiments. The LBM was the same as that reported by Peng and Whitaker (1999), which is a time-dependent spectral model with a horizontal resolution of T21 and 10 equally spaced pressure levels. No topography was prescribed. The linearization was close to a three-dimensional time-mean flow calculated as the winter mean (December-January-February; DJF) in the observations. Various experiments were performed with idealized heating that shifted from the tropical central to eastern Pacific, which corresponded to the two types of El Niño cases, respectively.
In the Northern Hemisphere (NH), homogeneously positive anomalies over the tropics along with a PNA pattern were common for the two events at 500-hPa geopotential heights (Figs. 2a and 2b). Despite this similarity, substantial differences were observed in other locations, particularly in the eastern North Atlantic. For EP El Niño events (Fig. 2a), negative anomalies were generally contained within mid-latitudinal North Pacific and North America. For CP El Niño events (Fig. 2b), significant negative anomalies were observed to encircle the NH mid-latitudes, which are opposite to the positive anomalies occurring over the northern polar region. These anomalies project onto a negative-phase NAM and suggest a distinction of extratropical atmospheric connection to the two types of El Niño events.
Further differences were observed in the projection of 500-hPa height anomalies in the individual events onto the NAM. As reported by Li et al. (2006), the NAM was represented by the leading empirical orthogonal function (EOF) of wintertime monthly 500-hPa geopotential heights in the NH (Fig. 3a), which explains ~ 21% of the total variance. The projection coefficient of 500-hPa heights onto the leading EOF is thus referred to as the NAM index. The estimated probability distribution function (PDF) of NAM indices of the monthly 500-hPa height anomalies constructed for all the EP/CP El Niño events (Fig. 3b) indicates that EP El Niño exhibits a typical normal distribution structure. In contrast, the CP El Niño exhibited a shift toward positive index values that corresponds to the negative-phase NAM. A statistical check based on the Kolmogorov-Smirnov test (Stephens, 1970) suggests that the PDF difference is at the 99% confidence level. Thus, the different sensitivity of NAM was robust for the two types of El Niño events observed.
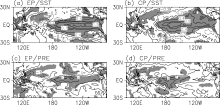 | Figure 1 Comparison of observational anomaly composites during eastern Pacific El Niño events (EP) (left column) with those during central Pacific El Niño events (CP) (right column). (a, b) reflect sea surface temperature anomalies (SSTAs) (° C), and (c, d) indicate rainfall (mm d-1). |
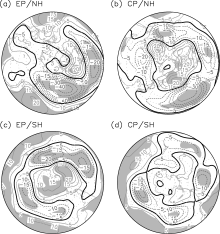 | Figure 2 Comparison of observational anomaly composites for geopotential heights at 500 hPa in NH (upper panels) and SH (lower panels) during EP (left column) with those during CP (right column). Units: gpm. |
Positive composite anomalies corresponding to both the EP and CP El Niño events occurred in the southern polar region and were encircled with negative anomalies over the mid-latitudes (Figs. 2c and 2d). In comparison, the anomaly amplitude in EP El Niño (Fig. 2c) was greater than that in CP El Niño (Fig. 2d), which is consistent with the greater amplitude in SSTA in the EP El Niño. This feature was also observed in the PDF of the projection coefficients of 500-hPa height anomalies onto the Southern Annular Mode (SAM) expressed as the leading EOF of Southern Hemisphere (SH) 500-hPa heights, which explains ~ 34% of the total variance (Fig. 3c). Although a shift to the positive projection, corresponding to the negative phase of SAM, was observed in both the EP and CP El Niño, the shape propagated more widely for the EP El Niño. This difference is statistically at the 95% confidence level for the Kolmogorov-Smirnov test.
The reasons for the different sensitivities induced by
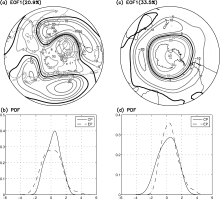 | Figure 3 (a) Leading EOF pattern of observational NH wintertime monthly 500-hPa geopotential heights and (b) the PDF of projection coefficients of observational winter monthly 500-hPa geopotential height anomalies onto the leading EOF. (c, d) Same as (a, b) but for SH. Dashed and solid lines in (b, d) correspond to EP and CP, respectively. |
the two types of El Niño on both extratropical hemispheres are worthy of exploring. Li et al. (2006) revealed that extratropical atmospheric sensitivity depends on the location of tropical Pacific SSTA such that the western Pacific SSTA tends to induce an NAO response while the same SSTA located in the eastern Pacific tends to induce a PNA-like response. They attributed this sensitivity to the dependence of an initial heating-induced quasi-stationary Rossby wave on the background flow and the interaction between an anomalous Rossby wave and transient eddies that amplify the sensitivity. The answer to whether this mechanism explains the difference in extratropical atmospheric circulation linked to the two types of El Niño events is intriguing.
Because latent heating dominates the total diabatic heating, rainfall reflects the total heating in the tropics overall reasonably well. As indicated in Figs. 1c and 1d, the composite rainfall anomaly exhibits a substantial difference. The EP El Niño events tend to induce intensified rainfall in a wide extended equatorial central-eastern Pacific region from the dateline to coastal Chile with the strongest rainfall intensification near 150° E. In comparison, the CP El Niño events tend to induce intensified rainfall over the central Pacific with the strongest occurring near the dateline. This difference in rainfall indicates a distinction of tropical heating between the El Niño types.
Dynamical linear baroclinic model experiments were analyzed in which two types of idealized heating were prescribed to represent the conditions under the two El Niño types. The results suggest a substantial difference in the LBM-simulated 500-hPa height responses in the extratropics despite an overall similarity in the PNA region for both EP and CP El Niño cases. This anomaly is further evident in the results of two additional sets LBM experiments. The first set constituted a total of 36 members, each of which was assigned an idealized heating in the tropical central Pacific (15° S-15° N, 165° E-165° W) and a maximum center shift at every grid point within the region. The second set was similar but with the heating center shift occurring in the central-eastern Pacific do-
main (15° S-15° N, 165° W-135° W). As was previously described, the estimated PDFs of the NAM/SAM index in the two sets of experiments were constructed on the basis on the two sets of runs, respectively. Figure 4a indicates that in the NH, a shift toward the negative-phase NAM is more visual in the CP El Niño case than that in the EP El Niño case. This difference in heating-induced linear extratropical atmospheric responses in the initial stage can be amplified through stationary wave-transient eddy feedback (Peng et al., 2003; Shin and Sardeshmukh, 2010; Li and Lau, 2012) and thus may account for the observed NH extratropical atmospheric sensitivity to the two types of El Niño. In the SH, both EP and CP El Niño induce a response similar to the negative-phase SAM. The significantly weaker stationary wave activity in the SH may explain the qualitative consistence in extratropical circulation for the two types of El Niño (Li et al., 2010; Li, 2010).
Observational analyses and diagnostic linear model experiments were used to compare the connection of two types of El Niño events to boreal wintertime extratropical circulation in both the hemispheres. The results suggest that in the NH, a CP El Niño event forces a negative-phase NAM response, which is in contrast with the PNA pattern forced by a traditional EP El Niño event. In the SH, both the EP and CP El Niño correspond to a negative-phase of the SAM but with greater amplitude for the EP El Niño.
Such a sensitivity in the extratropical atmosphere to different El Niño types accounts for the inconsistence (PNA versus NAO) in El Niño’ s effect reported in previous studies, and offers a theory on whether ENSO affects NAM/NAO. When additional EP El Niño cases were selected for composite analysis, as expected, a PNA-like impact was obtained. In contrast, when additional CP El Niño cases were included, an NAO signal was easily identified in addition to the PNA result. Moreover, a recent study by Li and Lau (2012) displayed the El Niño effect on NAO. These results may be attributed to the more frequent occurrence of the CP El Niño.
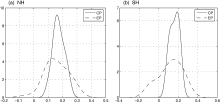 | Figure 4 (a) Probability distribution function of projection coefficients of LBM simulated 500-hPa geopotential height responses in NH to idealized heating, which shifts in the tropical Pacific according to the composite rainfall anomalies for the two types of El Nino events. (b) Same as (a) but for SH. Dashed and solid lines in correspond to EP and CP, respectively. |
It remains uncertain whether this observational analysis is reproducible in AGCM experiments. One recent study indicated that 2009-10 CP El Niño events induced a negative-phase NAM response (Fig. 5 in Ratnam et al., 2011). Nonetheless, this topic will be examined in our next research project.
| 1 |
|
| 2 |
|
| 3 |
|
| 4 |
|
| 5 |
|
| 6 |
|
| 7 |
|
| 8 |
|
| 9 |
|
| 10 |
|
| 11 |
|
| 12 |
|
| 13 |
|
| 14 |
|
| 15 |
|
| 16 |
|
| 17 |
|
| 18 |
|
| 19 |
|
| 20 |
|
| 21 |
|
| 22 |
|
| 23 |
|
| 24 |
|
| 25 |
|
| 26 |
|
| 27 |
|
| 28 |
|
| 29 |
|
| 30 |
|
| 31 |
|
| 32 |
|
| 33 |
|
| 34 |
|
| 35 |
|