

The authors used an atmospheric general circulation model (AGCM) of European Centre Hamburg Model (ECHAM5.4) and investigated the possible impacts of eastern Pacific (EP) and central Pacific (CP) El Niño on the winter precipitation anomalies in South China. A composite analysis suggested much more rainfall during the mature phase of EP El Niño than in the case of CP El Niño, and their corresponding observed wet centers to be located in the southeast coast and the region to the south of the Yangtze River, respectively. Results obtained on the basis of model-sensitive run imply that the model-simulated rainfall anomalies agree well with the observation, and the magnitude of simulated rainfall anomalies were found to be reduced when the amplitude of sea surface temperature anomaly (SSTA) forcing of EP and CP El Niño was cut down. These results imply that the rainfall anomaly in South China is very sensitive not only to the type of El Niño but also to its intensity.
The El Niño Southern Oscillation (ENSO) has shown the most significant interannual variability in the tropical Pacific Ocean, but its impacts on climate extend far beyond the tropical region. A number of studies have suggested that El Niño can be classified into two types according to the pattern of sea surface temperature anomalies (SSTAs) in the tropical Pacific: eastern Pacific and central Pacific (EP/CP) El Niño (refer to Fu et al., 1986, Trenberth and Stepaniak, 2001; Ashok et al., 2007; Xu et al., 2012).
South China is a region of large population and constitutes a large economic zone. In this region, the rainfall exhibits a large interannual variability not only in summer but also in winter, and the rainfall-related climate extreme events can result in a huge social and economic damage. Previous study results suggest that much more rainfall occurs during the mature phase of El Niño event (Zhang et al., 1999; Zhang and Sumi, 2002), but findings of recent studies suggest that these two types of El Niño have possibly different impacts on the precipitation anomaly in South China (Feng et al., 2010; Feng and Li, 2011; Yuan and Yang, 2012). However, the previous works are mainly based on data analysis. In this regard, we intend to apply a climate model to investigate further the impact of two types ENSO on the winter rainfall anomalies in this region. The impacts of these two types of El Niño will be investigated by performing sensitive numerical experiments for understanding the physical process. To achieve this goal, this manuscript is organized as follows: the data and methods of model experiments are described in section 2. In section 3, we address the observed impacts of two types of El Niño. The model-simulated results are discussed in section 4. In section 5, the observed and simulated impacts of EP and CP El Niño are analyzed. The summary is given in section 6.
The atmospheric data used in the present study were taken from National Centers for Environmental Prediction (NCEP) Reanalysis II with a horizontal resolution of 2.5° × 2.5° (Kanamitsu et al., 2002). The SST fields were derived from the Met Office Hadley Centre Sea Ice and Sea Surface Temperature (HadISST) dataset, with a resolution of 1.0° × 1.0° (Rayner et al., 2003), and the precipitation data were obtained from Climate Prediction Center (CPC) Merged Analysis of Precipitation (CMAP), with a grid resolution of 2.5° × 2.5° (Xie and Arkin, 1997).
Our numerical experiments were designed on the basis of an atmospheric general circulation model (AGCM) of European Centre Hamburg Model (ECHAM5.4) (Roeckner et al., 2003). The utilized version was T63L31, and the vertical domain in the model covered the levels from surface to 10 hPa. The SST fields used to force the model were derived from Atmospheric Model Intercomparison Project (AMIP) II Sea Surface Temperature and Sea Ice Concentration Boundary Conditions. The 50-year model control run was forced continually by the climatology of SST fields. In this study, we designed two types of model sensitivity run, which were forced by the composites of SST fields, covering developing-mature-decaying phase (two years) of EP and CP El Niño. The process was initiated on 1 January of the first year, and the sea ice fields were set to climatology. Ensembles of 25 members were designed for both the model control and the sensitive runs.
EP and CP El Niño events during 1979-2005 were defined on the basis of the maximum warming centers of SSTAs in the equatorial Pacific when an El Niño event occurred during that period. We could find two cases of typical EP El Niño (occurring during 1982-1983 and 1997-1998) and three cases of typical CP El Niño (occurring during 1994-1995, 2002-2003, and 2004-2005) during that period. We also noted several other El Niño events during this period, such as those occurring during 1986-1987 and 1990-1992. However, these El Niño events could not be distinguished clearly using EP and CP El Niño indexes, and hence were classified as EP or CP El Niño according to different definitions (refer to Table 2 of Xiang et al., 2013). Only the typical EP/CP El Niño events were selected for the present study.
Figure 1 shows the composites of the SSTAs and the wind anomalies at 850 hPa for the EP/CP El Niño events in winter (December-January-February, DJF). It can clearly be observed from the figure that the warming center of SSTA for EP El Niño was located in the eastern equatorial Pacific (from 170° W to the eastern coasts). For CP El Niño events, however, the warming center of SSTA mainly prevailed in the central equatorial Pacific (around dateline). The atmospheric circulation changes were found to be sensitive to the tropical SSTAs. In case of EP El Niño, low-level convergence anomalies were observed in the central-eastern equatorial Pacific, west to the warming center of SSTA, and westerly anomalies were found to be dominant in the western-central Pacific from about 160° E to 90° W (Fig. 1a). In case of CP El Niño, however, the observed westerly anomalies were relatively weaker and prevailed only in the western equatorial Pacific from about 150° E to 140° W (Fig. 1b).
During the mature phase of El Niño, the positive and negative precipitation anomalies are generally observed in the central equatorial Pacific and the western warm pool region, respectively. However, we noted that the pattern of precipitation anomalies was different between EP and CP El Niño (Figs. 1c-d). In the case of EP El Niño, positive precipitation anomalies dominated the central-eastern equatorial Pacific (from about 150° E to 80° W), whereas for CP El Niño, these were weaker, appearing mainly in the western-central equatorial Pacific. Our results agree with those of the previous studies (e.g., Ashok et al., 2007; Kug et al., 2009; Kao and Yu, 2009).
The observed responses of atmosphere and precipitation to EP/CP El Niño were discussed widely in previous works. However, fewer of these results were derived from model simulation. We noted that, forced by the SST composites corresponding to EP and CP El Niño cases, the AGCM of ECHAM5 could capture reasonably the aforementioned observed atmospheric responses of both precipitation and atmospheric circulation.
The model of ECHAM5 was able to simulate the observed climatological precipitation well (magenta contours in Figs. 1-3). For instance, the model-simulated Intertropical Convergence Zone (ITCZ) depicted by the 5 mm d-1 contour line (Figs. 2c-d) was similar to the observation (Figs. 1c-d), but with a stronger strength. The centers of observed precipitation in the mid-latitude North Pacific and North Atlantic could also be simulated by the model, particularly the observed precipitation center (above 2 mm d-1) in South China (Fig. 3) and the northeastward precipitation band in the south of Korean Peninsula.
Figure 2 shows the model-simulated wind anomalies at 850 hPa and precipitation in cases of EP and CP El Niño. As evident from the figure, there are no apparent differences between the model-simulated and the observed results in the low-level wind anomalies. For instance, the model-simulated anomalous westerlies in the western-central equatorial Pacific in case of EP El Niño exhibited an amplitude of about 5 m s-1, which was similar to the observed value. However, the simulated anomalous westerlies appeared mainly at the west to 120° W (Fig. 2a), whereas the observed anomalous westerlies extended to around 90° W (Fig. 1a). For CP El Niño also, the observed structure of anomalous westerlies in the western equatorial Pacific could be simulated well by the model, but with stronger amplitudes than those of the observed anomalous westerlies (Fig. 2b). In contrast to the wind anomalies for EP El Niño, the model-simulated positive precipitation anomalies were found to be dominant in the central-eastern equatorial Pacific (Fig. 2c), with a zonal extending feature as seen in the observed counterpart (see Fig. 1c). In addition, similar to the observation, the simulated anomalous precipitation was negative in the western warm pool regions. In case of CP El Niño, the simulated positive precipitation anomalies in the central equatorial Pacific were located west to about 150° W (Fig. 2d), similar to the observed anomalies (Fig. 1d).
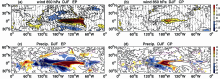 | Figure 1 Composites of (a, b) SST anomalies (shadings, with intervals of 0.5° C) and anomalous winds at 850 hPa (m s-1), and (c, d) anomalous precipitation (shadings, with intervals of 1 mm d-1) during the mature phase (December-February) of EP El Niño (left panels) and CP El Niño (right panels). The magenta-colored contour lines (5 mm d-1) represent (c, d) the observed climatological precipitation. The values of wind, SST, and precipitation anomalies are taken from the data of NCEP/DOE Reanalysis II, HadISST, and CMAP, respectively. |
These results show that the ECHAM5 performs well in the simulation of atmospheric responses to either EP or CP El Niño. The agreement between the observation and model simulation encourages us to investigate further the mechanism of the impact of different SSTAs on the precipitation in South China by performing ECHAM5-sensitive experiments.
Figure 3 shows the observed and model-simulated precipitation and wind anomalies at 850 hPa during the mature phases of EP El Niño and CP El Niño in boreal winter. Previous studies suggest that the anomalous Philippine Sea anticyclone (PSAC) during the mature phase of El Niño can affect the East Asian climate (Zhang et al., 1996). During EP El Niño events, the observed anomalous PSAC was strong (Fig. 3a). Significant southwesterly anomalies were observed near the southeast coast of China, which resulted in enhanced moisture transports to this region, leading to positive precipitation anomalies (Zhang and Sumi, 2002). Such observed results could be captured well by model simulation (Fig. 3b). For CP El Niño cases (Fig. 3d), however, the observed anomalous PSAC and the southwesterly anomalies near South China were weaker than those in EP El Niño events. As a result, the intensity of anomalous precipitation over the region of South China during CP El Niño events was less than those during EP El Niño events. For CP El Niño, the model-simulated anomalous wind and precipitation (Fig. 3e) pattern was also similar to the observed pattern.
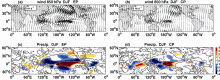 | Figure 2 (a, b) Model-simulated anomalous winds at 850 hPa (vectors, m s-1) and (c, d) anomalous precipitation (shadings, with intervals of 1 mm d-1) during the mature phase (December-February) of EP El Niño (left panels) and CP El Niño (right panels). The magenta-colored contour lines (5 mm d-1) represent the (c, d) simulated climatological precipitation. |
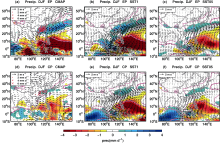 | Figure 3 (a, d) Observed and (b, c, e, f) ECHAM5-simulated anomalous precipitation (shadings, with intervals of 0.5 mm d-1) and wind anomalies at 850 hPa (vectors, m s-1) during the mature phase (December-February) of (a-c) EP El Niño and (d-f) CP El Niño. The observed precipitation values are based on the CMAP data. The results of ECHAM5 simulations forced by observed SST anomalies and half of their intensities are shown in (b, e) and (c, f), respectively. The (a, d) observed and (b, c, e, f) simulated climatological precipitations are shown with magenta contours, and the thick (heavy) lines indicate the 2 mm d-1 (5 mm d-1) values. The precipitation anomalies of 160 land stations in China, as obtained from the data of China Meteorological Administration (CMA), are indicated by the red cross-marks. |
Apparent precipitation anomalies were observed in China during the mature phases of both EP and CP El Niño, particularly in the region of South China (Fig. 3a). In EP El Niño cases, the center of positive precipitation anomalies was located near the southeast coasts, with a value of above 1 mm d-1 (Fig. 3a). In cases of CP El Niño, however, the positive precipitation anomalies were weaker, with a value of less than 1 mm d-1 (Fig. 3d), and the center of the anomalous precipitation shifted northward to the south of the Yangtze River.
The rainfall anomalies of 160 stations in China, obtained from the data of China Meteorological Administration (CMA), are indicated by red cross-marks for EP and CP El Niño in Fig. 3. Apparently, the station-related observed results also showed that the stations with positive precipitation anomalies located near the southeast coast (to the south of the Yangtze River) exhibited larger strength (weaker strength) during EP El Niño (CP El Niño), which matched with the CMAP gridded results well.
Differences in observed lower-level wind and precipitation anomalies in South China corresponding to the two types of El Niño have been discussed in previous studies (Feng et al., 2010; Yuan and Yang, 2012). We noted that the observed precipitation anomalies in the south of Yangtze River during CP El Niño was significantly weak (less than 1 mm d-1), and the positive precipitation anomalies could hardly be detected in the results of Feng et al. (2010) due to their coarse contour intervals. However, the negative precipitation anomalies around Philippine during CP El Niño showed similar spatial pattern and intensity to those reported by Feng et al. (2010). Thus, the precipitation anomalies in South China showed a robust difference between EP and CP El Niño.
It should be noted that the meridional spatial pattern of the precipitation anomalies over the western North Pacific and East Asia can be well simulated by the ECHAM5. Negative precipitation anomalies were observed in the regions around Philippine and positive precipitation band extending from South China northeastward to the south of Japan. The transformation of latitude from positive to negative precipitation anomalies around 18° N (21° N) in the observation could be captured by the simulated pattern for EP (CP) El Niño cases.
To investigate the sensitivity of the atmospheric circulation and precipitation to the intensity of SSTA, we designed a set of sensitive experiments. In these sensitive runs, the model was forced by half of the SSTAs in the case of EP/CP El Niño. The results showed that when the forcing SSTAs were reduced to a half, the model-simulated atmospheric responses in the tropics were weakened. In the meanwhile, the SST-forced precipitation anomalies in South China were weakened in both EP and CP El Niño cases (Figs. 3c and 3f). However, the positive/negative precipitation pattern was maintained even when the amplitude of forcing SSTA was reduced. This indicates that the SSTA spatial patterns play an important role in exciting atmospheric responses, while the amplitudes of atmospheric responses may depend on the SSTA intensity.
In the present study, based on the composite analysis, we applied an AGCM model of ECHAM5 to investigate the possible impacts of EP/CP El Niño on the winter rainfall anomalies in South China. Observations suggest that the impacts of the EP El Niño and CP El Niño on the precipitation in South China are different. The positive precipitation anomalies in South China were found to be more significant in case of EP El Niño than in case of CP El Niño. The centers of positive precipitation anomalies were observed to be located near the southeast coasts of China in case of EP El Niño and confined to the region to the south of the Yangtze River for CP El Niño. The model of ECHAM5.4 was found to simulate the observed precipitation anomalies in the tropical Pacific and South China when forced by the SSTA of these two types of El Niño. In the meanwhile, when the intensity of forcing SSTA was reduced, it was observed that the patterns of simulated precipitation anomalies were not changed but their amplitudes were weakened. Hence, it can be concluded that the tropical SSTA spatial patterns make a major contribution to exciting atmospheric responses, while the amplitudes of atmospheric responses may depend on the intensity of SSTA. The observations, together with the numerical experiments, clearly demonstrate that the winter precipitation anomalies in South China depend significantly on the SSTA pattern of EP and CP El Niño events. Therefore, we should take more care of the SSTA pattern of El Niño events when forecasting winter rainfall in South China.
| 1 |
|
| 2 |
|
| 3 |
|
| 4 |
|
| 5 |
|
| 6 |
|
| 7 |
|
| 8 |
|
| 9 |
|
| 10 |
|
| 11 |
|
| 12 |
|
| 13 |
|
| 14 |
|
| 15 |
|
| 16 |
|
| 17 |
|