

Driven by the global model, Beijing Climate Center Climate System Model version 1.1 (BCC_ CSM1.1), climate change over China in the 21st century is simulated by a regional climate model (RegCM4.0) under the new emission scenarios of the Representative Concentration Pathways— RCP4.5 and RCP8.5. This is based on a period of transient simulations from 1950 to 2099, with a grid spacing of 50 km. The present paper focuses on the annual mean temperature and precipitation in China over this period, with emphasis on their future changes. Validation of model performance reveals marked improvement of the RegCM4.0 model in reproducing present day temperature and precipitation relative to the driving BCC_CSM1.1 model. Significant warming is simulated by both BCC_CSM1.1 and RegCM4.0, however, spatial distribution and magnitude differ between the simulations. The high emission scenario RCP8.5 results in greater warming compared to RCP4.5. The two models project different precipitation changes, characterized by a general increase in the BCC_CSM1.1, and broader areas with decrease in the RegCM4.0 simulations.
Atmospheric-ocean coupled general circulation models (AOGCMs) are the primary tool used for climate change projections. Recently, a new set of coordinated climate model experiments, phase five of the Coupled Model Inter-comparison Project (CMIP5), have been conducted using over 50 models from 23 institutes (Taylor et al., 2012). CMIP5 includes simulations for assessment in the Fifth Report of the Intergovernmental Panel on Climate Change (IPCC AR5), as well as others that extend beyond. New emission scenarios of the Representative Concentration Pathways (RCPs, Meinshausen et al., 2011) are employed in the simulations.
Analysis of future climate changes for China based on multiple CMIP5 model simulations has recently commenced (Xu and Xu, 2012a, b; Yao et al., 2012). However, CMIP5 models are still in a coarse horizontal resolution of one to a few degrees, which cannot accurately reproduce the present day climate over China (Xu et al., 2010; Xu and Xu, 2012a). Previous studies have shown that regional climate models (RCMs), with higher resolution, can improve simulation of the East Asia monsoon climate (Gao et al., 2006, 2012; Shi et al., 2009; Yu et al., 2010; Zou and Zhou, 2013). Furthermore, when used for climate change projections, RCMs can not only introduce finer scale topographically induced structures in the climate change signal, they can also simulate some significantly different regional scale patterns of change compared to the driving GCMs (Gao et al., 2008, 2012; Zou and Zhou, 2013).
Six climate system models developed in China contribute to the CMIP5. They are Beijing Climate Center Climate System Model version 1.1 (BCC_CSM1.1) and Beijing Climate Center Climate System Model version 1.1-Medium resolution (BCC_CSM1.1-M) (Wu et al., 2013; Xin et al., 2013), Beijing Normal University-Earth System Model (BNU-ESM2.0) (http://esg.bnu.edu.cn/BNU_ESM_webs/htmls/index.html), Flexible Global Ocean-Atmosphere-Land System Model-grid version 2 (FGOALS-g2) (Li et al., 2013), Flexible Global Ocean-Atmosphere-Land System Model-spectral version 2 (FGOALS-s2) (Bao et al., 2013), and the First Institution of Oceanography Earth System Model (FIO-ESM) (Song et al., 2012). Among the models, BCC_CSM1.1 was selected to drive the regional climate model (RegCM4.0) of the Abdus Salam International Center for Theoretical Physics (ICTP) (Giorgi et al., 2012), to conduct regional climate change simulations in 21st century China (Ji, 2012). The present analysis focuses on annual mean temperature and precipitation from the BCC_CSM1.1-RegCM4.0 simulations.
Horizontal resolution of the atmospheric component of BCC_CSM1.1 is T42 (~ 2.8° ). Of all the climate change experiments conducted using this model, the historical simulation from 1950 to 2005, and the climate change simulations under RCP4.5 and RCP8.5 from 2006 to 2099 are used as initial and boundary conditions to drive the RegCM4.0. The RegCM series of models have been employed widely in China for a number of years, particularly for climate change simulations (Gao et al., 2001, 2012; Shi et al., 2012). In this study the domain of covered by RegCM4.0 includes the Chinese continent and surrounding areas, with a horizontal resolution of 50 km and 18 vertical layers (see Ji, 2012 for more details).
The RegCM4.0 simulation starts in 1950 (used as a spin-up) and is driven by the historical run of BCC_ CSM1.1 until 2005. Then two experiments are conducted, one for RCP4.5 (lower emission scenario) and one for RCP8.5 (higher emission scenario). The region of interest in the analysis is limited to the Chinese continent out of the larger RegCM4.0 domain.
To validate model performance, the observational dataset over China developed by Wu and Gao (2013, hereafter referred to as CN05.1) is employed in the study. The period of CN05.1 is from 1961 to 2007, with a resolution of 0.25° latitude by 0.25° longitude. The dataset is based on an interpolation from over 2400 observation stations in China focusing on four variables: daily mean, minimum and maximum temperature, and daily precipitation.
We validated the models by comparing simulated annual mean surface air temperatures against those observed for the present day period (Fig. 1). First, a general cold bias can be found in the BCC_CSM1.1 simulation for the region, similar to most CMIP3 and CMIP5 models (Xu et al., 2010; Xu and Xu, 2012a) . Secondly, differences between the BCC_CSM1.1 simulation and observations are characterized by a large cold bias in basins, and a warm bias over mountains (Fig. 1b), which can be largely attributed to the coarse resolution of BCC_CSM1.1. In the southern part of the Tarim Basin in Northwest China, a cold bias exceeding -10° C and a warm bias larger than 10° C over the Tianshan Mountain north of it can be found. As shown in Fig. 1c, great improvement can be found in the RegCM4.0 simulation. The improvement is more significant over eastern China where the bias generally ranges between -1° C and 1° C. A general cold bias is found over the Tibetan Plateau, with the largest value located along the Himalayas. It is noted that this is an area with few or no station observations available (Wu and Gao, 2013), indicating that uncertainties exist in the observational dataset. Warm biases found in the Northeast and northern part of the Northwest, are mostly due to the typical warm bias of RegCM in high latitudes in cold seasons.
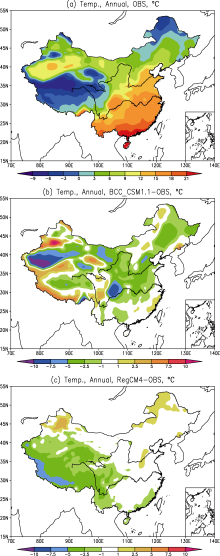 | Figure 1 Annual mean temperature of 1986-2005 over China (° C): (a) Observation; differences between simulations and observation by (b) BCC_CSM1.1 and (c) RegCM4.0. |
Present day observed and simulated annual mean precipitations using BCC_CSM1.1 and RegCM4.0 are presented in Figs. 2a, 2b, and 2c, respectively. The largest discrepancy found in BCC_CSM1.1 simulations (Fig. 2b) compared to the observational data is the high precipitation center, which extended from southwestern China to the eastern edge of the Tibetan Plateau. This is a common feature of coarse-resolution GCMs, in both the CMIP3 and the most updated CMIP5 models (Xu et al., 2010; Xu and Xu, 2012a). As suggested by Gao et al. (2006, 2012), a higher resolution is needed to accurately reproduce the distribution of precipitation over the region. In the meantime, the maximum observed rainfall over southeastern China is not captured by BCC_CSM1.1. As a typical coarse resolution model, the topographical effects of precipitation in Northwest China are not well reproduced.
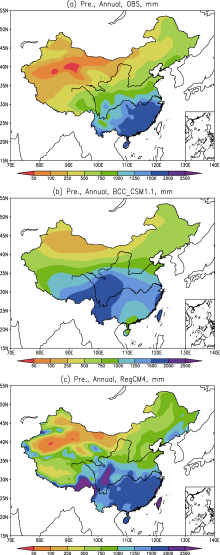 | Figure 2 Annual mean precipitation of 1986-2005 over China (mm): (a) Observation; simulations by (b) BCC_CSM1.1 and (c) RegCM4.0. |
Greatly improved simulation using RegCM4.0 is firstly seen in the precipitation center at the edge of the Tibetan Plateau (Fig. 2c). It is substantially reduced and the pattern is a better representation of observed data, although the intensity of the rainfall centre is increased. Secondly, in agreement with observation, the main precipitation center is simulated in southern China by RegCM4.0. Regional details are well reproduced using RegCM4.0; for example the contrast of precipitation peak over the Qilian Mountain and the dryness in the nearby Qaidam Basin to its southwest.
Simulated future changes of annual mean temperature under RCP4.5 and RCP8.5 scenarios using both BCC_ CSM1.1 and RegCM4.0 for the late 21st century (2080-2099) are shown in Fig. 3. Substantial warming is found in all model simulations and under different scenarios. In general, greater temperature rises at high latitude and high altitude areas (Tibetan Plateau), and greater values under RCP8.5 compared to RCP4.5 are found. Note the projected warming by BCC_CSM1.1 over China is less than that of the multi-CMIP5 model ensemble (Xu and Xu, 2012b).
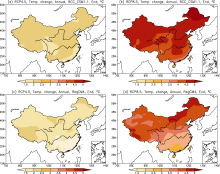 | Figure 3 Changes in annual mean temperature over China under different scenarios (2080-2099 relative to 1986-2005) (° C): (a) BCC_CSM1.1 under RCP4.5, (b) BCC_CSM1.1 under RCP8.5, (c) RegCM4.0 under RCP4.5, and (d) RegCM4.0 under RCP8.5. |
Differences in simulated temperature changes are firstly found in the greater regional details from RegCM 4.0 due to its higher resolution. Secondly, less warming is generally simulated by RegCM4.0 relative to BCC_ CSM1.1. Regional mean temperature changes for BCC_ CSM1.1 and RegCM4.0 under RCP4.5/RCP8.5 are 2.0° C/ 4.3° C and 1.8° C/3.8° C, respectively. The two models also exhibit differences in the spatial distribution of warming. The pattern of greater warming in the north and less in the south is more evident in RegCM4.0 simulations, and to some extent in BCC_CSM1.1 under RCP8.5, however it was difficult to observe under RCP4.5.
The warming in the RegCM4.0 model for the RCP4.5 scenario is usually less than 1.5° C in southern China, reaching 1.5-2° C for most other places. The largest warming, exceeding 2.0° C, was found in portions of the Northeast and the Tibetan Plateau. Under the RCP8.5 scenario, the least warming, of less than 3° C, was simulated in southern-most China, with warming reaching 3.5° C north of the Yangtze River basin. The maximum warming of 4.5-5° C was found in the area extending from the northern end of the Northeast to western end of Inner Mongolia, and over portions of the Tibetan Plateau.
Figure 4a presents the time evolution of temperature changes in the 21st century. As shown in the figure, warming follows a similar magnitude prior to 2050 under RCP4.5 and RCP8.5, indicating that the warming is less scenario dependent in the first half of the 21st century. In later half, however, the temperature continues to rise almost linearly under the RCP8.5 scenario, while quasi stabilization was found for RCP4.5.
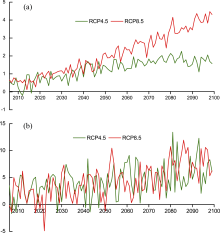 | Figure 4 Regional mean changes of (a) annual mean temperature (° C) and (b) precipitation (%) in the 21st century (2006-2099) over China as simulated by RegCM4.0 (relative to 1986-2005). |
Figure 5 shows the changes in annual mean precipitation. Again, RegCM4.0 simulations are more spatially detailed, for example the greater increase over Tarim and Junggar in the northwest. In general, more areas with decreased precipitation can be found in RegCM4.0 compared to BCC_CSM1.1 simulations. Further analysis, not shown for brevity, indicated that the differences are predominantly found in the monsoon season. Consistent with our previous findings, this is largely attributed to the stronger and more realistic topographic forcing in higher resolution RegCM4.0 simulations (Gao et al., 2012).
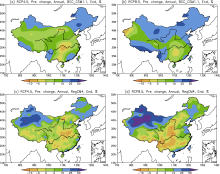 | Figure 5 Changes in annual mean precipitation over China under different scenarios (2080-2099 relative to 1986-2005) (%): (a) BCC_CSM1.1 under RCP4.5, (b) BCC_CSM1.1 under RCP8.5, (c) RegCM4.0 under RCP4.5, and (d) RegCM4.0 under RCP8.5. |
Regional mean increases for BCC_CSM1.1 and RegCM 4.0 under RCP4.5/RCP8.5 are 8.6%/13.4% and 6.3%/ 8.0%, respectively. The two models differed in response to greater forcings from emissions. BCC_CSM1.1 projects less amount and coverage of the decrease, and larger amount and coverage of the increase under the RCP8.5 scenario compared to the RCP4.5. Alternatively, RegCM4.0 simulates broader areas of decrease while the larger amount of increase is found in the northwest only under RCP8.5. The counterbalance of increases and decreases results in less difference in the future regional mean under the two scenarios (Fig. 4b).
In this paper, we presented climate change simulations for China by RegCM4.0 in the 21st century under RCP4.5 and RCP8.5 emission scenarios. The focus of our analysis was on annual mean temperature and precipitation.
Validation of model performances showed that RegCM4.0 improves simulations for both temperature and precipitation over China compared to the driving BCC_CSM1.1. For projected changes, RegCM4.0 provided more spatial details in the climate change signals for both temperature and precipitation. Greater warming was found under the RCP8.5 scenario compared to RCP4.5. The warming simulated by RegCM4.0 was in general weaker than that of the driving BCC_CSM1.1. Temperate simulated by RegCM4.0 rises in the end of the 21st century in the range of 2.5-5° C over China under RCP8.5. In addition, the warming is more significant in northern areas and over the Tibetan Plateau. While a general increase in precipitation was simulated by BCC_CSM1.1 toward the end of the century, RegCM4.0 projects broader areas with a decreased. The largest area with decreased precipitation extends from central Inner Mongolia down to southwestern China. A decrease in precipitation was also found south of the mid and lower reaches of the Yangtze River, as well as areas over the Tibetan Plateau.
Our findings suggest that regional scale climate change signals based on the current ensemble of global models should be taken very cautiously. Moreover, the limited RCM simulations available to date make it hard to derive more robust information on climate change over regional scales, which calls for the completion of large multi-GCM/RCM ensembles in the future (CORDEX, Giorgi et al., 2009).
| 1 |
|
| 2 |
|
| 3 |
|
| 4 |
|
| 5 |
|
| 6 |
|
| 7 |
|
| 8 |
|
| 9 |
|
| 10 |
|
| 11 |
|
| 12 |
|
| 13 |
|
| 14 |
|
| 15 |
|
| 16 |
|
| 17 |
|
| 18 |
|
| 19 |
|
| 20 |
|
| 21 |
|
| 22 |
|
| 23 |
|