

The authors examined the variability in wintertime cyclone activity and storm tracks and their relation to precipitation over China for the period 1951-2006 using the observational data. Two apparent modes of variability were assumed for the cyclone activity and storm tracks. The first mode describes the oscillation in the strength of the storm tracks in East Asia, which significantly increased since the mid-1980s, whereas the second mode describes a seesaw oscillation in the storm track strength between the Central-Southeast China and northern East Asia. The storm tracks over the Central-Southeast China have increased since the late 1960s. The possible causes for the variation of the cyclone activity and storm tracks are also explored. It is shown that wintertime precipitation, which has increased since the mid-1980s, concentrates in Central-Southeast China. The enhancement may be caused by the first mode of variability of storm tracks, whereas the interannual variability of precipitation may be linked to the second mode of the storm track variability.
In winter, China is strongly affected by weather systems such as extratropical cyclones (cyclones, in short hereafter), which owe their existence to the baroclinic instability of the atmospheric westerly jets. The cyclones frequently bring about severe weather such as strong winds, low temperatures, freezing rain, heavy snow storms, etc., and cause human casualties and heavy property damages. Particularly, studies show that the winter East Asia monsoon (WEAM) has weakened since the mid-1980s (Wang and Li, 2003; Yao et al., 2003; Wang and Guo, 2005; Wang et al., 2007a, b). The response of cyclone activity to the weakening WEAM is important for understanding and predicting the weather and climate over China.
Recently, we studied the wintertime cyclone activity for 1951-2006 (Chen, 2013; Chen et al., 2013①). Half of the cyclones that affect China are produced outside China, that is, Mongolia and neighboring regions, whereas the main source regions within China are Northeast China, North China, Central-Southeast China, Southwest China, and Northwest China. We also found an upward trend in cyclone frequency and a downward trend in intensity for the winters during 1951-2006 with an abrupt change around mid-1980s, which coincides well with the weakening of WEAM.
The effect of the changing cyclone activity on the precipitation over China is the focus of this study. There have been already several studies dealing with wintertime precipitation variability over China. Shi (1996), Wang and Chen (2010), Zeng et al. (2010) found that there is a close relation between precipitation and WEAM; the stronger (weaker) WEAM, the less (larger) the precipitation is. Zhou (2010) and Zhou and Wu (2010) found that in addition to WEAM the El Niño-Southern Oscillation (ENSO) could also influence the winter precipitation over southern China. For El Niño (La Niña) years the precipitation anomaly is positive (negative) (Tao and Zhang, 1998; He et al., 2006; Feng et al., 2010). This study focuses on the wintertime variability of the cyclone and storm track activity over China and its possible relation to the precipitation variability. The possible mechanisms that affect cyclone activity are also explored.
The primary data used for cyclone detecting and tracking in this study were the six-hourly 2.5° × 2.5° gridded reanalysis data from the National Centers of Environmental Prediction/National Center for Atmospheric Research (NCEP/NCAR) (Kalnay et al., 1996) for 56 winters from December-January-February (DJF) of 1951-1952 to 2006-2007. We used daily 2.5° × 2.5° gridded reanalysis data of meridional winds and surface air temperatures, and precipitation data from the recently released dataset of the Asian Precipitation-Highly-Resolved Observational Data Integration towards Evaluation of Water Resources (APHRODITE’ s Water Resources). The datasets were primarily taken from a rain gauge observation network. We used APHRO_MA_V1003R1, which covers a longer period, incorporates more data, and is corrected for bugs relative to APHRO_MA_V0902. Details can be founded in Yatagai et al. (2009). The precipitation data for monsoon in Asia (15° S-55° N, 60° E-150° E) have a spatial resolution of 0.5° × 0.5° from 1951 to 2007 and cover the spatial domain and time series we are interested in. More details can be found at http://www.chikyu.ac.jp/precip/products/index.html.
This paper focuses on cyclone that generated, terminated or passed through China. The cyclone trajectories were estimated by the feature tracking algorithm of Hodges (1994, 1995, 1996, 1999). In this algorithm, a range of meteorological variables at different vertical levels are used to identify and track the so-called features. Instead of sea-level pressure (SLP) (McCabe et al. 2001; Wang et al., 2009), we used the relative six-hourly vorticity at 850 hPa. A total of 1348 cyclone tracks were detected for the 56 winters considered. A random check of the weather chart show that the life cycles of the cyclones detected by the tracking algorithm are usually longer than estimates from weather charts.
We followed Mailier et al. (2006) to describe the local cyclone frequency (the so-called transit counts) of cyclone tracks, which is defined as the number per month of cyclone tracks crossing the local meridian within ± 10° of latitude barriers from the base point. The traditional storm track revealed by the meridional wind variance field and its variability were also analyzed to better describe the three-dimensional features of the storm tracks and their relation to precipitation.
The transit counts of the cyclones roughly represent the cyclone frequency. Figure 1 shows the mean of the transit counts of related China cyclones for winters in 1951-2006 and the first two empirical orthogonal function (EOF) analysis (loading field) of East Asia cyclone transit counts. The shape of the contours of the cyclone transit counts is enlarged east-west from China across the whole North Pacific with a maximum at southern part of Northeast China (Fig. 1a). The southern part of Northeast China is mostly influenced by cyclones and northern China (north of 35° N) is more frequently influenced than south-ern China, which agrees with the fact that 80% of the cyclones that affect China are produced in northern East Asia (north of 35° N) and only 20% are produced in southern China (south of 35° N) (Chen et al., 2013①).
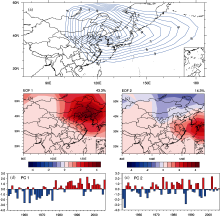 | Figure 1 Contour transit count map of (a) the cyclones and (b), (c) their first two EOFs; (d) and (e) corresponding time series. |
In order to understand the spatial and temporal variability of cyclone activity, we performed an EOF analysis of the transit counts over East Asia. Figures 1b and 1c show the first and second spatial EOF modes (loading field) of the cyclone transit counts, respectively. The first EOF mode accounts for 43.3% of the total variance and it is a monopole pattern centered at Northeast China. An obvious abrupt shift occurred around late 1970s and early 1980s in the corresponding time series from negative to positive values (Fig. 1d). Obviously, this mode represents the cyclone activity variability over northern China, indicating that northern China is more frequently affected by cyclones after 1980 than before 1980. The second EOF mode of the cyclone transit counts is a dipole with two anomalous centers located at the northern and southern East Asia, respectively, which reflects the seesaw oscillation between the two centers (Fig. 1c) and it explains 14.3% of the total variance. There is an upward trend in southern East Asia and a downward trend in northern East Asia for the cyclone transit counts and an abrupt change in late 1960s (Fig. 1e), which is about 15 years earlier than the first EOF mode. This mode actually reflects the cyclone activity variability over southern China.
The trends of the cyclone transit counts over northern and southern China are in agreement with the trends of cyclone numbers produced over the two regions. Figures 2a and 2b show the time series of the annual cyclone numbers produced over northern East Asia and southern China, respectively. As we can see, the annual cyclone numbers over northern East Asia increase and an abrupt increase occurs in late 1970s and early 1980s (Fig. 2a), which is in good agreement with the first EOF mode of the transit counts. An increase in the annual number over southern China is observed in late 1960s, which is also in good agreement with the cyclone activity variability over southern China described by the second EOF mode of the cyclone transit counts (Fig. 2b).
 | Figure 2 Annual cyclone numbers over (a) northern East Asia and (b) southern China. |
The above results of the cyclone activity trends were obtained based on the tracking algorithm, which was further confirmed by more traditional views of storm tracks. Figure 3 shows the wintertime climate of the 2-7-day bandpass meridional wind variance at 850 hPa and the first two EOFs over East Asia for 1951-2006. The storm track features in Fig. 3a are similar to the ones from cyclone transit counts (Fig. 1a); however, significant differences exist between them. The maximum center of cyclone activity in the transit counts is located at Northeast China, whereas the maximum center of the meridional wind variance is centered at the East China Sea. The difference may be caused by the fact that the transit counts well describe the cyclone frequency but fail to describe the strength of the cyclones as the storm tracks do. Another possible cause that leads to the difference may be that the transit counts used here are calculated based on cyclones generated, terminated, or passing through China, whereas the storm track is calculated based on the meridional wind variance at each grid that contains contributions from the cyclones and anticyclones not entering China. We compared the meridional storm tracks with the cyclone transit counts over East Asia. The features according to the first two EOFs of the meridional wind variance (Figs. 3b-e) and the transit counts (Figs. 1b-e) are similar, although remarkable differences exist. The most significant difference is that there is a secondary local maximum centered at southern China in the meridional wind variance field, which may strongly affect the precipitation there. This is in contrast to the first two EOF modes of the transit counts.
 | Figure 3 The wintertime 850 hPa meridional (a) wind variance field for 1951-2007 over East Asia; (b) its first EOF mode and (d) time series; (c) second EOF mode and (e) time series. Contour intervals are 2 m2 s-2 in (a) and 0.25 in (b) and (c). |
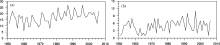
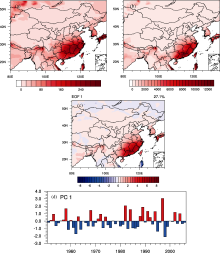
We also looked at the precipitation and its relation with the cyclone activity and storm tracks. Figures 4a and 4b show climate data and the variance of wintertime precipitation over East Asia for 1951-2006. The wintertime precipitation and its variance are primarily located over Central-Southeast China. Figures 4c and 4d show the first EOF mode (loading field) of the precipitation and its time series, respectively. It is clearly seen that the precipitation over Central-Southeast China significantly increased from 1988 to late 1990s, which agrees with Wang and Feng (2011). To verify that this precipitation increase actually occurs in the real atmosphere, we calculated the difference of precipitation between 1988-2006 and 1969-1987, and detected an increase in precipitation (Fig. 5a). On the basis of Figs. 3d and 3e, we argue that the precipitation variability and the trend may be caused by the storm track variability represented by the two EOF modes of the storm tracks. It is apparent that both the first mode of the storm track variability and the precipitation show an upward trend and an abrupt change at 1986 or so. The precipitation and storm tracks trends coincide; therefore, it is reasonable to argue that the precipitation enhancement is most likely caused by the storm track variability represented by the first EOF mode. The interannual precipitation variability may be closely coupled with the storm track variability described by the second EOF mode. The first EOF mode of the storm tracks mainly represents the northern East Asia cyclones, whereas the second one corresponds to the southern cyclones of East Asia, and they are independent of each other. To confirm this assumption, we ran the regression map of the precipitation against the normalized southern cyclone number of East Asia. The result definitely supports our hypothesis (Fig. 5b). The correlation between the southern cyclone number and the first EOF time series of precipitation is as high as 0.56, which is statistically at the 99% confidence level.
 | Figure 4 (a) Climate data, (b) variance, (c) the first EOF spatial mode, and (d) time series of wintertime precipitation over East Asia for 1951-2006. Contour intervals are 20 mm in (a), 500 mm2 in (b), and 0.5 in (c). |
 | Figure 5 (a) Difference in precipitation between 1988-2006 and 1969-1987 and (b) regression map of the precipitation upon the annual cyclone numbers over southern China. Contour interval is 5 mm in both maps. |
To understand the reason for the cyclone changes, we examined the trends in the surface temperature for winters in 1951-2006 over East Asia. Figure 6 shows the climate data and the first EOF mode (show loading field) of wintertime surface air temperatures over East Asia from 1951-1952 to 2006-2007. Generally the surface temperature is lower over higher latitudes (north of 30° N) than lower latitudes (south of 30° N), as expected. The first EOF explains 46.3% of the total variance. The first EOF mode represents a uniform increase in the surface air temperature with a maximum at Mongolia and a minimum at Southwest China (Fig. 6b). There is an abrupt change at around late 1970s and early 1980s (Fig. 6c), which is in good agreement with the trend of the East
Asia winter monsoon and the trend of the cyclone transit counts or numbers over northern East Asia. Therefore we infer that this abrupt change of surface temperature might be caused by the warming of the tropical East Indian ocean and West Pacific (the warm pool) since 1980 (Kumar et al., 2010). This may relate to the abrupt change in the cyclone numbers.
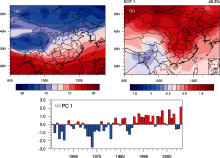 | Figure 6 (a) Climate data of wintertime surface air temperature for 1951-2007 in East Asia. (b) EOF1 (loading field) of surface air temperature and (c) its time series. Contour intervals are 5° C in (a) and 0.2 in (b). |
Furthermore, it is interesting to note that together with the variation of the cyclone activity and storm tracks over East Asia the subpolar and subtropical jets over East Asia also experience a similar variation. Chen et al. (2013)① also observed an abrupt increase of the subpolar jet strength around 50° N in the mid-1980s and an enhancement of the subtropical jet strength around 35° N from mid-1960s to late 1970s, which enhances the baroclinicity and favors cyclone genesis and development over northern East Asia and southern China, respectively.
Based on the NCEP/NCAR reanalysis data and precipitation data from the APHRODITE's Water Resources, the cyclone activity and its possible relation to precipitation over wintertime China are investigated and the main conclusions are the following:
(1) Two modes of variability in wintertime cyclone activity (the transit counts of the cyclone frequency and the storm tracks) are found. The first mode reflects the variation in the storm track strength over the eastern part of East Asia. An upward trend is detected for the period of 1951 to 2006 and an abrupt increase is seen in late 1970s and mid-1980s. The second mode has two centers. One is in Southeast China and the second is in northern East Asia. There is an upward trend in the storm tracks over Southeast China with a significant enhancement in the late 1960s. The northern cyclones dominate the variations in the wintertime cyclone number.
(2) The wintertime precipitation over Central Southeast China shows an apparent variability at interannual and decadal scales for the winters of 1951-2006. After the late 1980s, there is a significant increase in the precipitation over Central-Southeast China. These interannual and decadal variations may be caused by the variability in the storm track and cyclone activity represented by the first two EOF modes of the meridional wind variance filed. The southern cyclones can partly explain the precipitation variances during wintertime.
(3) The surface temperature over the East Asia has been increasing since the mid-1980s and correspondingly the subpolar jet over the East Asia, which might be responsible for the cyclone activity and storm track variability described by the first EOF mode.
| 1 |
|
| 2 |
|
| 3 |
|
| 4 |
|
| 5 |
|
| 6 |
|
| 7 |
|
| 8 |
|
| 9 |
|
| 10 |
|
| 11 |
|
| 12 |
|
| 13 |
|
| 14 |
|
| 15 |
|
| 16 |
|
| 17 |
|
| 18 |
|
| 19 |
|
| 20 |
|
| 21 |
|
| 22 |
|
| 23 |
|
| 24 |
|
| 25 |
|