

This study discusses the potential contribution of the Pacific decadal oscillation (PDO) to the weakening of the East Asian summer monsoon (EASM) and the evident correlation between the positive PDO and “ Southern flood and Northern drought (SFND)” summer rainfall pattern over East China. The mechanism behind this contribution is also discussed.
Observations suggest that the East Asian summer monsoon (EASM) has weakened since the late 1970s, whereas the Pacific decadal oscillation (PDO) underwent a shift from a negative to positive phase. Furthermore, several studies have suggested a possible link between the PDO and decadal EASM variability and the associated summer rainfall changes over East China (i.e., Jonny and Zhou, 2005; Li et al., 2010; Zhu et al., 2010) since late 1970s. In this study, I investigated whether PDO played a role in modulating the decadal EASM variability during the last century and up to the present.
The PDO pattern is defined as the leading empirical orthogonal function (EOF) of sea surface temperature anomalies (SSTA) in 20-65° N within the North Pacific Ocean. During the last century, three typical PDO phases have been identified starting from 1925 (Mantua et al., 1997); therefore, I extended the study period from 1925 to 2010. The PDO index is taken from http://jisao.washington.edu/pdo/. The other observed or reanalyzed datasets used in this study include: 1) the gridded Global Precipitation Climate Centre(GPCC) Full Data Reanalysis Version 6.0 at 0.5° (Schneider et al., 2011), 2) the Hadley Centre Sea Level Pressure (SLP) dataset (HadSLP2, Allan and Ansell, 2006), 3) the extended reconstructed SST version 3 (Smith et al., 2008), and 4) the reanalyzed data from the National Centers for Environmental Prediction/National Center for Atmospheric Research (NCEP/NCAR, Kalnay et al., 1996) including the data from 1948 to 2011. To determine the western Pacific subtropical high (WPSH) variations before 1948, the reconstructed northern hemisphere 500-hPa geopotential height dataset from the late 19th century (Gong and Wang, 2000, hereafter referred as to GW2000; Gong et al., 2006) was also used in this study. In addition, I calculated the four EASM indices (EASMIs) using data from previous studies (Table 1).
| Table 1 Definition of the EASM indices used in this study. |
Figure 1 represents the nine-year running mean with the lowpass-filtered EASMIs and PDO index during 1920-2010. From Fig. 1, the three predominant PDO phases of the last century are positive (P1; 1925-1946), negative (N1; 1947-1976), and back to positive (P2; 1977-1998). After the 1990s, PDO started to decrease, and in 2002, it turned into a negative phase (N2; 2002-2010). For the decadal EASM variability, all EASMIs demonstrate a weakening trend from 1948 till the late 1990s and recover in 1997-2010. There are negative correlations between PDO and EASMIs; -0.63 with the Li index, -0.82 with the Zhang index, and -0.69 with the Zhu index during 1948-2010, and -0.67 with the Guo index during 1925-2004 .
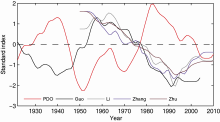 | Figure 1 The standardized PDO and four EASM indices. The Li, Zhang, and Zhu indices show the EASM variability during 1948-2010 due to the available periods of the observed winds (NCEP/NCAR reanalysis dataset). |
The negative correlation between PDO and the decadal EASM variability can be further demonstrated by the changes in the summer (Jun-July-August; JJA) rainfall band over East China (Fig. 2). The differences between N1 and P1 (Fig. 2a) indicate more rainfall in northern China (32-40° N, 110-120° E) with deficiencies to the south of the YRV region (22-27° N, 105-120° E), whereas an opposite distribution can be seen as PDO turns into the P2 phase (Fig. 2b). During the recent N2 phase, significantly increased rainfall in most parts of northern China and significantly decreased in the YRV region (Fig. 2c) can be observed. Note the somewhat different locations of the decreased rainfall over the YRV region between the N1 and N2 phases, where there is more southward extension during N1 relative to N2 (Fig. 2a and 2c). Nevertheless, the anticorrelation between the north-south shifts of the rainfall band and the PDO phases is evident. The composite summer rainfall (Fig. 2d) based on the differences between the positive and negative phases during 1920-2010 further demonstrated the linkage between the positive PDO and Southern flood and Northern drought (SFND)-like pattern.
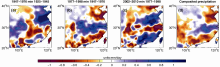 | Figure 2 The differences in the summer (June-August) rainfall over East China between (a) the N1 and P1 phases, (b) P2 and N1 phases, (c) N2 and P2 phases, and (d) composite summer rainfall based on the differences between the positive and negative PDO phases during 1920-2010. The differences with confidence levels exceeding 90% are denoted as the white dots. |
The positive PDO is featured as central cooling in the North Pacific and surrounded by warm SSTA along the west coast of the Americas in the eastern subtropical Pacific, a strengthened Aleutian Low during winter, and associated southern westerly winds. The anomalous southern westerly winds decelerate the eastern trade winds and reduce the evaporative heat loss to warm the tropics in the following seasons during the positive PDO phases (Fig. 3). This coupled wind-evaporation-SST (WES) feedback has been used by several studies to explain the impacts of the subtropical-extratropical climate anomalies on the tropics (i.e., Liu and Xie, 1994; Wu et al., 2007).
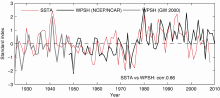 | Figure 3 The standardized time series of WPSH and SSTA in ETP. The WPSH index during 1925-1953 is calculated on the basis of the reconstructed 500-hPa geopotential height dataset by GW 2000 and 1948-2010 from the NCEP/NCAR reanalysis dataset. |
Figure 3 also shows a positive correlation (0.66) between the eastern tropical Pacific (ETP) SSTA index and WPSH strength (defined as the mean summer 500-hPa geopotential height anomalies averaged over 20-25° N and 125-140° E). Previous studies (i.e., Zhou et al., 2009) attributed the western extension and intensification of WPSH after the late 1970s to the warming in the tropical Indian Ocean-western tropical Pacific Ocean (IWP), based on the results from five AGCM forced by the warm SSTA in IWP; however, the potential contribution from ETP was not addressed. In fact, several studies suggested that the 500-hPa potential height anomalies are coupled with the ETP SSTA on interdecadal time scale (e.g., Zhang et al., 1996; Wu and Zhou, 2008). In this study, I consider this positive correlation to suggest the possible contribution of the warm ETP SSTA to the intensification of WPSH. The mechanism for the possible forcing of the ETP SSTA on WPSH is beyond the scope of this study and requires extra SSTA-forcing experiments to investigate it further.
WPSH has been identified as an important component of EASM (Gong and Ho, 2002). When WPSH becomes stronger, less northward water vapor is transported into northern China and detained in the vicinity of YRV, resulting in a SFND-like pattern. Zhu et al. (2010) suggested that the recent negative PDO phase induced warming over Lake Baikal and caused the weakened meridional thermal gradient between 32-42° N. It subsequently decreased the moisture transport away from the Huanghuai River region (32-36° N, 110-121° E) and contributed to the increased summer rainfall (2000-2008) in this region compared with that during 1979-1999. However, in Fig. 4, a strengthened meridional thermal gradient between 32-42° N can be seen during the early negative PDO phases (N1; 1947-1976), whereas the rainfall over northern China— where the Huanghuai River region is— increased compared with that in the P1 phase (Fig. 2a). Therefore, it is more likely that during the early shifts of the PDO phase (from P1 to N1) WPSH plays an important role in the changes of the summer rainfall distribution over East China by modulating the northward water vapor transport.
 | Figure 4 The standardized meridional thermal gradient between 32-42° N (averaged over 110-120° E) and the PDO index. |
In this study, I documented the negative correlation between PDO and the decadal variability of EASM. The EASM variability is considerably complex and the proposed PDO mechanism cannot explain all EASM variations; however, it indicates the potential contribution of the positive phase to the weakening of EASM. The impact of the global or regional SSTs on the decadal EASM shifts are important, as suggested by several other studies (Fu et al., 2009; Fu and Li, 2013).
| 1 |
|
| 2 |
|
| 3 |
|
| 4 |
|
| 5 |
|
| 6 |
|
| 7 |
|
| 8 |
|
| 9 |
|
| 10 |
|
| 11 |
|
| 12 |
|
| 13 |
|
| 14 |
|
| 15 |
|
| 16 |
|
| 17 |
|
| 18 |
|
| 19 |
|
| 20 |
|
| 21 |
|
| 22 |
|