Predicting Western Pacific Subtropical High Using a Combined Tropical Indian Ocean Sea Surface Temperature Forecast
WANG Li-Wei1, 2, 3 , ZHENG Fei1  , ZHU Jiang
1
, ZHU Jiang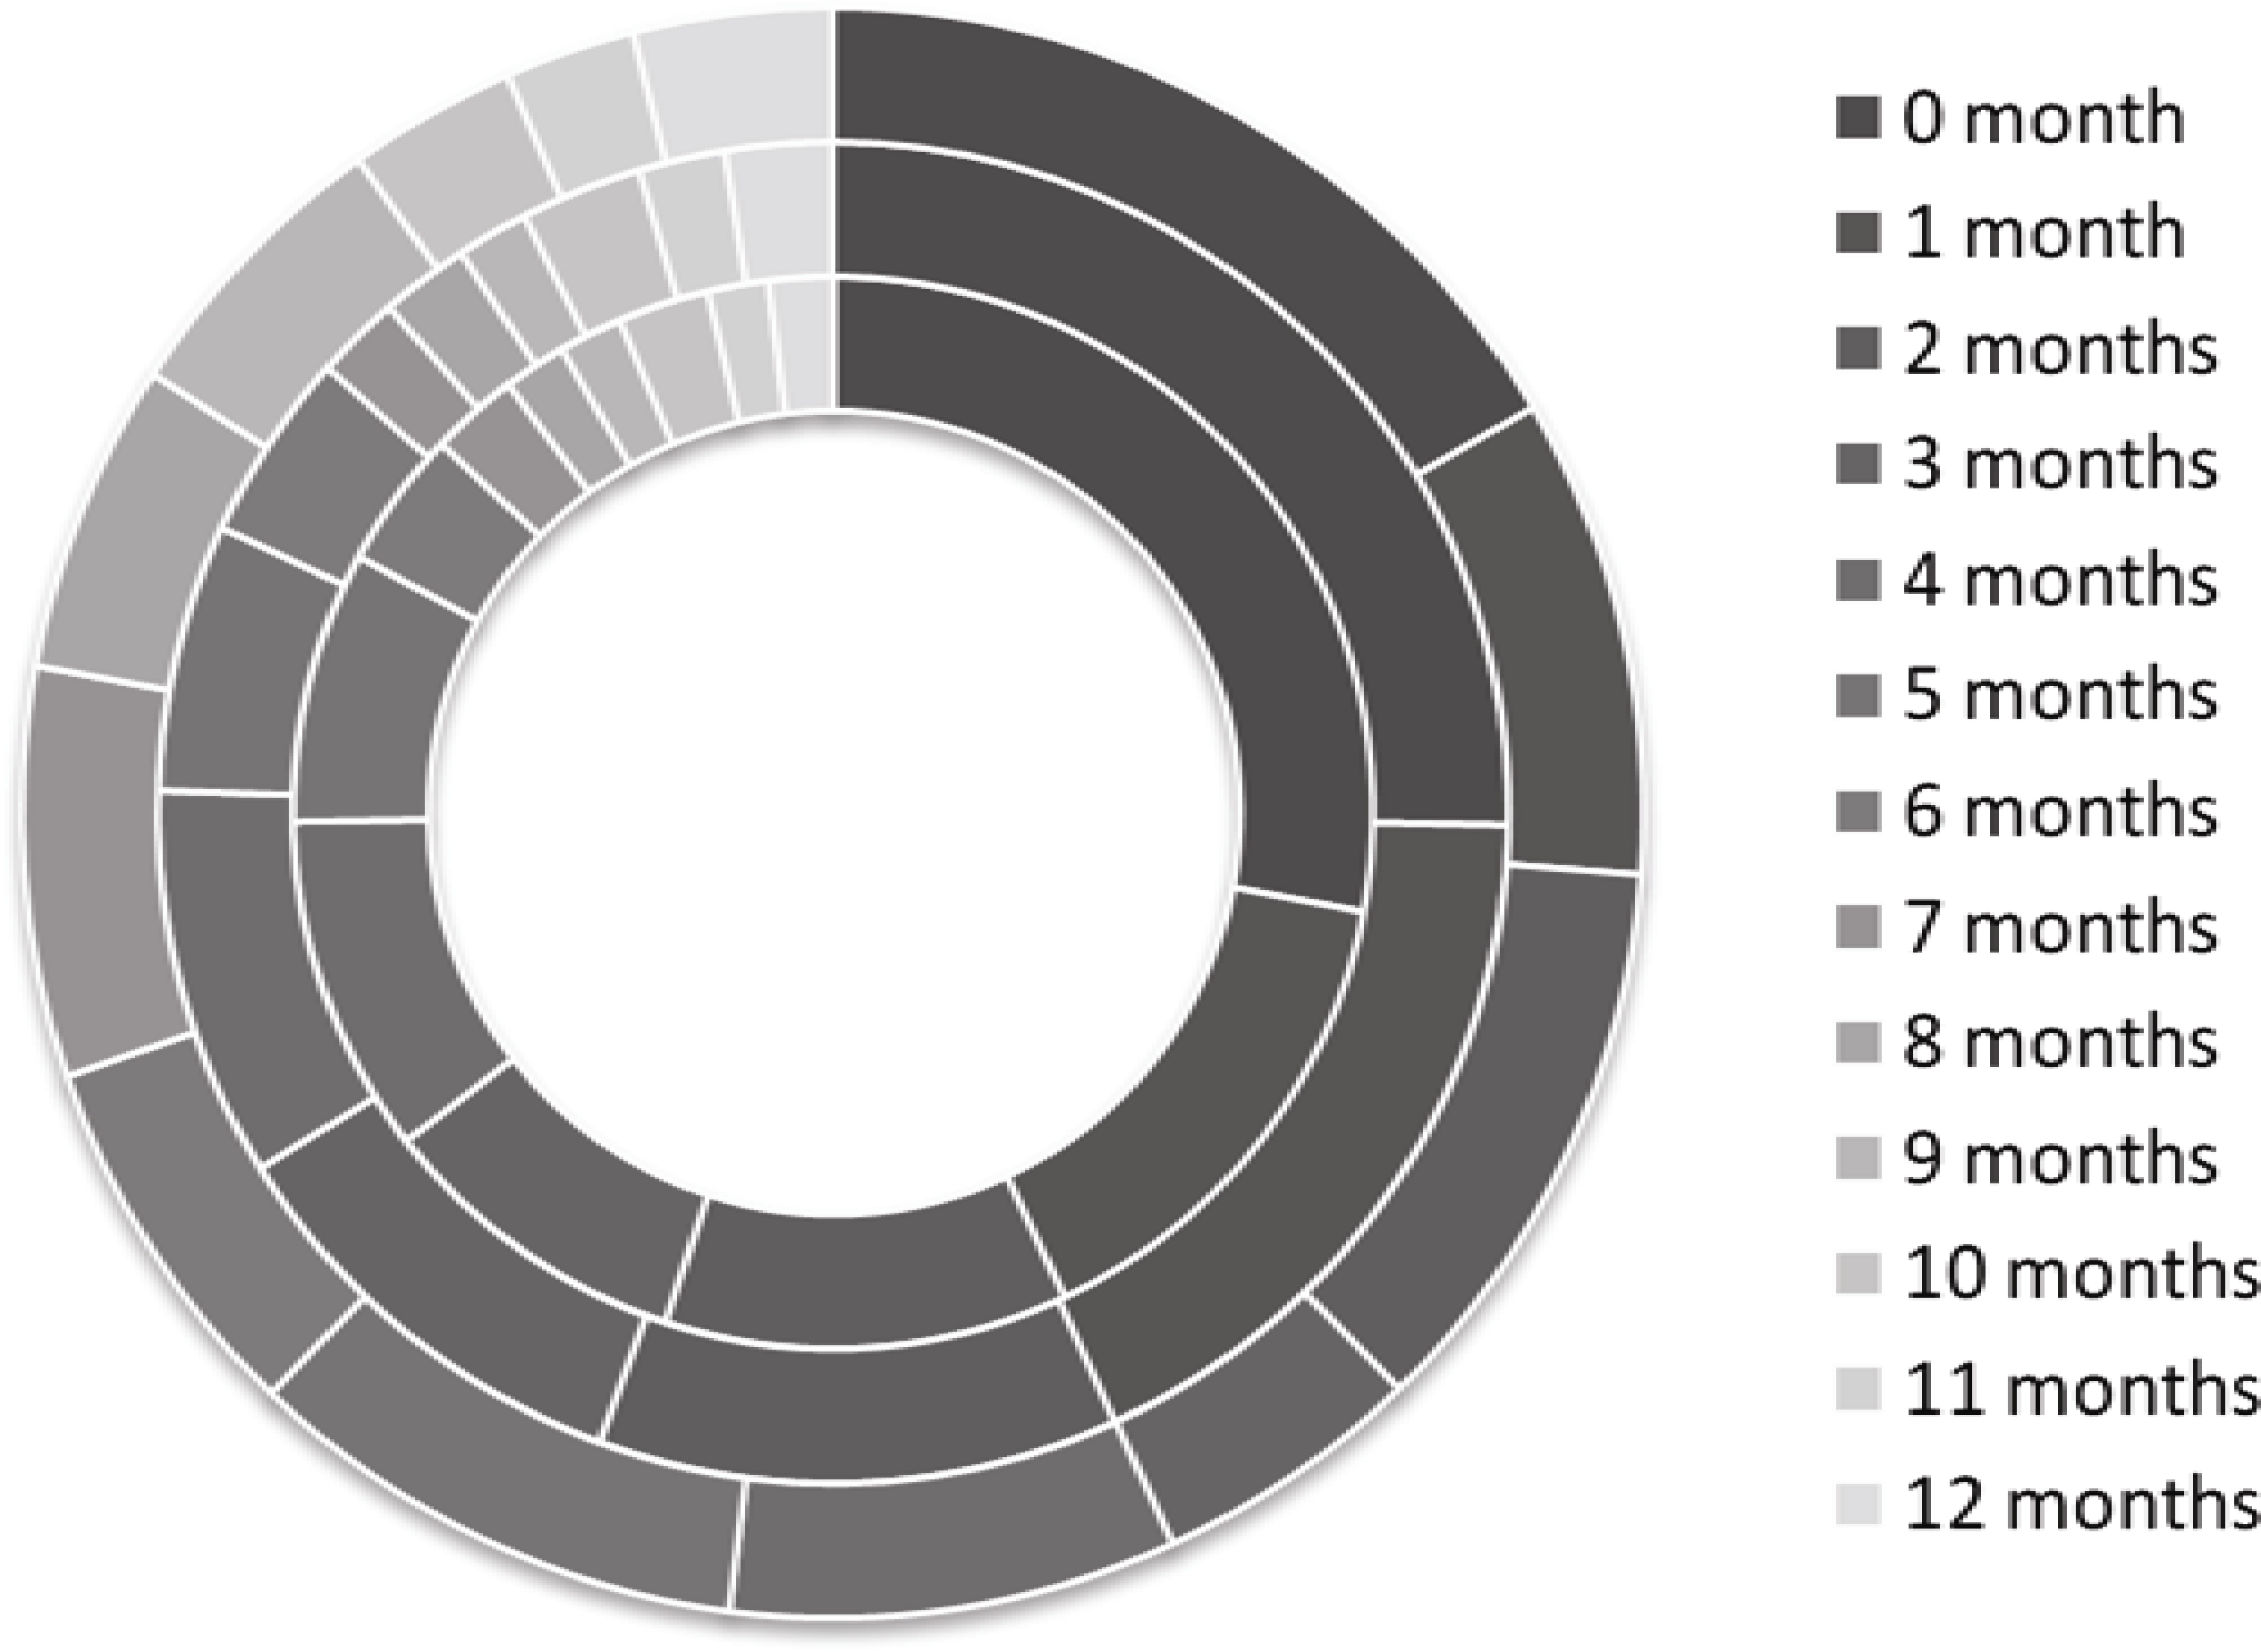
Predicting Western Pacific Subtropical High Using a Combined Tropical Indian Ocean Sea Surface Temperature Forecast |
|
WANG Li-Wei
, ZHU Jiang |
| Figure 2 Percentage distribution of each lagged month corresponding to the maximum correlation coefficient for Index I inner circle, Index II middle circle, and Index III exterior circle. The northern parts of the circles are the starting points at 0%; the percentage is increased equally in a clockwise direction. An integrated circumference implies 100%. |
| |