Predicting Western Pacific Subtropical High Using a Combined Tropical Indian Ocean Sea Surface Temperature Forecast
WANG Li-Wei1, 2, 3 , ZHENG Fei1  , ZHU Jiang
1
, ZHU Jiang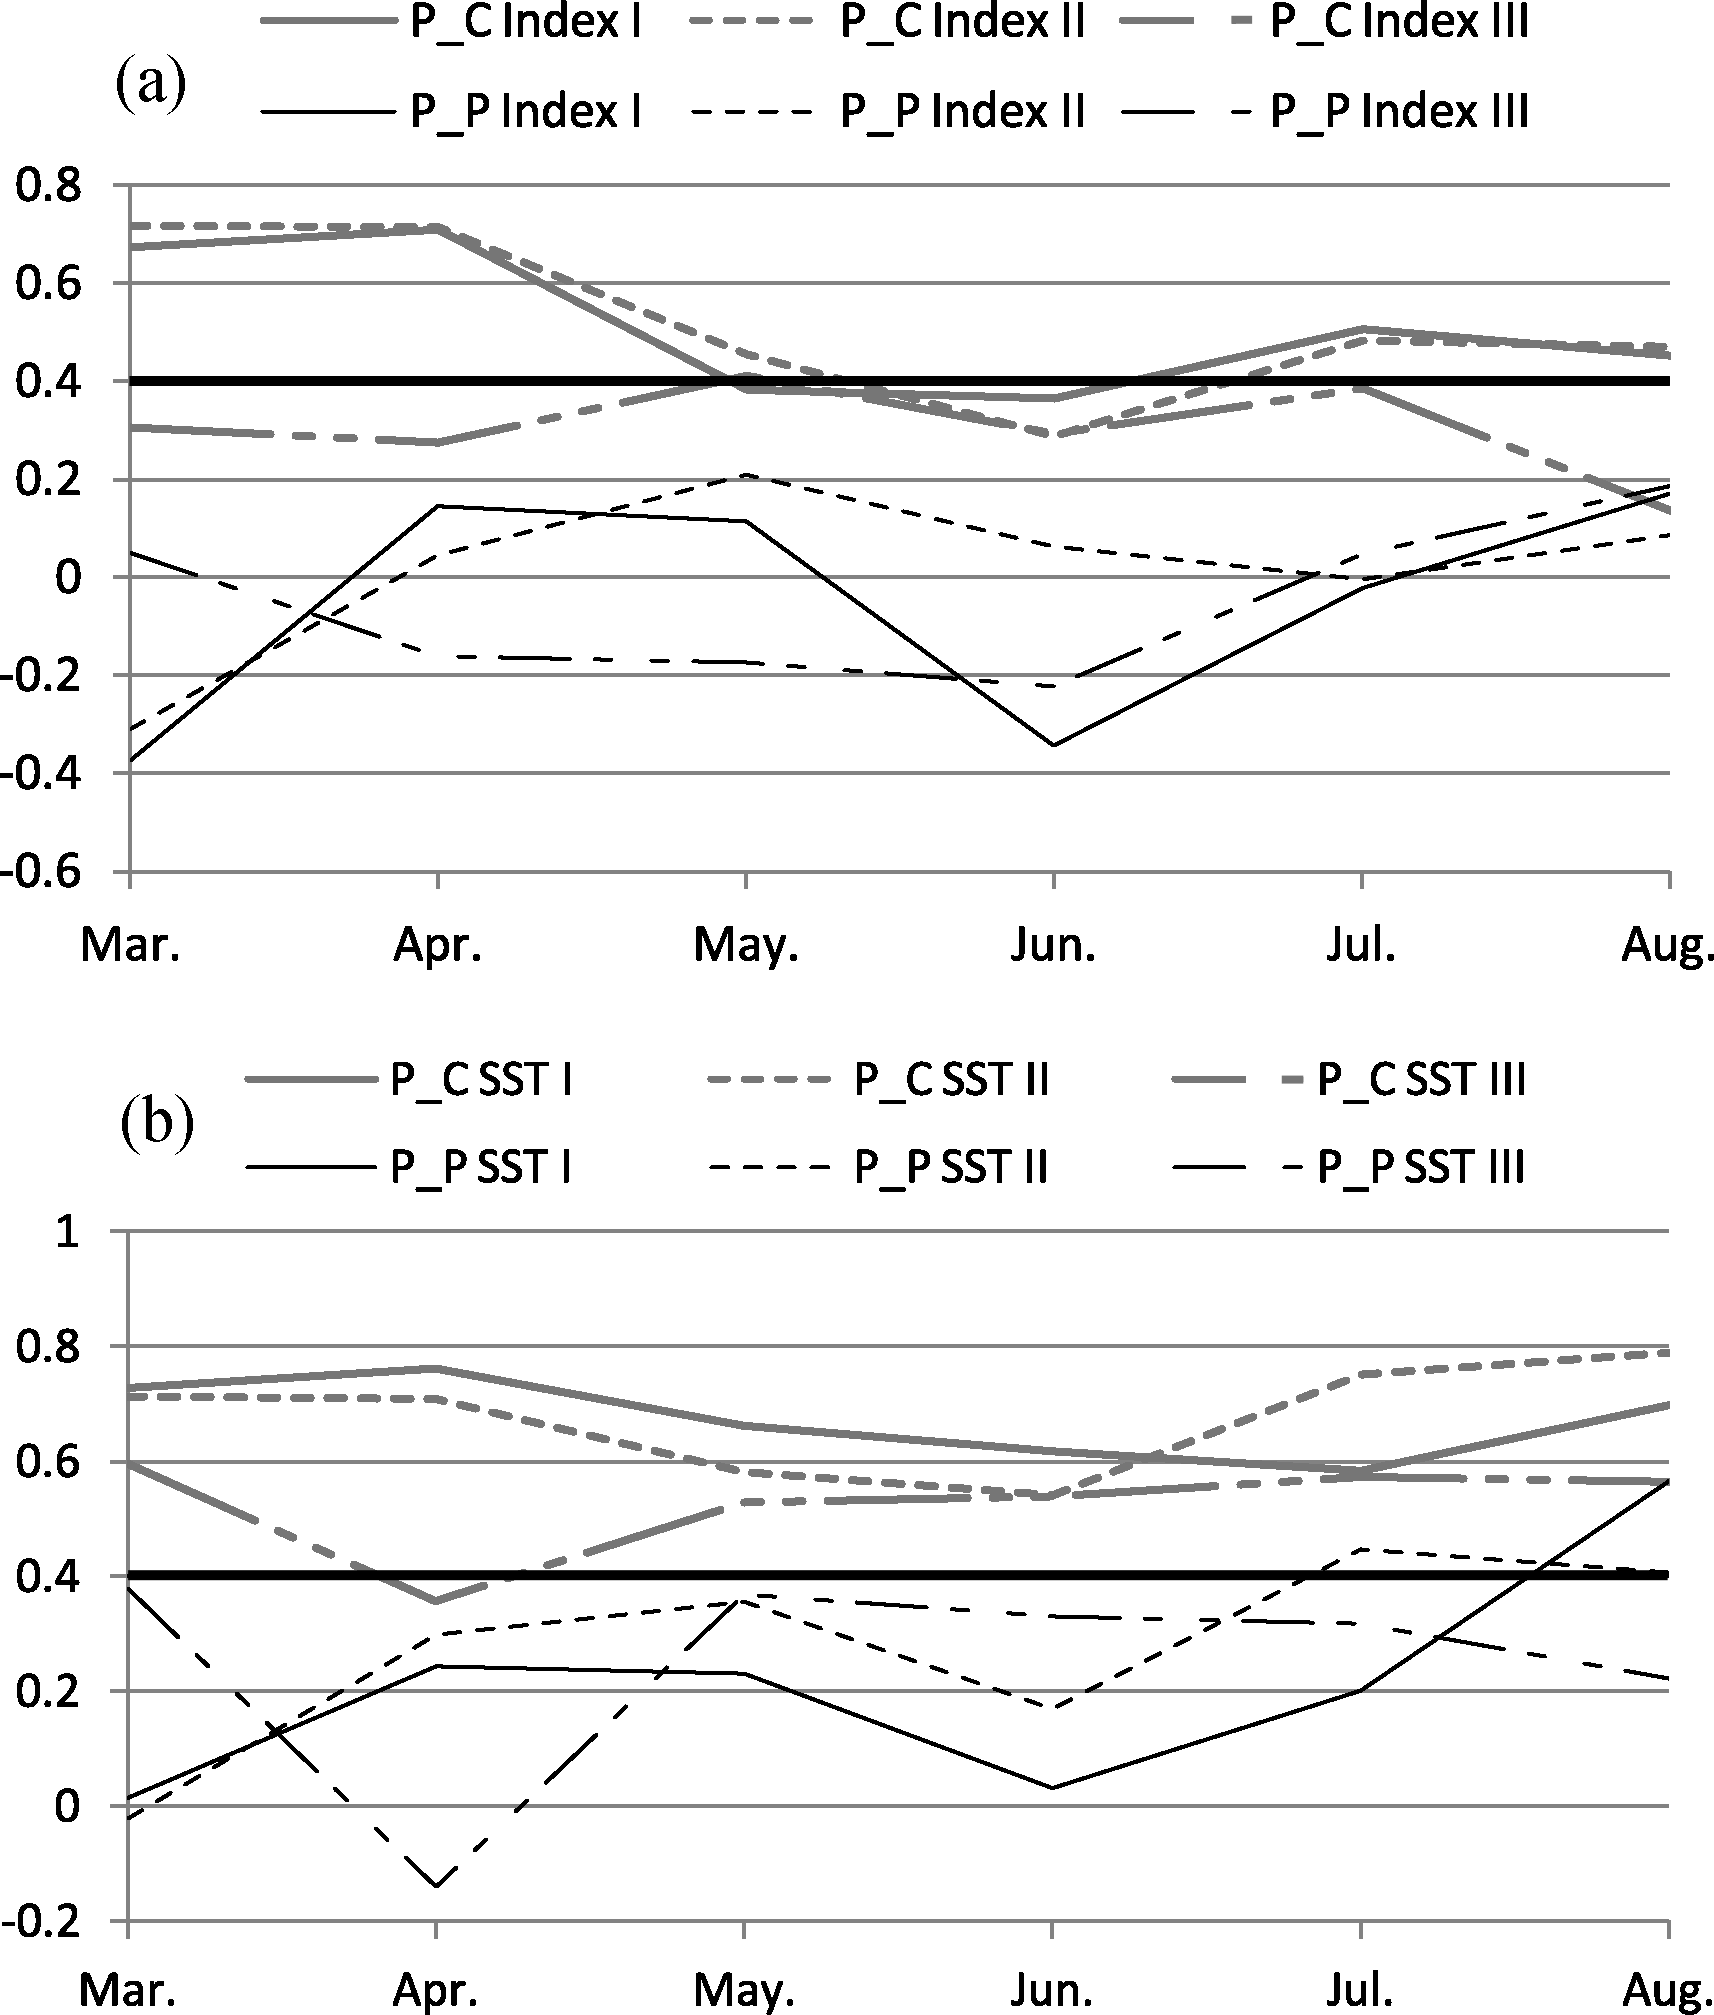
Predicting Western Pacific Subtropical High Using a Combined Tropical Indian Ocean Sea Surface Temperature Forecast |
|
WANG Li-Wei
, ZHU Jiang |
| Figure 4 a Correlation coefficients between the forecasted and observed Index I solid lines, Index II dashed lines, and Index III dot dashed lines from 1983-2008 as a function of calendar month. The combined forecasted SST predictions P_C are connected with gray bold lines, and the persisted SST predictions P_P are connected with black thin lines. The black bold line represents the 95% confidence levels 0.4. b is the same as a but for the skills of predicted SST corresponding to the WPSH prediction models. |
| |