
Uncertainty in Dust Budget over East Asia Simulated by WRF/Chem with Six Different Dust Emission Schemes
[WU Cheng-Lai1, 2 , LIN Zhao-Hui1  ]
]
]
|
|


In this study, the dependence of dust budgets on dust emission schemes is investigated through the simulation of dust storm events, which occurred during 14-25 March 2002, over East Asia, by the Weather Research and Forecasting with Chemistry (WRF/Chem) model coupled with six dust emission schemes. Generally, this model can reasonably reproduce the spatial distribution of surface dust concentration; however, the simulated total dust budget differs significantly with different emission schemes. Moreover, uncertainties in the simulated dust budget vary among regions. It is suggested that the dust emission scheme affects the regional dust budget directly through its impact on the total emitted dust amount; however, the inflow and outflow of dust aerosols simulated by different schemes within a region also depend on the geographical location of the dust emission region. Furthermore, the size distribution of dust particles for a specific dust emission scheme has proven to be important for dust budget calculation due to the dependence of dust deposition amount on dust size distribution.
The dust cycle has been regarded as an emerging core theme in Earth science due to the strong interaction of dust aerosols with climate and environmental processes ( Shao et al., 2011; Zhang et al., 2012). Although many previous studies have focused on the different components of the dust cycle such as dust emission and deposition ( Shao et al., 2003; Lei et al., 2005; Uno et al., 2006; Todd et al., 2008; Zhang et al., 2009), others have used climate models to investigate regional and global dust budgets (e.g., Huneeus et al., 2011). However, large diversity exists in simulated dust budgets as evidenced by a wide range of model simulation results. On the basis of 14 different models, global dust emission was estimated to be 514-4313 Tg yr-1, and simulated dust burden was 6.8- 29.5 Tg ( Huneeus et al., 2011).
Differences in simulated dust cycles among models can generally be attributed to variations in the model physical parameterization package such as land surface scheme, dust emission, and deposition scheme. However, such differences can also be ascribed to differences in model configuration, lateral meteorological forcing, and surface geographical information system (GIS) data (e.g., Uno et al., 2006; Huneeus et al., 2011). Thus, it has been suggested that more constrained model configurations should be designed to quantify the sensitivity of model estimates to individual factors ( Todd et al., 2008).
Therefore, the present study distinguishes and quantifies the effects of dust emission schemes on a model- simulated dust budget by adopting the Weather Research and Forecasting with Chemistry (WRF/Chem) model coupled with six different dust emission schemes to simulate dust storm events that occurred during 14-25 March 2002, over East Asia. In addition, differences in the simulated dust budget are analyzed, and their related uncertainties are discussed.
The model used in this study was WRF/Chem version 3.2 ( Grell et al., 2005), which introduced five new emission schemes as described by Kang et al. (2011). The model’s default dust emission scheme was adopted from the Global Ozone Chemistry Aerosol Radiation and Transport (GOCART) model ( Ginoux et al., 2001), and the five new dust emission schemes implemented in WRF/Chem were adopted from Marticorena and Bergametti (1995), Shao et al. (1996), Lu and Shao (1999), and Shao ( 2001, 2004), hereinafter referred to as MB95, Shao96, LS99, Shao01, and Shao04 schemes, respectively (Table 1).
Three dust episodes occurred during the simulation period on 14-17 March, 18-22 March, and 24-25 March; that occurring on 18-22 March was the most severe event recorded in 2002. The dust activity was first observed at approximately 0300 UTC 14 March, and WRF/Chem integration was initialized at 0000 UTC on the same day with initial dust concentration set to zero. The model domain covered East Asia (15-54°N, 70-150°E) with a horizontal resolution of 30 km. The initial and boundary conditions of the meteorological fields were interpolated from National Centers for Environmental Prediction/Final Analysis (NCEP/FNL) data obtained at 6-h intervals with 1°×1° resolution. Four-dimensional data assimilation (FDDA) was used during the simulation.
For comparison, visibility data from surface synoptic observations (SYNOP) recorded at 3-h intervals by the World Meteorological Organization (WMO) meteorological stations in East Asia were used to derive the total dust concentration, following the methodology reported by Shao et al. (2003).
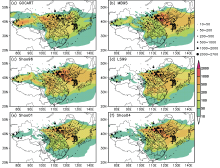
Figure 1 compares the spatial distribution of averaged surface dust concentrations of observation data and that simulated by WRF/Chem. In general, the model simulated spatial patterns of dust concentration with different dust emission schemes were quite similar with the observations. The observed high dust concentration regions in South Mongolia and northern China were effectively reproduced by all six schemes. In addition, the model was able to reasonably reproduce dust-affected areas in the middle and lower reaches of the Yangtze River, the East China Sea, and Japan.
| Table 1 Brief description of the six different dust emission schemes adopted in this study. |
 | Figure 1 Spatial distribution of simulated mean surface dust concentration (shading) for each scheme and the mean dust concentration (black solid circles) derived from visibility recorded by surface synoptic observation (SYNOP) stations over the 12-day simulation period of 14-25 March 2002 (units: μg m-3). |
However, considerable differences in dust concentration were found among the different schemes and observations. For observation, high dust concentration was observed in South Mongolia, central and eastern regions of Inner Mongolia, and northern China with a magnitude of 500-2000 μg m-3. As shown in Fig. 1, the magnitude of dust concentration simulated by the GOCART scheme was significantly weaker in the eastern parts of aforementioned regions with a magnitude of less than 200 μg m-3. In southwestern Xinjiang, dust concentrations simulated by GOCART, MB95, and Shao96 schemes were approximately 100-500 μg m-3, 50-100 μg m-3, and 50-200 μg m-3, respectively, which were lower than the observed concentration at 200-2000 μg m-3. Moreover, the dust concentration simulated by the three remaining schemes was approximately 10-50 μg m-3, which is substantially lower than the derived dust concentration.
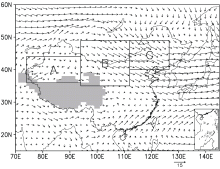
 | Figure 2 shows the total dust emission flux simulated by the different schemes. The simulated dust emissions were strongest in the Gobi desert in Mongolia, deserts and sandy regions in northern China, and the Taklimakan desert in northwestern China. Generally, differences in simulated dust emission flux were small in the Gobi and in the regions of western Inner Mongolia, Hetao area and, the Hexi Corridor.However, large differences in simulated dust emission flux were revealed in the Taklimakan, in the central- eastern region of Inner Mongolia, and in the southwestern region of northeastern China. The GOCART scheme produced dust emission over nearly the entire Taklimakan region, with a magnitude of dust emission flux of 0.1-20 g m-2. In the remaining five schemes, only scattered dust emissions were simulated in the Taklimakan with a dust emission flux of less than 10 g m-2, with the exception of a very local flux of 10-100 g m-2in the eastern part of the Taklimakan simulated by the Shao96 scheme. These results are generally consistent with the remarkable differences in simulated surface dust concentration reported in these regions (Fig. 1). The stronger and broader dust emissions in the Taklimakan simulated by the GOCART scheme can be attributed to the lower criteria value of threshold wind velocity used in the scheme, as discussed by Wu and Lin (2013).It should be noted that LS99, Shao01, and Shao04 schemes produced similar distributions of dust emission because these three schemes are based on the same physical mechanism of saltation bombardment but with different assumptions for vertical dust flux (Table 1). 3.2 Regional dust budgets over northern China and MongoliaAs shown in Fig. 3, three regions of potential dust sources have been identified for dust budget calculation. Region A (36-44°N, 74-94°E) represents western sources; Region B (35-49°N, 94-112°E) represents central sources including Mongolia and adjacent Inner Mongolia, in addition to the eastern region of northwestern China; and Region C (40-49°N, 112-126.5°E) represents eastern sources including North and northeastern China.Generally, dust budgets over a certain region consist of dust emission ( E), dust deposition ( D), inflow and outflow of dust particle transportation, and changes in dust loading ( C) integrated over the entire atmospheric column of the region. As suggested by the wind vector at 850 hPa (Fig. 3), dust is mainly transported westward in the lower troposphere in Region A but with eastward transportation in the eastern part of the region. In regions B and C, dust is mainly transported eastward and southward. Table 2 shows the dust budgets over the three regions, and the fractions of total dust emission for individual dust size bins are shown in Table 3.In Region A, the total dust emission simulated during the study period differed significantly among schemes, with maximum total emissions of 2.6 Tg and 2.76 Tg for GOCART and Shao96 schemes, respectively, and mini mum emissions of 0.23 Tg, 0.3 Tg, and 0.56 Tg for LS99, Shao01, and Shao04 schemes, respectively. During the simulation period, the total inflow of dust particles for most dust emission schemes was very low, with magnitudes less than 0.02 Tg. However, the GOCART scheme simulated an inflow of 0.12 Tg, which reflects transportation from a strong dust emission region in Kazakhstan northwest of Region A. |
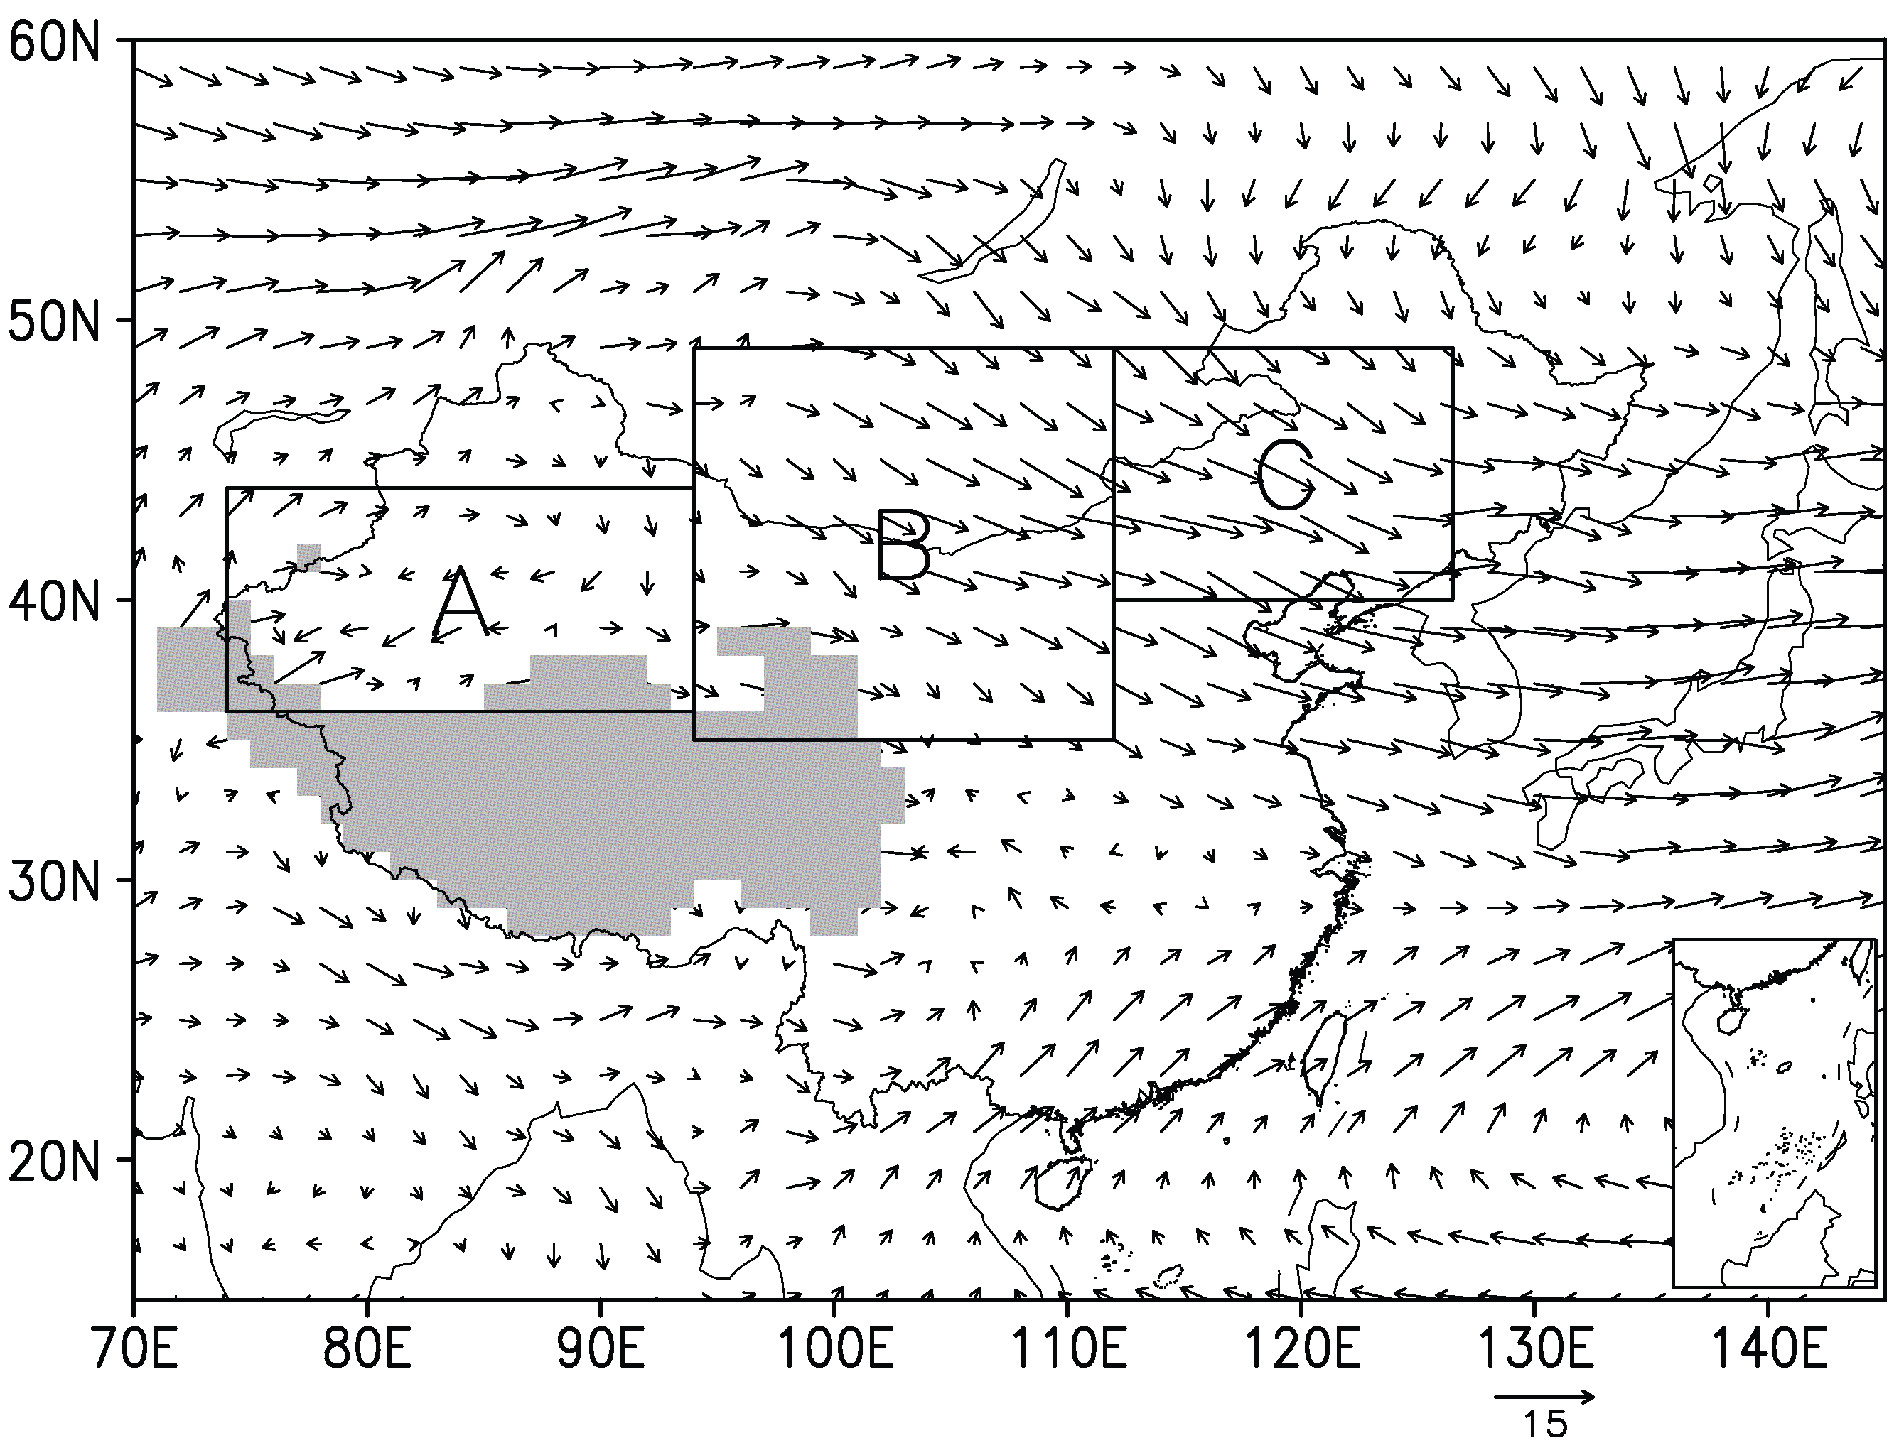 | Figure 3 Three specified regions for dust budget analysis as indicated by rectangles. Mean wind vector (m s-1) at 850 hPa obtained from National Centers for Environmental Prediction/Final Analysis (NCEP/FNL) is also shown. Gray shading represents areas with elevations higher than 3000 m. |
For the removal of dust aerosols, we defined deposition efficiency by the ratio of deposition to the sum of total emission and inflow. The absolute value of dust deposition in Region A varied significantly among schemes, ranging from 0.09 Tg for LS99 to 1.65 Tg for GOCART, with higher deposition simulated for schemes generating higher emissions. However, deposition efficiency did not differ significantly among schemes; values of approximately 55% were simulated for GOCART, Shao01, and Shao04, and those of approximately 40% were found for MB95, Shao96, and LS99. Such relatively small differences in deposition efficiency may be partially ascribed to the fact that same deposition scheme was used in the six different simulations. However, the relative high deposition efficiency could be attributed to topographic features. The Tarim Basin is surrounded by the Tian Mountains to the north and the Kunlun Mountains to the south; therefore, most of the emitted dust is not easily transported outside the region and thus remains in the area.
As indicated in Table 2, the outflow of dust aerosols outside of Region A was relatively larger for GOCART, MB95, and Shao96. This result can be attributed to the relatively strong dust emission in the eastern part of Region A (Fig. 2), which is favorable for eastward transportation of emitted dust aerosols.
| Table 2 Comparison of regional dust budgetsa (Tg) over 12-day simulation period of 14-25 March 2002. |
| Table 3 Fraction (%) of the total emission for individual dust size bins as calculated through simulation by the Weather Research and Forecasting with Chemistry (WRF/Chem) model with six different dust emission schemes. For comparison, the five dust size bins in the GOCART scheme were integrated as four bins, with bins 2 and 3 combined. These four bin sizes are 0.2-2 μm, 2-6 μm, 6-12 μm, and 12-20 μm. In other schemes, the four size bins are<2.5 μm, 2.5-5 μm, 5-10 μm, and 10-20 μm. |
For Shao01 and Shao04 schemes, however, the outflow was relatively low, which can be explained partially by the dust size distribution in Region A. As indicated in Table 3, emitted dust with particle sizes of 10-20 μm account for 66% and 73% of the total emission for Shao01 and Shao04, respectively, but only approximately 26% for GOCART, MB95, and Shao06. Generally, local deposition is easier for emitted dust with larger particle sizes, which can explain the comparatively larger deposition efficiency and weaker eastward transportation of dust particles in Region A.
In Region B, differences in simulated dust emission for different schemes were not as significant as those in Region A. Shao04 produced the largest dust emission with a magnitude of 16.67 Tg, and MB95 produced the weakest at 6.6 Tg. The total dust emission for the remaining four schemes was approximately 10 Tg during the simulation period. The main inflow of dust particles was from Region A, with magnitudes of approximately 0.12 Tg for LS99 and Shao01, and 0.9 Tg, 0.77 Tg, and 1.64 Tg for GOCART, MB95, and Shao96, respectively.
The absolute value of dust deposition varied between 1.22 Tg and 4.31 Tg for different schemes; however, the dust deposition efficiency in Region B was generally half that of Region A. A deposition efficiency of less than 25% was simulated for Shao01 and Shao04 and that of less than 20% was simulated for MB95, Shao96, and LS99. The deposition efficiency of 33.4% for GOCART was also significantly smaller than that of 60.7% simulated in Region A. Simulated dust emission patterns were quite similar for LS99, Shao01, and Shao04 in Region B (Fig. 2). The deposition efficiency was very close between Shao01 and Shao04; however, that for LS99 was nearly half the efficiency for Shao01. The fraction for larger dust particles with diameters of 10-20 μm was approximately 57% for Shao01 and Shao04 but only 9.2% for LS99 (Table 3), which can explain the difference in deposition efficiency between LS99 and Shao01.
The transportation of dust aerosols outside of Region B ranged from 6.12 Tg to 12.59 Tg, which is several times larger than total dust deposition. This result is closely related to the strong northwest wind as simulated in Region B, which is favorable for eastward and southward transport of dust particles (Fig. 3).
In Region C, total dust emission differed significantly among schemes, with high total emissions of 21.9 Tg and 19.04 Tg simulated by MB95 and Shao96, respectively, and lowest of 2.66 Tg by GOCART. Because Region C is located downstream from Region B, the inflow of dust from Region B was strong in this region, which is comparable to the total emission results except for that simulated by MB95 and Shao96. For GOCART and LS99, the magnitudes of inflow were 3.49 Tg and 6.94 Tg respectively, which are even larger than the corresponding total emission in this region.
The absolute value of dust deposition in Region C varied among emission schemes and ranged from 1.15 Tg for GOCART to 6.25 Tg for Shao04. However, the deposition efficiency was quite similar between regions B and C with the exception of the GOCART scheme, in which the value decreased significantly from 33.4% in Region B to 18.7% in Region C.
As indicated in Table 2, the outflow was larger than the total emission for nearly all emission schemes except for MB95, which is attributed to the significant dust inflow from outside Region C. For example, the total outflow for Shao04 was 15.02 Tg, but the total dust emission was only 11.47 Tg because the total inflow of dust reached 9.83 Tg. Even for MB95, the outflow was 21.1 Tg, which is slightly smaller than the total emission of 21.9 Tg.
In summary, significant differences in simulated dust budgets among the six different dust emission schemes were found in the three regions categorized in this study. Variation in dust budget was significant among the schemes and depended on region. A more than 10-fold difference in total dust emission and deposition was detected in Region A; however, a less than 3-fold difference in simulated total dust emission was detected in Region B. These results may be attributed to variations in emission schemes and regions.
In this study, the WRF/Chem model coupled with six dust emission schemes was applied to simulate dust storm events that occurred during 14-25 March 2002, over East Asia. The dependence of dust budgets on the dust emission schemes was investigated, and the uncertainties related to dust budget estimation were discussed.
Comparisons between model simulations and observation data revealed that the WRF/Chem model with the six different emission schemes all reasonably reproduced the spatial distributions of surface dust concentration. However, the simulated total dust budgets differed significantly among schemes, and the uncertainty varied among regions.
The total dust emission simulated by WRF/Chem differed by a factor of 10, which is directly related to the different parameterization schemes of dust emission processes. However, the configuration of dust emission schemes, such as the size distribution of dust particles, is important for dust budget calculation because the amount of dust deposition depends strongly on dust size distribution. This finding is illustrated by the difference in dust deposition between Shao04 and LS99 schemes in regions A and B.
Furthermore, calculation of regional dust budgets must consider indirect effects of dust emission schemes. The spatial distribution of dust emission and dust concentration differed among schemes, which directly led to inflow and outflow differences in dust particles. For example, the significant inflow of dust aerosol from outside of Region A is related to dust emission over Kazakhstan northwest of the region. Sensitivities of dust budget simulation to emission schemes also differed among regions, with larger than 10-fold and smaller than 3-fold differences in dust emission in regions A and B, respectively. These results suggest that large uncertainties remain in the currently used dust emission schemes. Therefore, additional research is needed for the development and improvement of new dust emission schemes.
Moreover, it should be noted that the dust budgets were calculated in this paper through 12-day integration by using the WRF model. Longer model integration should be designed in future studies.
| 1 |
|
| 2 |
|
| 3 |
|
| 4 |
|
| 5 |
|
| 6 |
|
| 7 |
|
| 8 |
|
| 9 |
|
| 10 |
|
| 11 |
|
| 12 |
|
| 13 |
|
| 14 |
|
| 15 |
|
| 16 |
|
| 17 |
|