Intercomparison of Surface Radiative Fluxes in the Arctic Ocean
[SHI Xiao-Xu1, 2  , LIU Ji-Ping
1 ]
, LIU Ji-Ping|
|


Recent satellite data analysis has provided improved data sets relevant to the surface energy budget in the Arctic Ocean. In this paper, surface radiation properties in the Arctic Ocean obtained from the Surface Radiation Budget (SRB3.0) and the International Satellite Cloud Climatology Project (ISCCP-FD) during 1984-2007 are analyzed and compared. Our analysis suggests that these datasets show encouraging agreement in basin-wide averaged seasonal cycle and spatial distribution of surface albedo; net surface shortwave and all-wave radiative fluxes; and shortwave, longwave, and all-wave cloud radiative forcings. However, a systematic large discrepancy is detected for the net surface longwave radiative flux between the two data sets at a magnitude of ~ 23 W m-2, which is primarily attributed to significant differences in surface temperature, particularly from April to June. Moreover, the largest difference in surface shortwave and all-wave cloud radiative forcings between the two data sets is apparent in early June at a magnitude of 30 W m-2.
Satellite observations show that Arctic sea ice, one of the most visible indicators of climate change, has decreased in all months since the late 1970s, small in winter and large in late summer and early fall. The energy balance in the ice-covered Arctic Ocean is controlled by radiative energy loss and advective transport of warmer and moister air from lower latitudes. The formation of sea ice causes a rapid drop in surface temperatures to that below the freezing point and a reduction in sensible/latent heat loss from the ocean. The reduced surface heat loss is partly offset by the reduction of solar radiation due to higher surface albedo. However, clouds in the Arctic have a net heating effect on the surface. For example, Ikeda et al. (2003) suggested that the thermodynamic effect induced by changes in cloud coverage in the Arctic is comparable to the albedo reduction, which has contributed in part to the decline in Arctic sea ice during the past several decades. Reduced cloudiness and enhanced downward solar radiation have also contributed to the dramatic Arctic sea ice loss in 2007 ( Kay et al., 2008). Thus, the formation and melting of sea ice in the Arctic Ocean are sensitive to the detailed surface radiative properties and resultant radiative exchanges.
Most previous studies have evaluated the current states of surface radiative fluxes in tropical and subtropical oceans rather than those in the Arctic Ocean. For example, Serreze et al. (1998) compared climatological radiative fluxes of the National Centers for Environmental Prediction/National Center for Atmospheric Research (NCEP/NCAR) reanalysis and the International Satellite Cloud Climatology Project stage C2 monthly cloud products in hierarchical data format (ISCCP-C2) by using climatology compiled on the basis of drifting ice and land stations. They determined that both data sets captured 50%-60% of the observed spatial variance in radiation during most months. In addition, Wang and Key (2005) documented spatial and temporal characteristics of Arctic surface albedo, clouds, and radiation recorded during 1982-99 by using the Advanced Very High Resolution Radiometer (AVHRR) Polar Pathfinder (APP) dataset. Moreover, Liu et al. (2005) evaluated surface radiative flux data sets in the Arctic Ocean with a focus on high temporal resolution at both local and regional scales by using two numerical weather prediction reanalysis datasets and two satellite-based products for the Surface Heat Budget of the Arctic Ocean (SHEBA) year (the year 1997-98 for the SHEBA field experiment). They reported substantial discrepancies between these data sets and the SHEBA field measurements.
Since these results have been published, recent satellite data analysis projects have produced new versions of data sets. In this paper, we build on previous studies to assess the degrees of consistency and discrepancy of surface radiative properties in the Arctic Ocean for the two recently improved satellite-based products.
The two satellite-based surface radiative products used in this study include a new version of surface radiative properties developed by the National Aeronautics and Space Administration-Global Energy and Water Cycle Experiment surface radiation budget project, hereafter referred to as SRB3.0, and an improved version of surface radiative fluxes from the International Satellite Cloud Climatology Project, hereafter referred to as ISCCP-FD.
The shortwave and longwave data of SRB3.0 are derived from two sets of algorithms including primary and Langley parameterized algorithms. The primary shortwave and longwave algorithms were adapted from Pinker and Laszlo (1992) and Fu et al. (1997), respectively. The Langley parameterized shortwave and longwave algorithms were developed by Gupta et al. ( 1992, 2001). The SRB3.0 data is produced by using cloud parameters from the ISCCP product ( Rossow and Schiffer, 1991), meteorological inputs from Global Modeling and Assimilation Office (GMAO) reanalysis, and radiative transfer algorithms of the GMAO. SRB3.0 provided daily and monthly surface radiative parameters from July 1983 to December 2007 at a spatial resolution of 1°.
Improved versions of shortwave and longwave radiative fluxes have been calculated at the surface by using a complete radiative transfer model from the Goddard Institute for Space Studies General Circulation Model with improved observations of the physical properties of the surface based on the ISCCP product ( Zhang et al., 2004). The ISCCP-FD provides three-hourly and monthly surface radiative parameters from July 1983 to December 2007 on a 280-km equal-area grid.
Because the ISCCP-FD and SRB3.0 have different spatial resolutions, we interpolate the ISCCP-FD data to the same spatial resolution as that of the SRB3.0 before performing the comparison. Because the focus of the present study is surface radiation properties over the Arctic Ocean, the domain selected encompasses oceans north of 65°N.
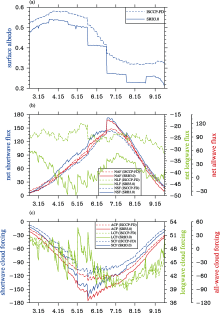
Figure 1a shows variations in daily surface albedo averaged over the Arctic Ocean. It should be noted that the mean value is a weighted area average computed by considering the area of each grid cell. The SRB3.0 reveals that the albedo reaches its peak of ~ 0.54 at the end of March before decreasing to ~ 0.22 in early fall associated with the melting of sea ice and increase in open water. The ISCCP-FD shows similar seasonal variations with the exception of a larger albedo of ~ 0.1 than that of the SRB3.0, particularly during the summer melting period. Interestingly, neither the SRB3.0 nor the ISCCP-FD shows an increase in albedo from mid-September associated with fall freeze-up, as suggested by in-situ measurements; SHEBA observations show that average albedos return to their spring values by the end of September ( Perovich et al., 2002).
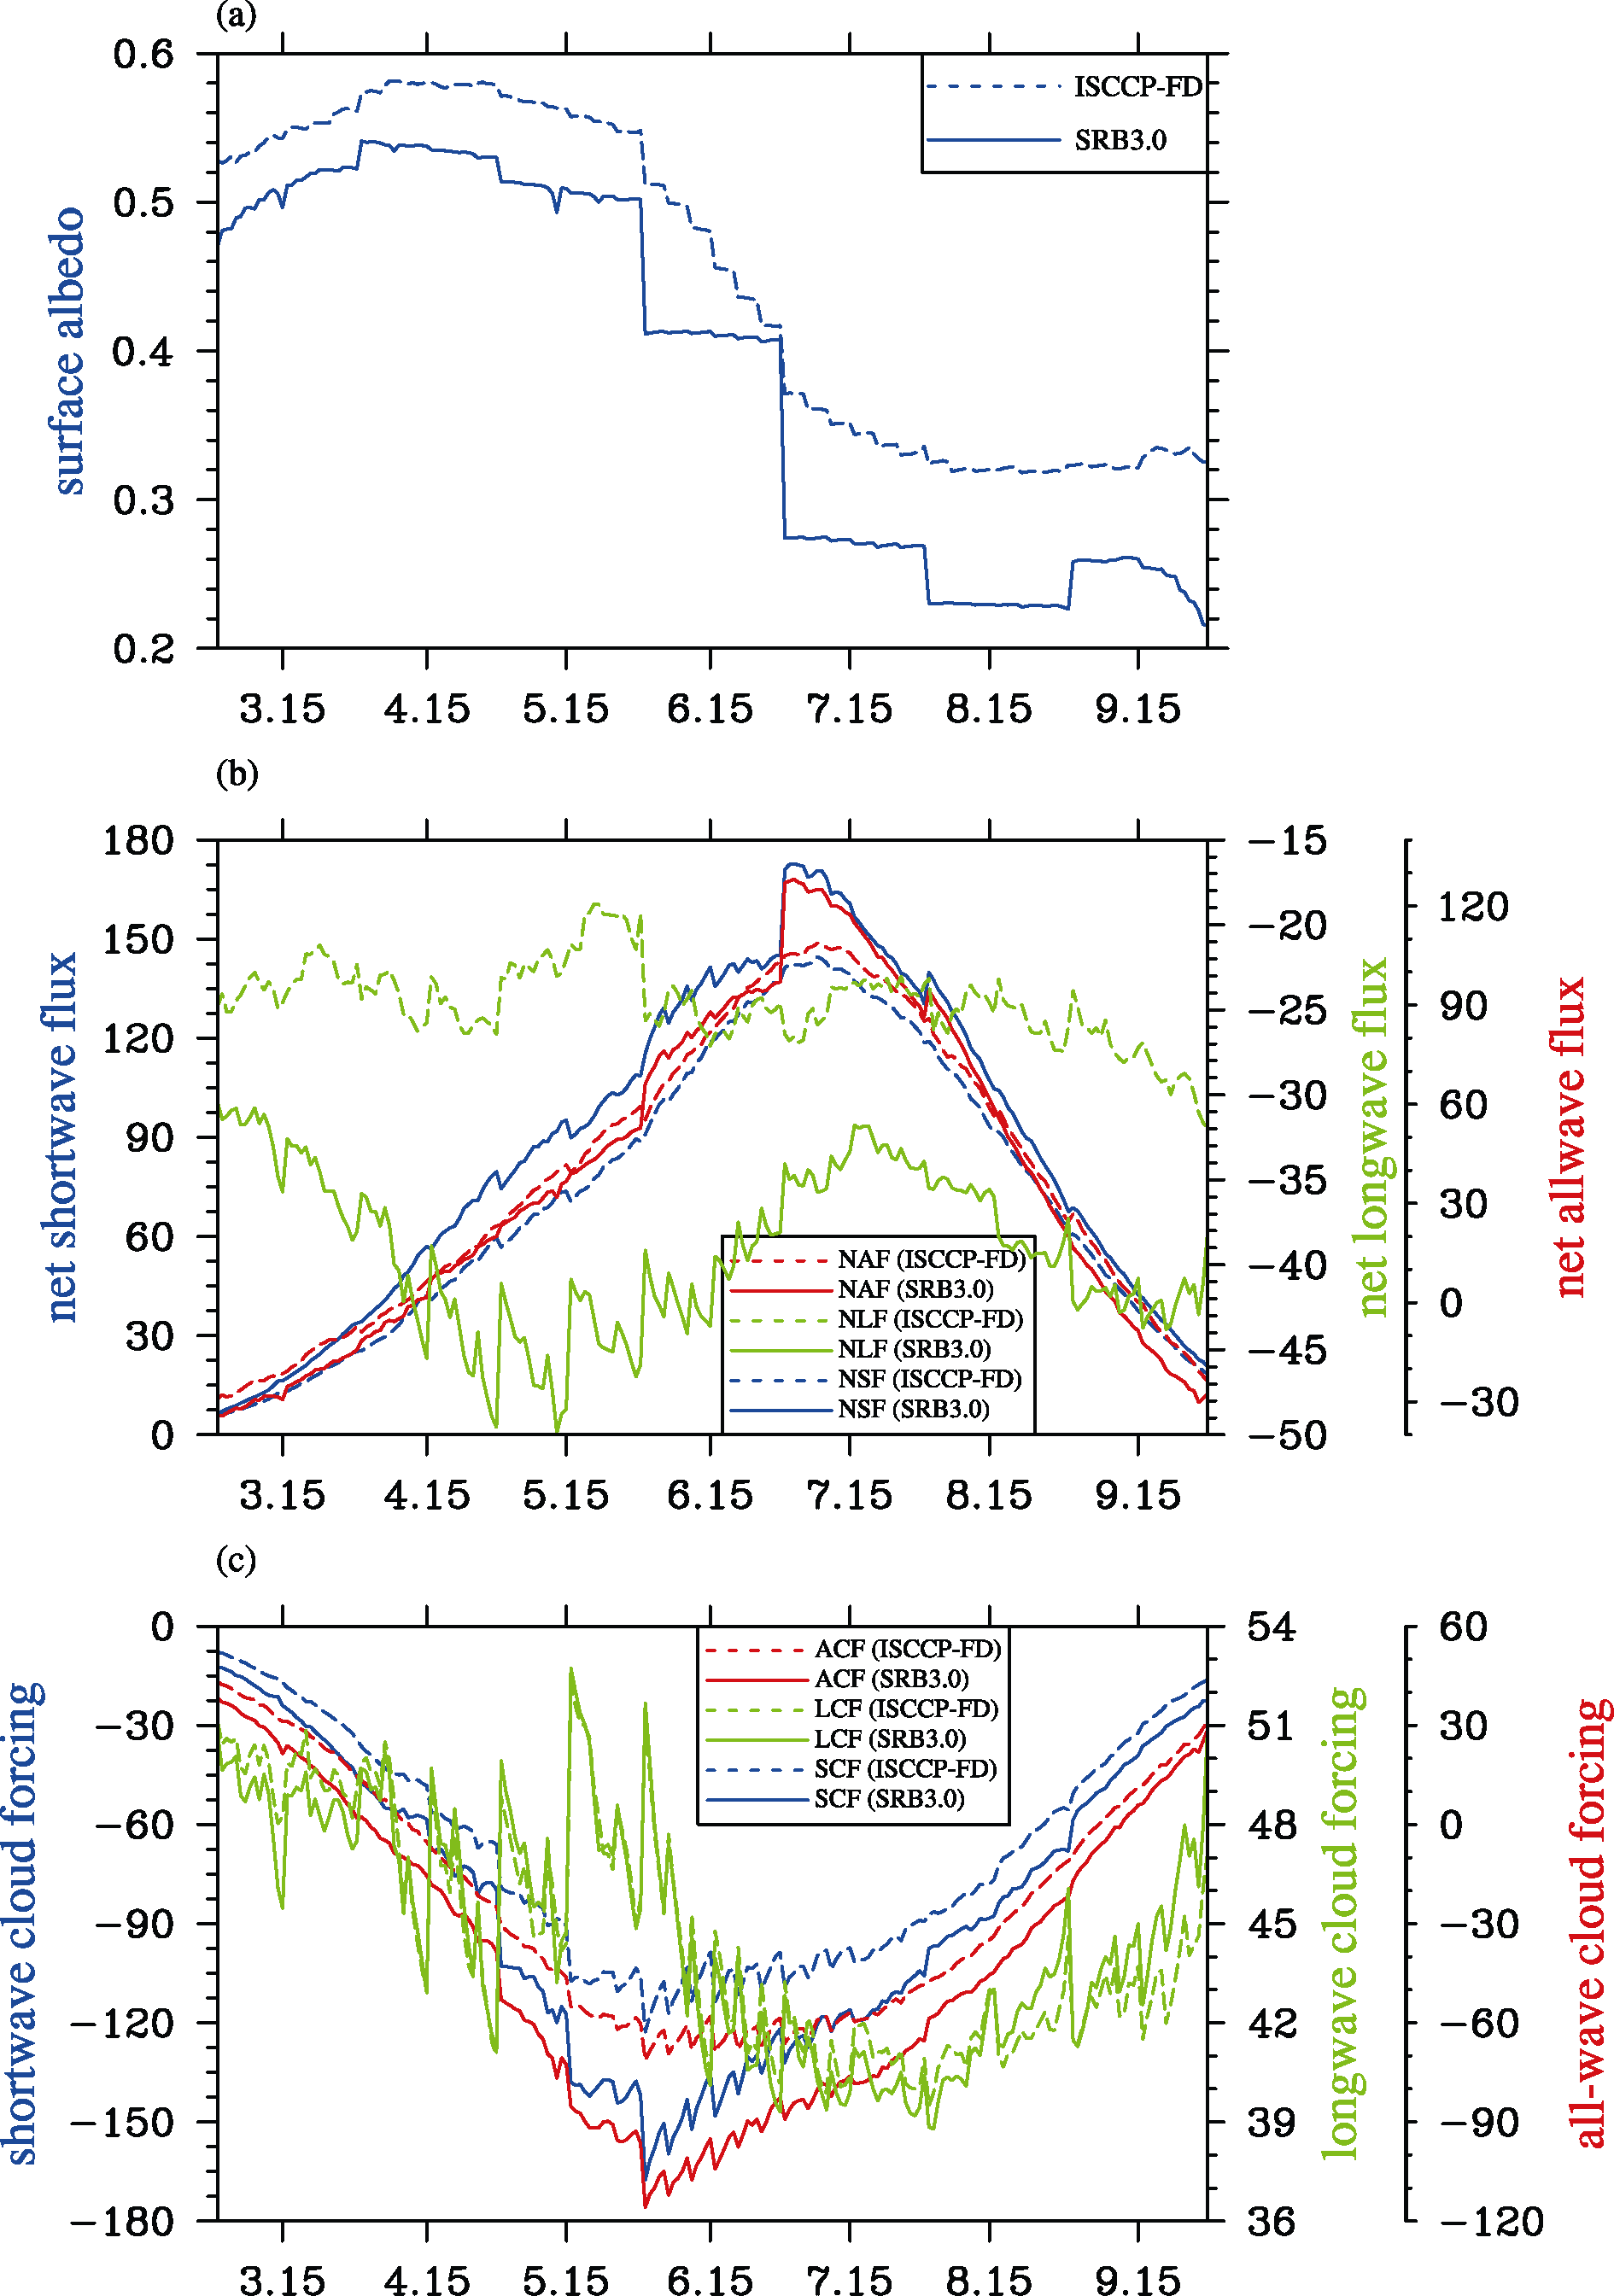 | Figure 1 (a) Seasonal cycle of averaged surface albedo in the Arctic Ocean north of 65°N from 1 March to 31 September for SRB3.0 (solid line) and ISCCP-FD (dashed line); (b) Seasonal cycle of averaged net shortwave flux, net longwave flux, and net all-wave flux from 1 March to 31 September for SRB3.0 (solid lines) and ISCCP-FD (dashed lines) for SRB3.0 (solid line) and ISCCP-FD (dash line); (c) same as (b) but for net shortwave cloud forcing, net longwave cloud forcing, and net all-wave cloud forcing. |
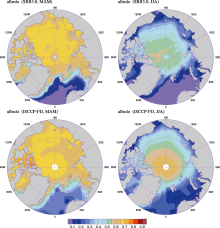
Figure 2 shows the spatial distribution of surface albedo. The SRB3.0 exhibits a decrease in albedo from spring to summer. The albedo in most of the Arctic basin is within 0.6-0.7 in spring and decreases to 0.5-0.6 in the central Arctic basin and 0.2-0.4 in the periphery of the Arctic basin, which extends from north of Alaska to north of western Siberia in summer. The strongest albedo gradient occurs at the sea ice edge zones. The ISCCP-FD shows good agreement with the SRB3.0, although albedos in the central Arctic basin and northern Atlantic Ocean are relatively higher by ~ 0.1 than those of the SRB3.0 in summer.
 | Figure 2 Spatial distribution of surface albedo in the Arctic Ocean in spring (March-May) and summer (June-August) for SRB3.0 and ISCCP-FD. |
Figure 1b shows variations in daily net shortwave, net longwave, and net all-wave radiative fluxes over the Arctic Ocean, hereafter referred to respectively as NSF, NLF, and NAF. As expected, the SRB3.0 shows a steady increase in net shortwave radiation from March, reaching its peak at ~ 173 W m-2 (positive downward, similarly hereinafter) in early July, and decreasing to ~ 20 W m-2 by the end of September. In addition, the largest loss of longwave radiative energy from the surface, ~ 50 W m-2, occurs in early May. This result occurs approximately one month later than that reported by Wang and Key (2005), who used the AVHRR APP data set to examine Arctic surface radiation properties in the Arctic Ocean and surrounding land masses. The net all-wave radiation, which is the sum of net shortwave and longwave radiation, is clearly dominated by the net shortwave radiation.
A similar seasonal cycle of NSF and NAF is observed in the ISCCP-FD, although the magnitudes are relatively smaller than those of the SRB3.0 with the largest difference occurring in early July at magnitudes of ~ 31 W m-2 and ~ 23 W m-2, respectively. However, distinct differences are apparent in seasonal variations of NLF between the ISCCP-FD and SRB3.0. The ISCCP-FD dose not show an obvious seasonal cycle, and the NLF oscillates at ~ -25 W m-2. Moreover, the NLF of the ISCCP-FD is ~ 20 W m-2 larger than that of the SRB3.0, particularly from April to June, which is even comparable to the magnitude of the ISCCP-FD. Such differences occurs mainly because although the downward longwave radiative flux (DLF) of the ISCCP-FD is comparable to that of the SRB3.0, the upward longwave radiative flux (ULF) is larger (not shown; NLF is defined as DLF minus ULF). Further analysis suggests that the surface temperature of the ISCCP-FD is ~ 5°C warmer than that of the SRB3.0 from April to June (not shown), which results in a larger ULF during these months.
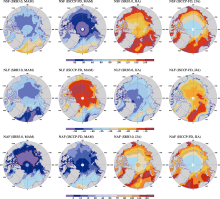
The spatial distribution of NSF, NLF, and NAF is shown in Fig. 3. In general, the SRB3.0 exhibits a poleward decrease in NSF, with a minimum value of 20-40 W m-2 in spring and 80-100 W m-2 in summer towards the western Arctic. The largest loss of longwave radiative energy, -45 - -40 W m-2, is situated between the northern Beaufort and eastern Siberia seas in spring and in the Canadian archipelago and Greenland Sea in summer.
The spatial pattern of the ISCCP-FD NSF resembles that of the SRB3.0, although the ISCCP-FD shows a more zonal poleward decrease in NSF. However, the spatial pattern of the ISCCP-FD NLF differs from that of the SRB3.0. The ISCCP-FD shows the smallest loss of longwave radiative energy in the Arctic Ocean in spring at -15 - -10 W m-2 and summer at -30 - -25 W m-2, which is consistent with the aforementioned daily analysis. In addition, the spatial distributions of NAF of the SRB3.0 and ISCCP-FD are similar to those of the NSF due to the dominant control of the latter.
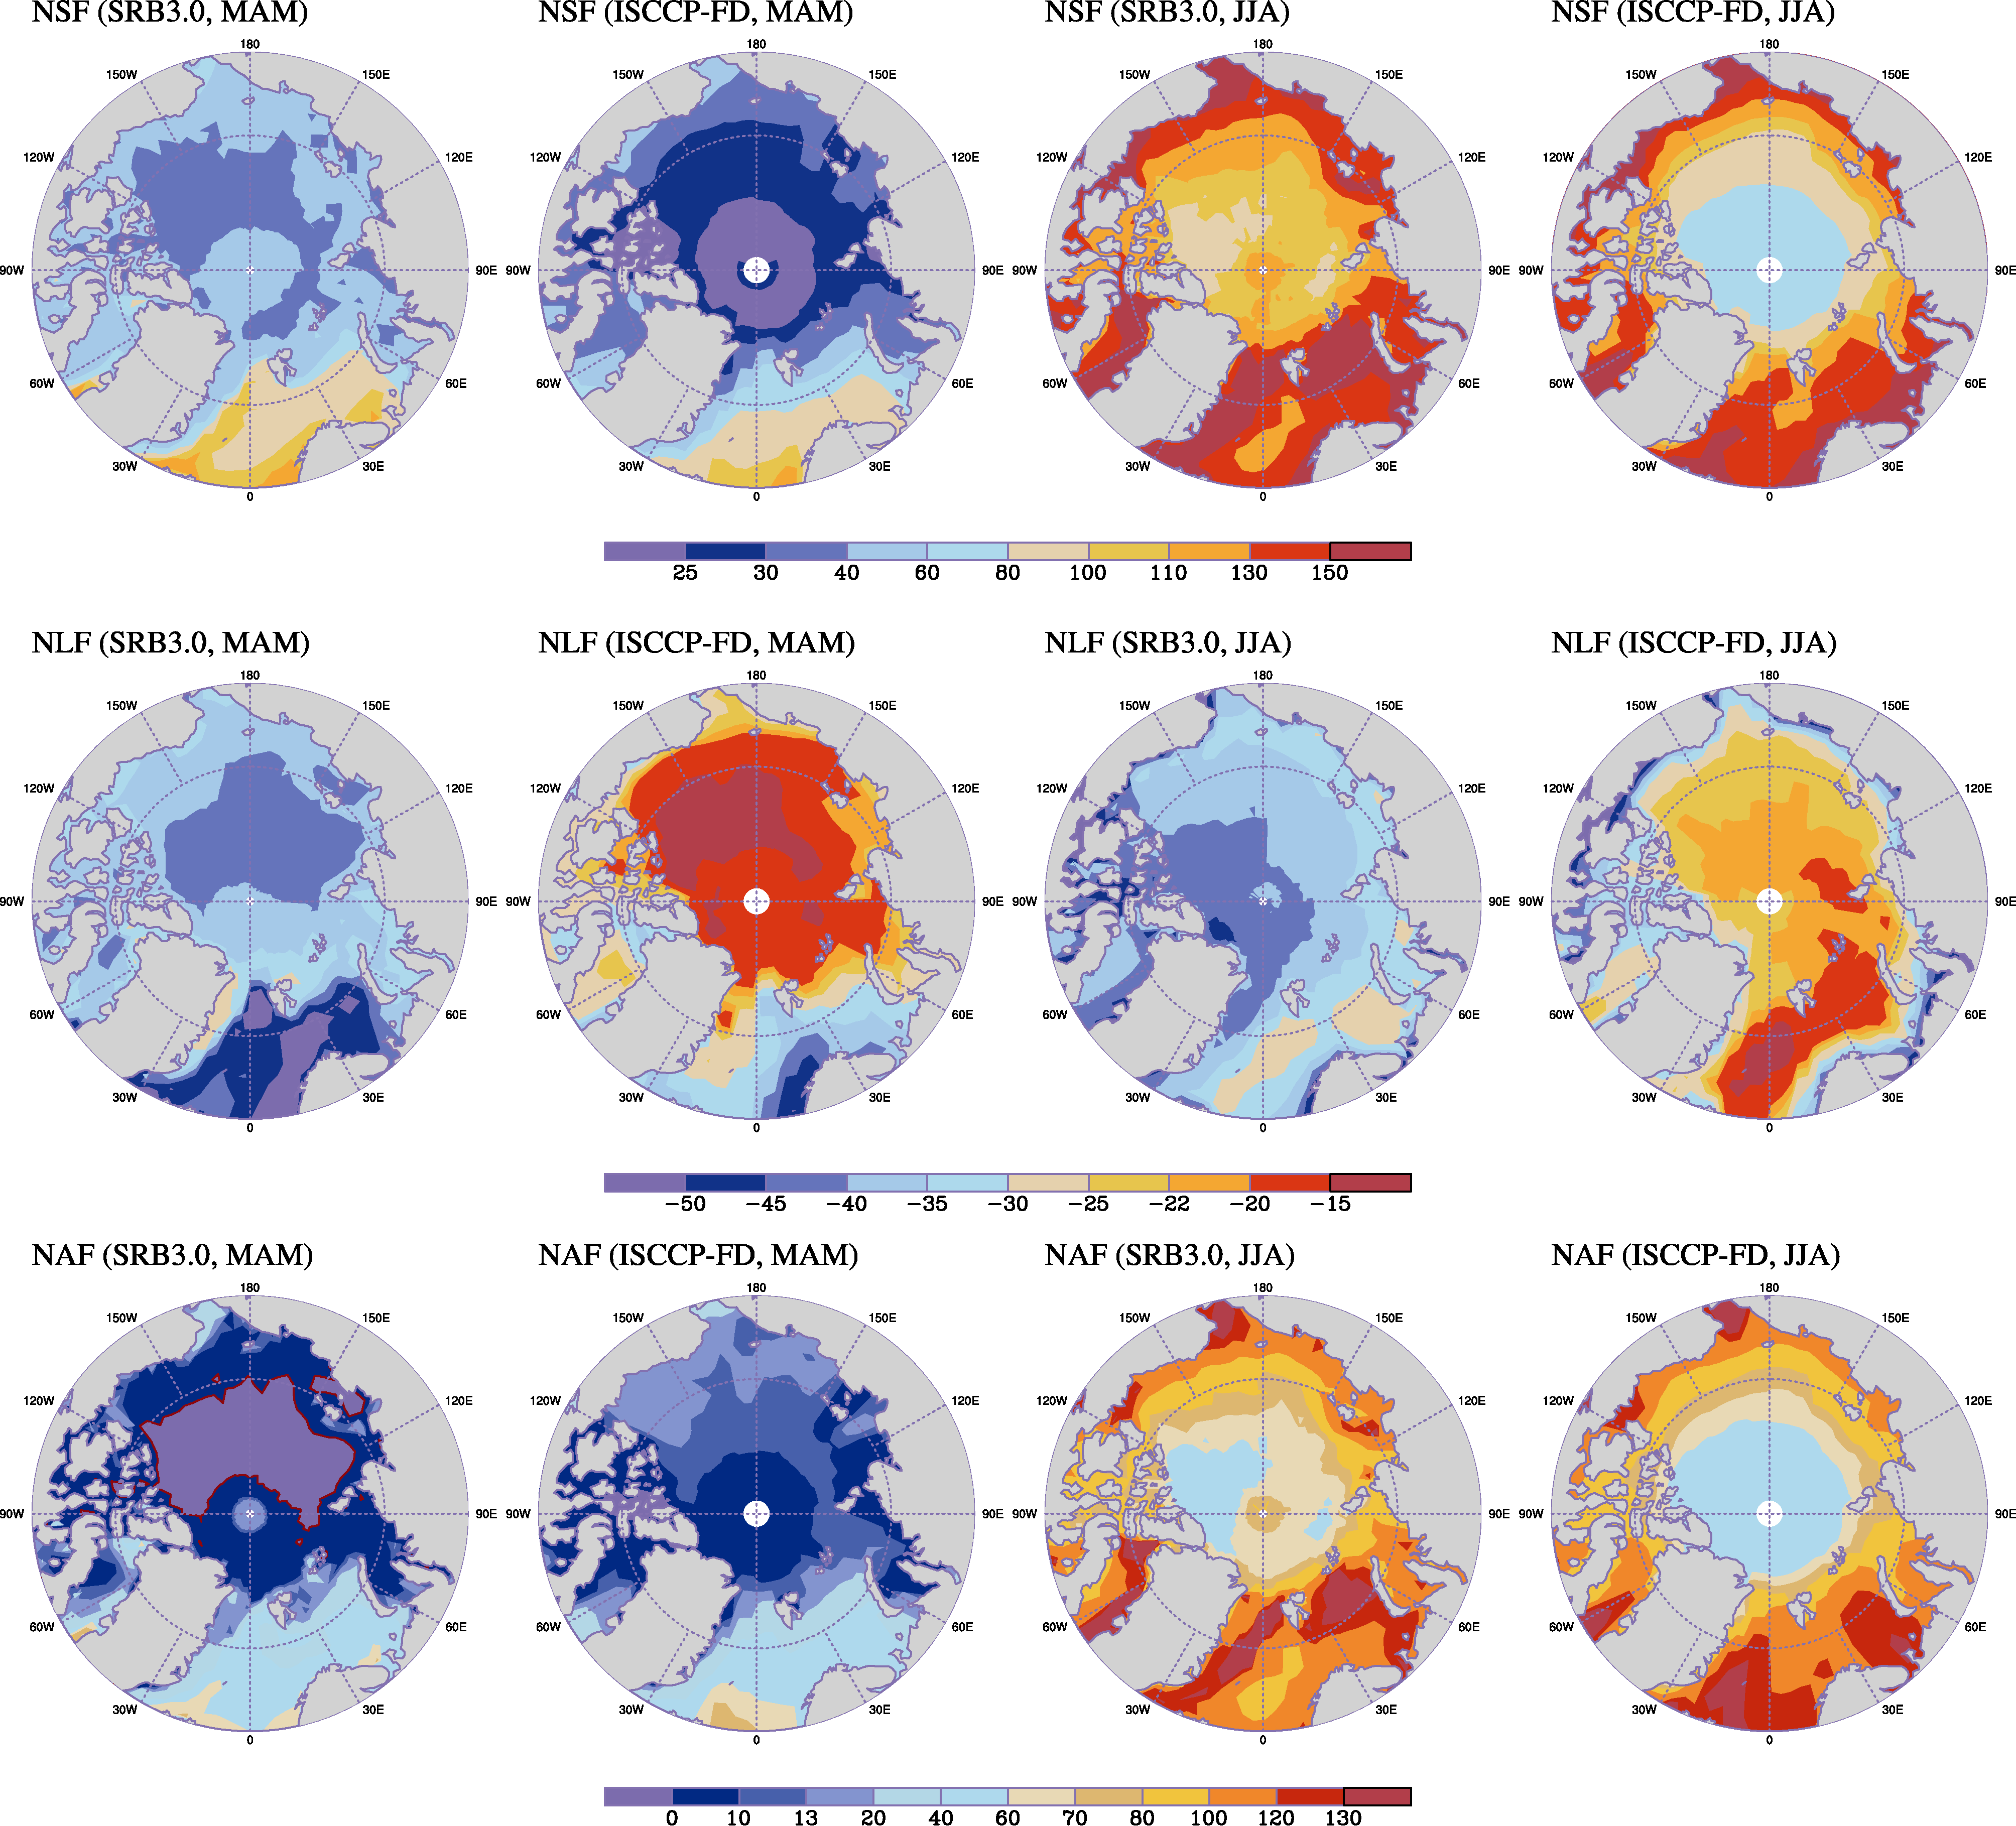 | Figure 3 Spatial distributions of net shortwave (top panels), net longwave (middle panels), and net all-wave (bottom panels) radiation fluxes at the surface in spring (March-May) and summer (June-August) for SRB3.0 and ISCCP-FD. |
In general, clouds are effective for reflecting incoming solar radiation back to space, which results in surface cooling. However, they are also effective for absorbing the outgoing longwave radiation and enhancing down ward infrared radiation, which results in surface warming. The cloud radiative effect, known as cloud radiative forcing, depends on the balance between shortwave and longwave budgets affected by clouds. Here cloud forcing (CF) is defined as CF = F(A) - F(0), where F is the downward flux (W m-2) in shortwave or longwave radiation at the surface, A is cloud fraction. F(A) and F(0) indicate downward flux for cloudy and cloud-free conditions, respectively.
Figure 1c shows seasonal variations in shortwave, longwave, and all-wave cloud forcings averaged over the Arctic Ocean. The SRB3.0 reveals that shortwave cloud forcing (SCF) decreases gradually in March; reaches its minimum value of ~ -167 W m-2 at the end of May, which is one month earlier than that reported by Wang and Key (2005); and increases to ~ -22 W m-2 at the end of September. Longwave cloud forcing (LCF) has two potential minimums at ~ 41 W m-2in late April and ~ 39 W m-2in early August. These results differ from that reported by Wang and Key (2005), which indicates only the minimum in April. It should be noted that there is a large fluctuation in LCF in April and May at a factor of 2-3 greater than that observed during the summer melting period. The SRB3.0 suggests that the SCF is always negative and that the LCF is always positive. These results are consistent the theory such that clouds have a cooling (warming) effect on the surface in terms of shortwave (infrared) radiation. Regarding the all-wave cloud forcing (ACF), the SRB3.0 indicates that the seasonal cycle of the ACF follows that of the SCF. The ACF is positive during cold seasons of September-March (not shown) and negative during warm seasons of April-August, which led to respective warming and cooling effects of the clouds on the surface.
The ISCCP-FD agrees well with the SRB3.0 in terms of seasonal variations for all cloud forcing components. The LCF of the ISCCP-FD closely tracks that of the SRB3.0, while the SCF and ACF of the ISCCP-FD are larger than those of the SRB3.0. The largest difference occurs in May and June at a magnitude of ~ -30 W m-2.
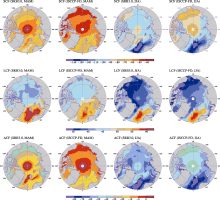
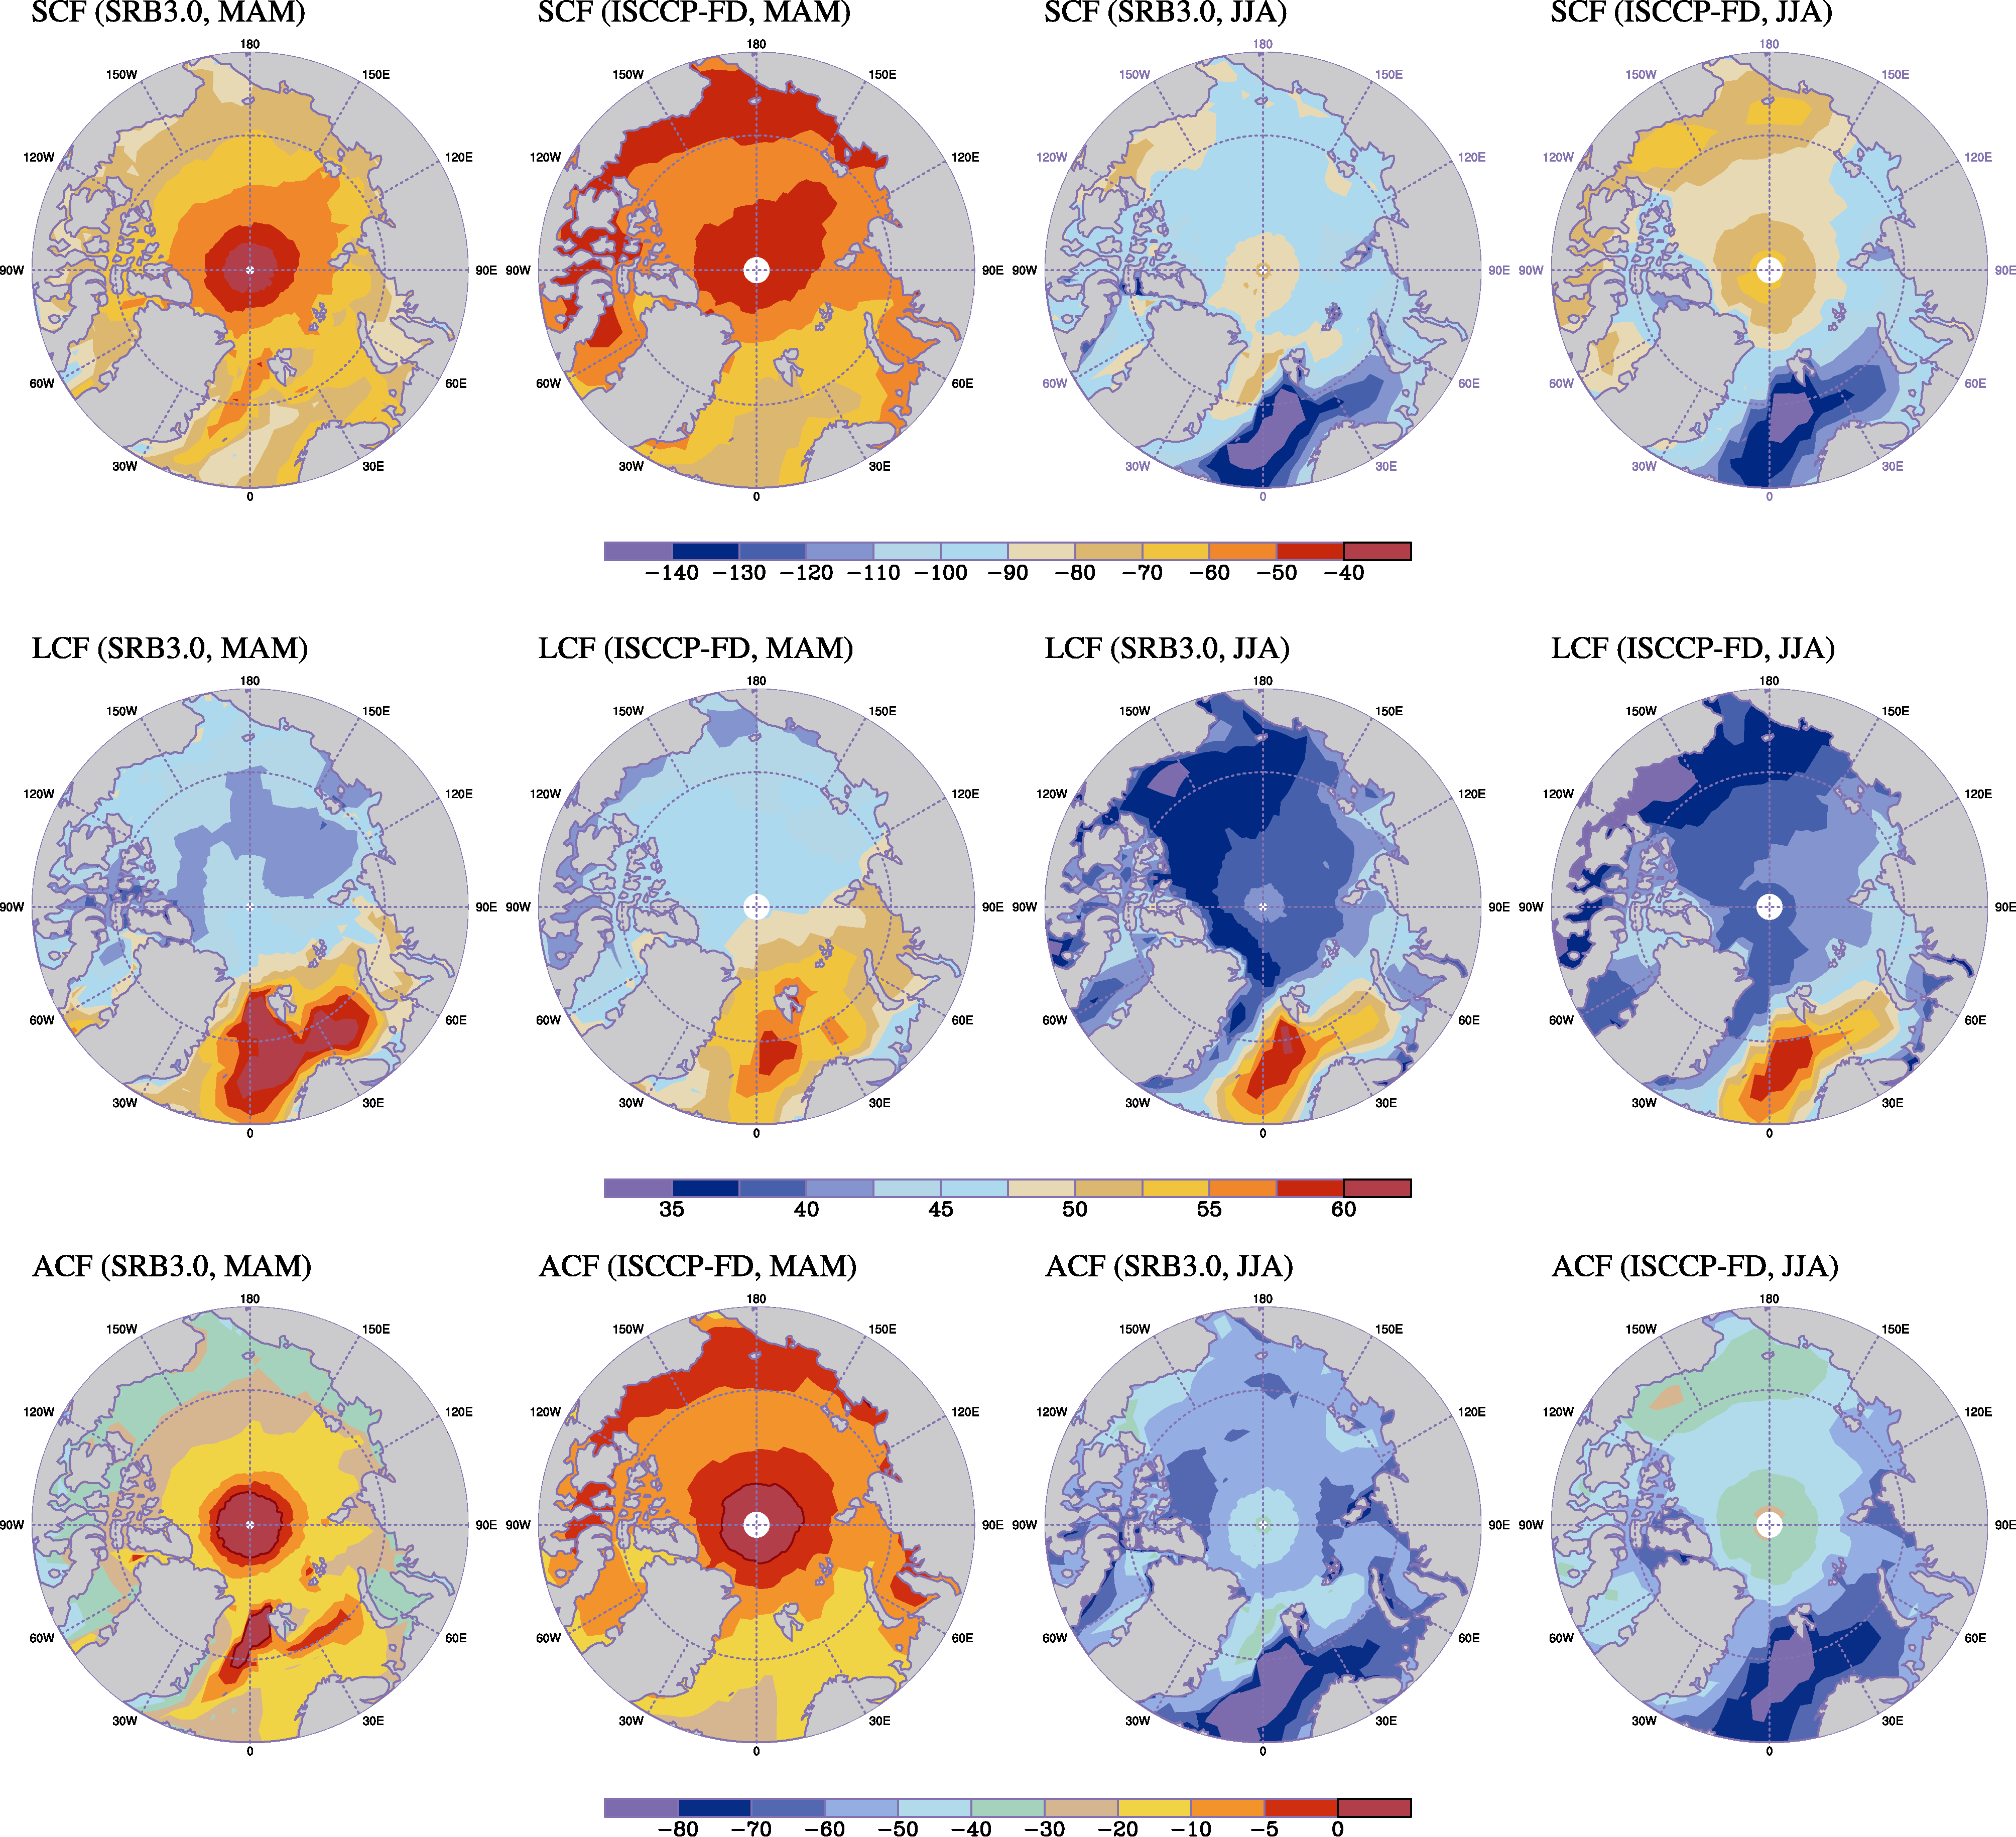 | Figure 4 Spatial distributions of net shortwave (top panels), net longwave (middle panels), and net all-wave (bottom panels) cloud radiative forcings at the surface in spring (March-May) and summer (June-August) for SRB3.0 and ISCCP-FD. |
The spatial distribution of SCF, LCF, and ACF is shown in Fig. 4. The SRB3.0 exhibits a poleward increase in the SCF. The cooling-associated shortwave radiative forcing in spring at ~ -40 - -30 W m-2 is smaller than that in summer at ~ -100 - -80 W m-2. The LCF in the Arctic Ocean is more uniform at 40-45 W m-2 in spring and 35-40 W m-2 in summer. The spatial pattern of the ACF resembles that of the SCF. Overall, clouds have a cooling effect on most of the Arctic Ocean in spring and summer.
The spatial pattern of the ISCCP-FD SCF resembles that of the SRB3.0, although the zonal poleward increase in the ISCCP-FD is not obvious in the Pacific sector in spring. The ISCCP-FD has a relatively larger LCF in the central Arctic Ocean than that of the SRB3.0 in spring. The spatial distribution of the ACF of the SRB3.0 and ISCCP-FD is similar to that of SCF due to the dominant control of the latter.
In this study, we compare two recently improved surface radiative flux data sets of SRB3.0 and ISCCP-FD in the Arctic Ocean with a focus on seasonal variations and spatial distribution in spring and summer. More specifically, the examined atmospheric parameters includes surface albedo; net surface shortwave, longwave, and all- wave radiative fluxes; and net shortwave, longwave, and all-wave cloud radiative forcings.
Our analysis shows that the basin-wide averaged seasonal cycle and spatial distribution of surface albedo for SRB3.0 and ISCCP-FD are in good agreement, although the ISCCP-FD albedo is greater than that of the SRB3.0. However, neither datasets shows an increase in albedo during the fall freeze-up, as suggested by in-situ measurements. The averaged seasonal cycle and spatial distribution of the net shortwave and all-wave radiative fluxes at the surface for the SRB3.0 and ISCCP-FD are similar. In addition, the averaged seasonal variation and spatial pattern of all components of cloud radiative forcings show encouraging agreement. However, a persistent large discrepancy is identified for the net longwave radiative flux due large differences in surface temperature, particularly from April to June.
Liu et al. (2007) suggested that for the stand-alone sea ice model (CICE), a 4 W m-2 increase in surface downward longwave radiative ?ux could lead to varied responses in the simulated sea ice cover and thickness. Such results include a significantly larger response of >10% in ice cover in the eastern Arctic than that in the western Arctic and large and quite spatially uniform responses of >0.4 m in ice thickness in nearly the entire Arctic Ocean. Here, our analysis shows that the difference in NSF between the SRB3.0 and ISCCP-FD can reach ~ 31 W m-2 in early July and that the difference in the NLF between the SRB3.0 and ISCCP-FD is about 23 W m-2, which far exceeds 4 W m-2. At this stage, it is not entirely clear which dataset is better and more suitable for forcing sea ice models. Further model studies testing the impacts of these temporal and spatial discrepancies on basin-scale sea ice simulations will provide additional information for such assessment.
In-situ measurements of radiative fluxes at the surface of the Arctic Ocean have previously been insufficient. We intend for the preliminary intercomparison in the present study to be useful for the observational community in planning and deploying in-situ flux measurements in key regions in which flux products differ significantly.
| 1 |
|
| 2 |
|
| 3 |
|
| 4 |
|
| 5 |
|
| 6 |
|
| 7 |
|
| 8 |
|
| 9 |
|
| 10 |
|
| 11 |
|
| 12 |
|
| 13 |
|