Using Satellite Data to Analyze the Initiation and Evolution of Deep Convective Clouds
CAO Zhi-Qiang1, 2, 3  , HUANG Qing-Ni
3 , ZHAO Su-Rong4
, HUANG Qing-Ni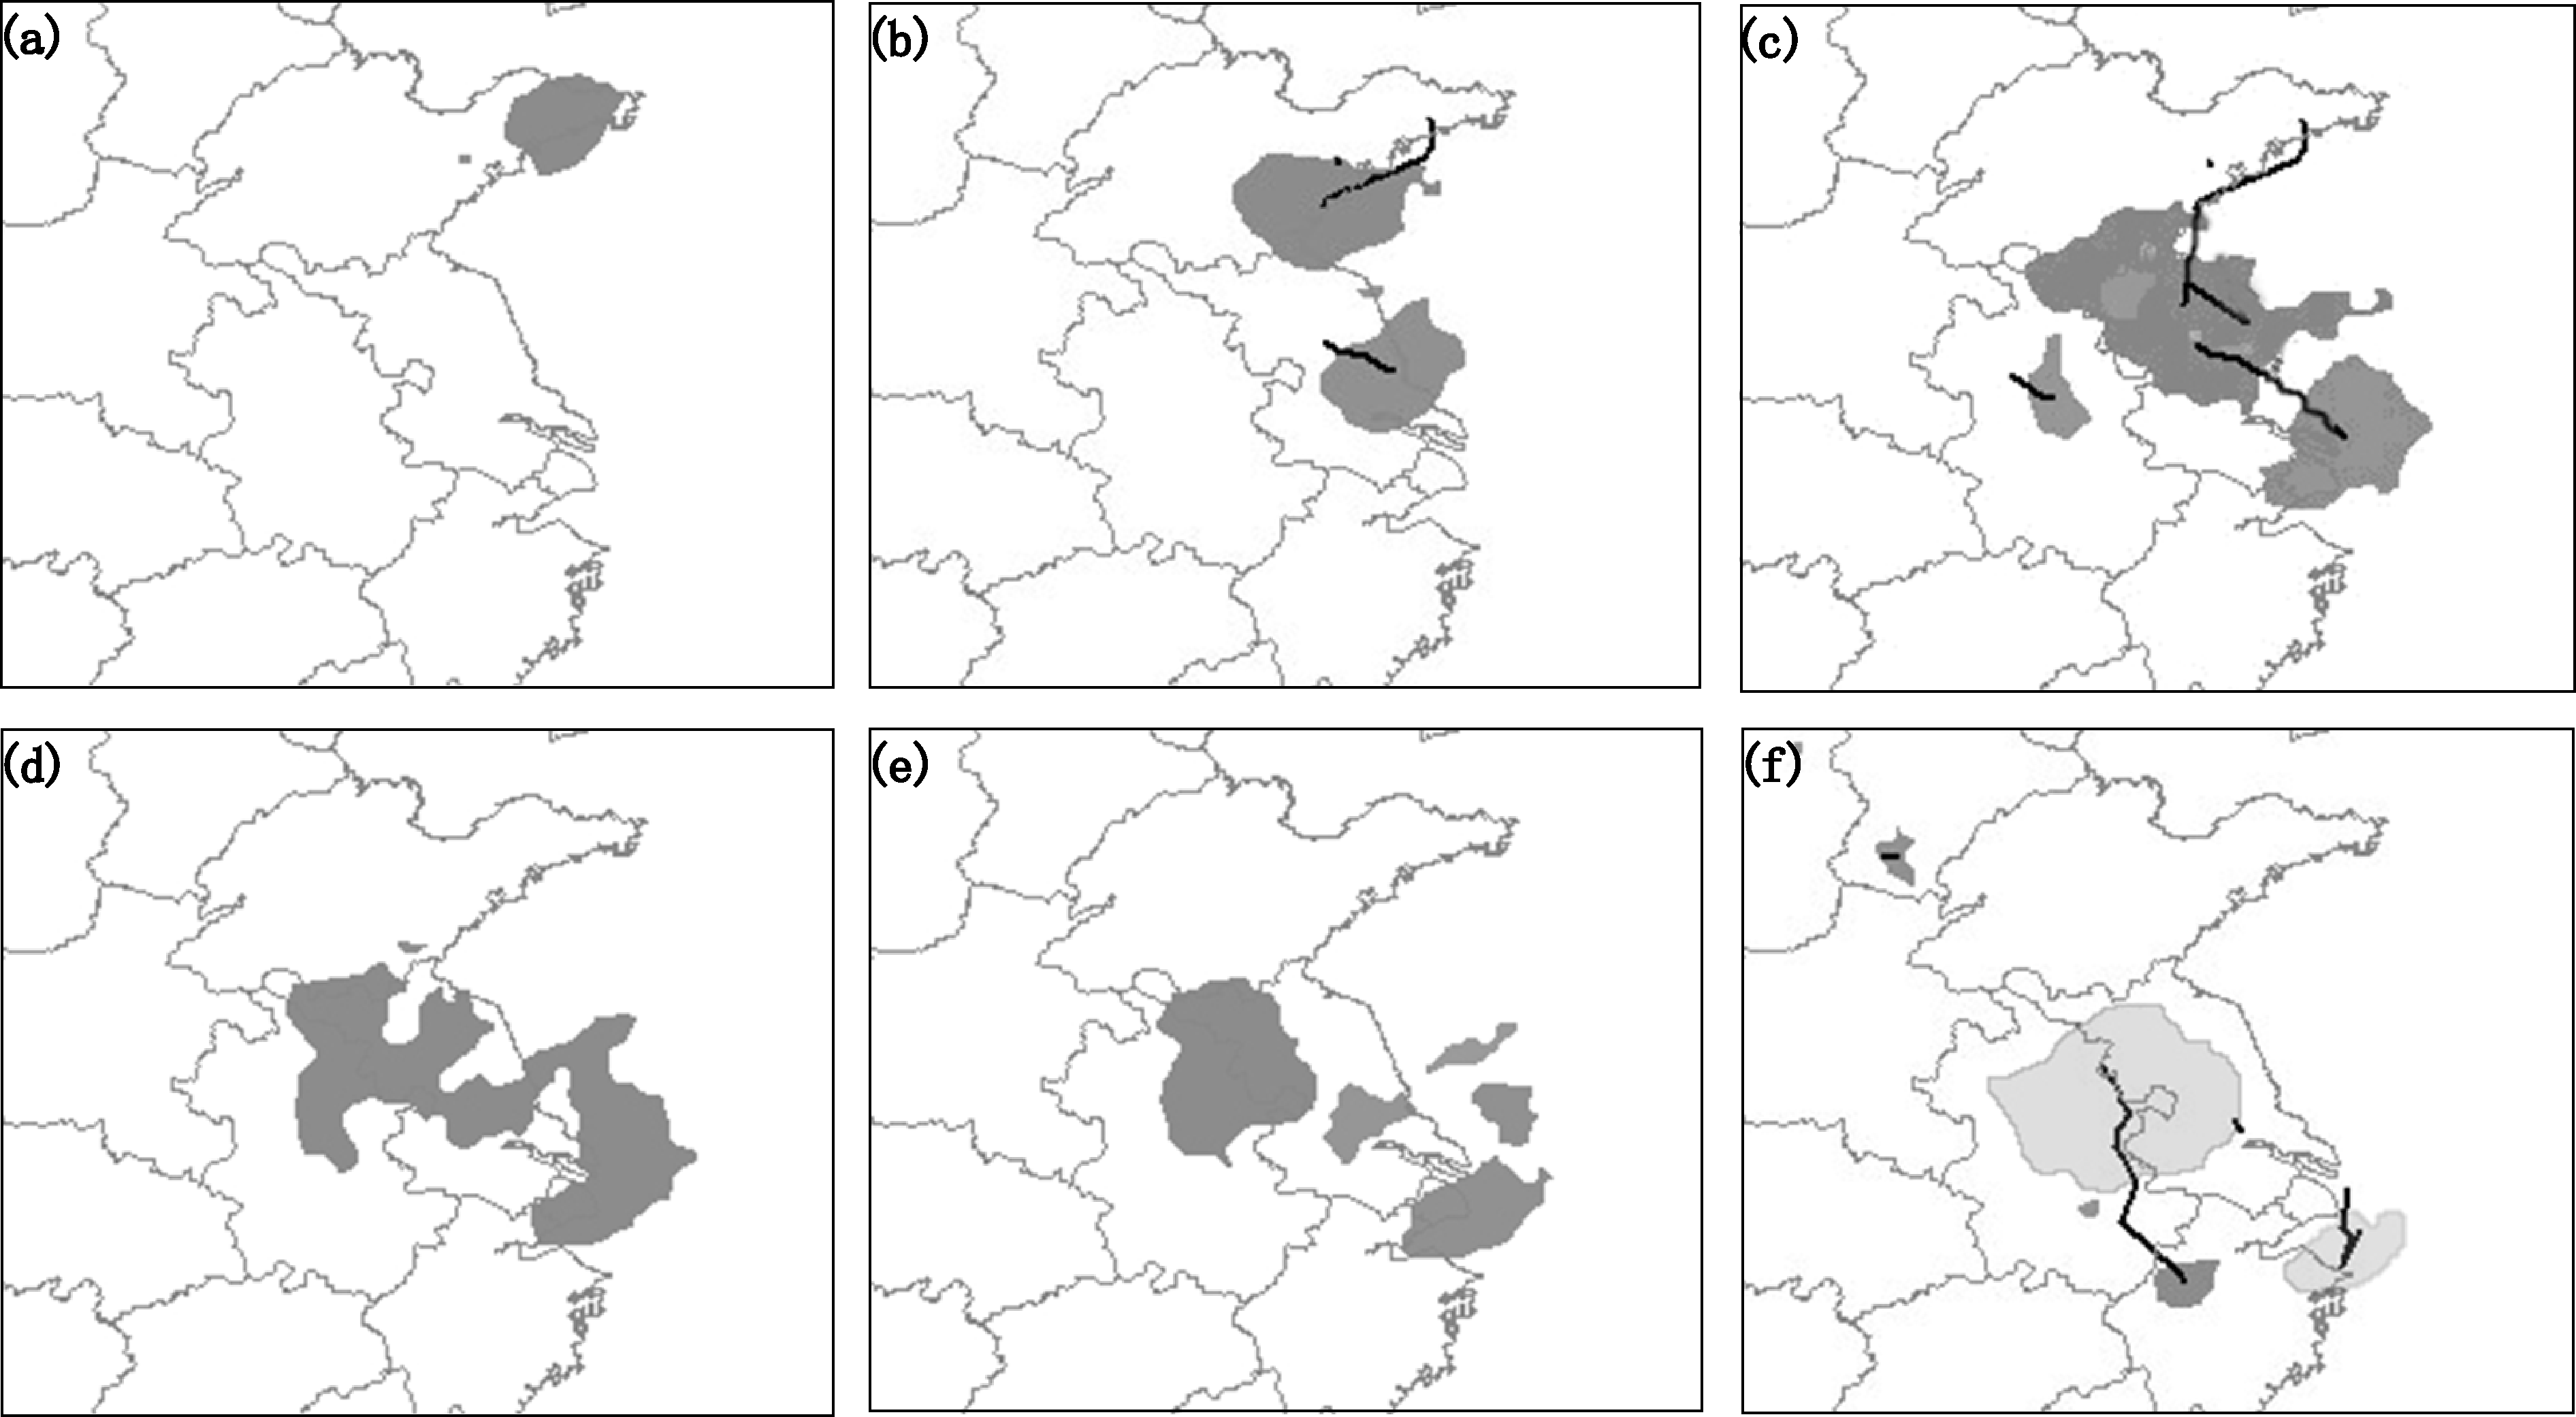
Using Satellite Data to Analyze the Initiation and Evolution of Deep Convective Clouds |
|
CAO Zhi-Qiang
, HUANG Qing-Ni |
| Figure 4 The identification and moving path of the deep convective cloud on 26 July 2012: a Identification graph at 10:00 BT; b identification graph at 14:30 BT and movement path at 10:00-14:30 BT; c identification graph at 17:30 BT and movement path at 10:00-17:30 BT; d identification graph at 18:00 BT; e identification graph at 18:30 BT; f identification graph at 24:00 and movement path at 19:00-24:00 BT. Light shading represents deep convective cloud of occurring at 20:00 BT. |
| |