Sensitivity of Precipitation in Aqua-Planet Experiments with an AGCM
YU Hai-Yang1, 2 , BAO Qing1  , ZHOU Lin-Jiong
1, 2 , WANG Xiao-Cong1 , LIU Yi-Min1
, ZHOU Lin-Jiong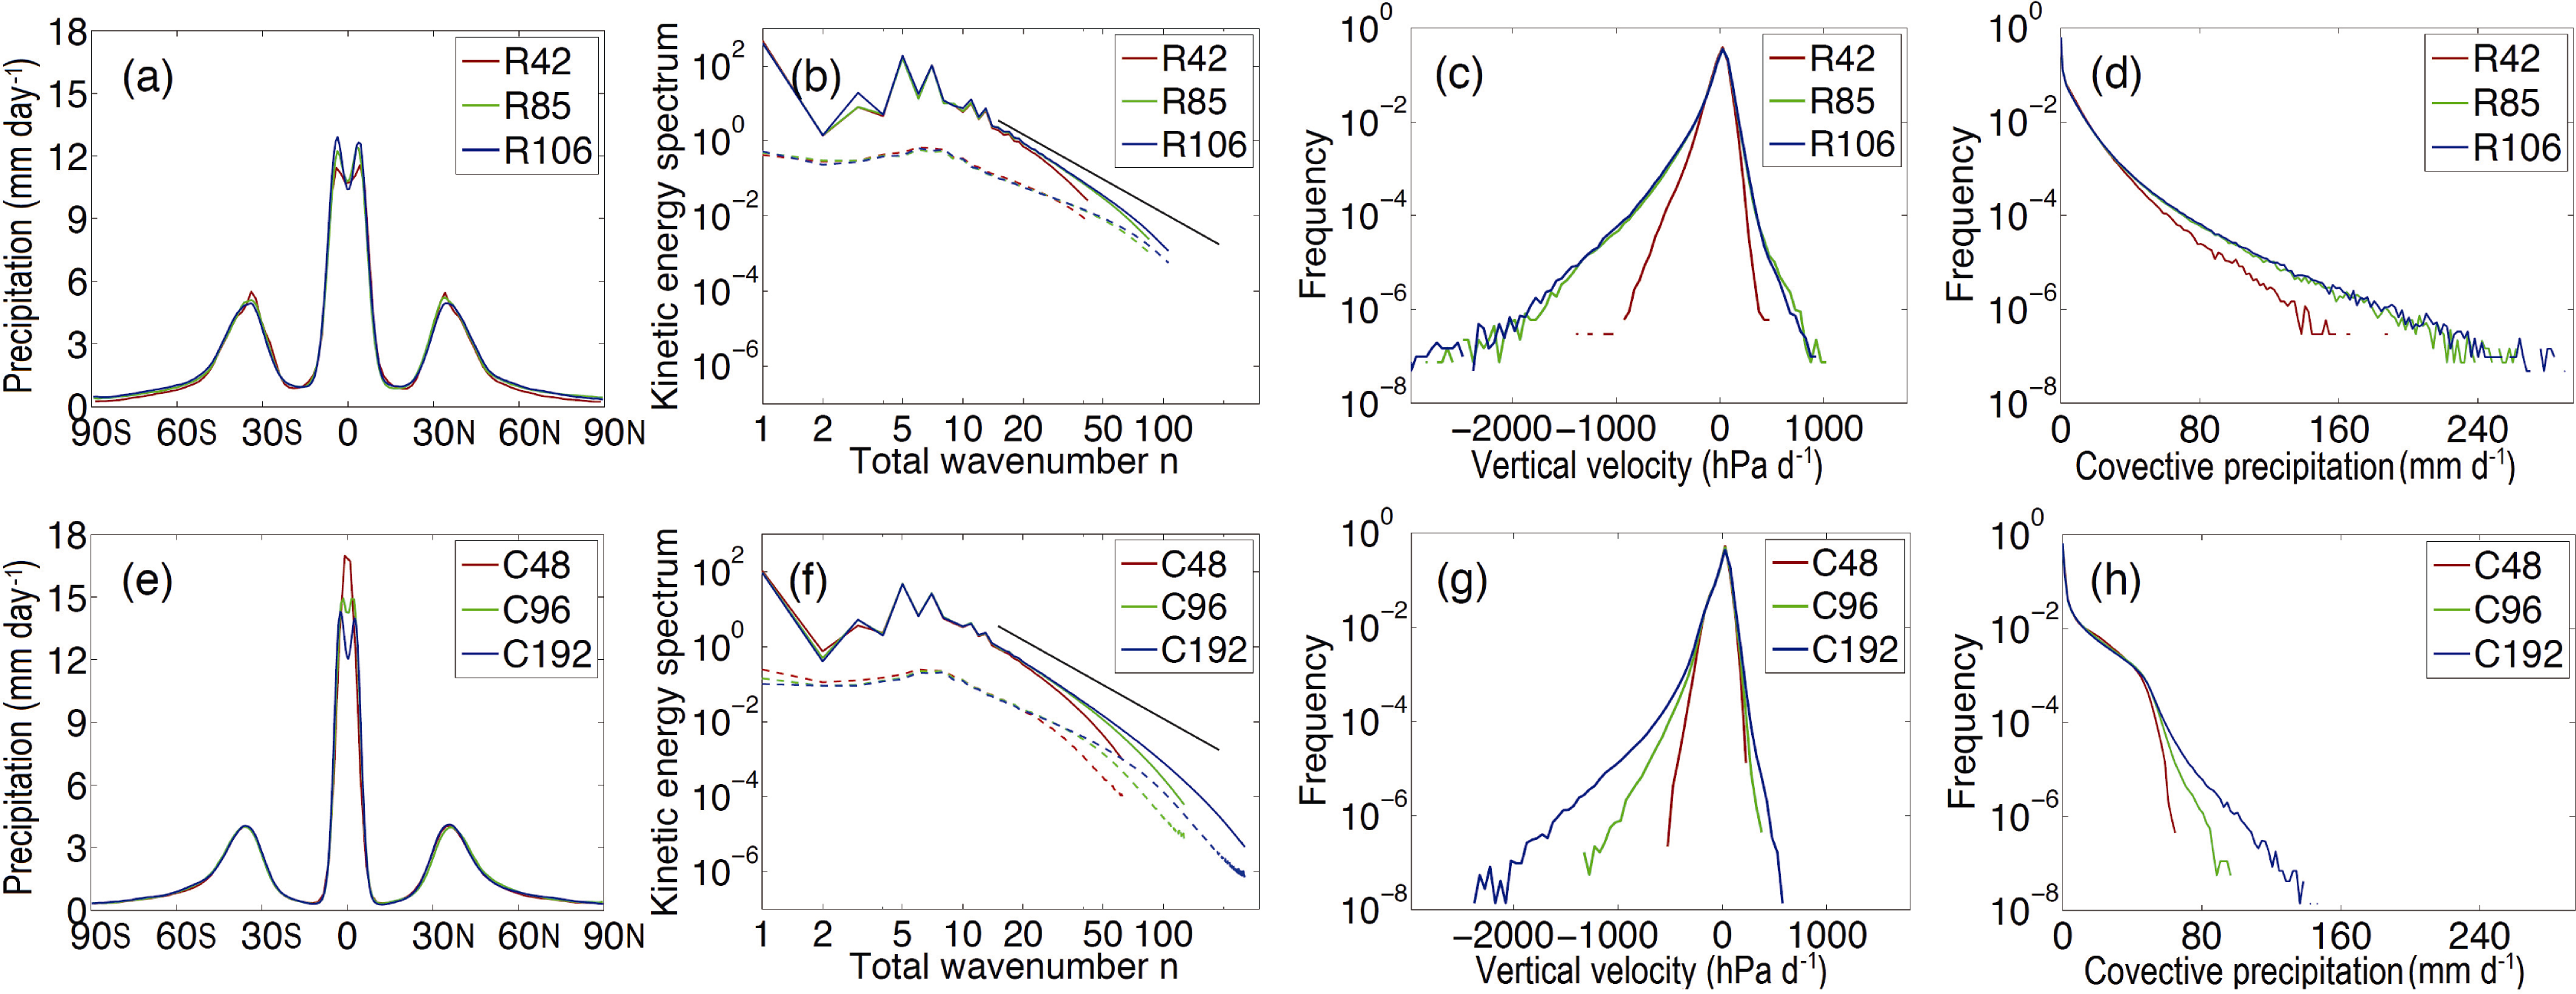
Sensitivity of Precipitation in Aqua-Planet Experiments with an AGCM |
|
YU Hai-Yang
, ZHOU Lin-Jiong |
| Figure 4 APEs including atmospheric models with a SAMIL, upper panels and those with a FAMIL, bottom panels at various resolutions. a and e: Distributions of the zonal averaged precipitation. b and f: Kinetic energy spectrum approximately 200 hPa on the two-dimensional wavenumber n . Dashed lines in b and f represent divergence components. Black lines in b and f are reference lines with a slope of -3. c and g: Probability distributions of daily tropical vertical velocity 850 hPa, 30ˇăS-30ˇăN. d and h: Probability distributions of daily tropical precipitation 30ˇăS-30ˇăN. |
| |