Detecting Changes in Precipitation and Temperature Extremes over China Using a Regional Climate Model with Water Table Dynamics Considered
QIN Pei-Hua1 , XIE Zheng-Hui1  , WANG Ai-Wen
1, 2
, WANG Ai-Wen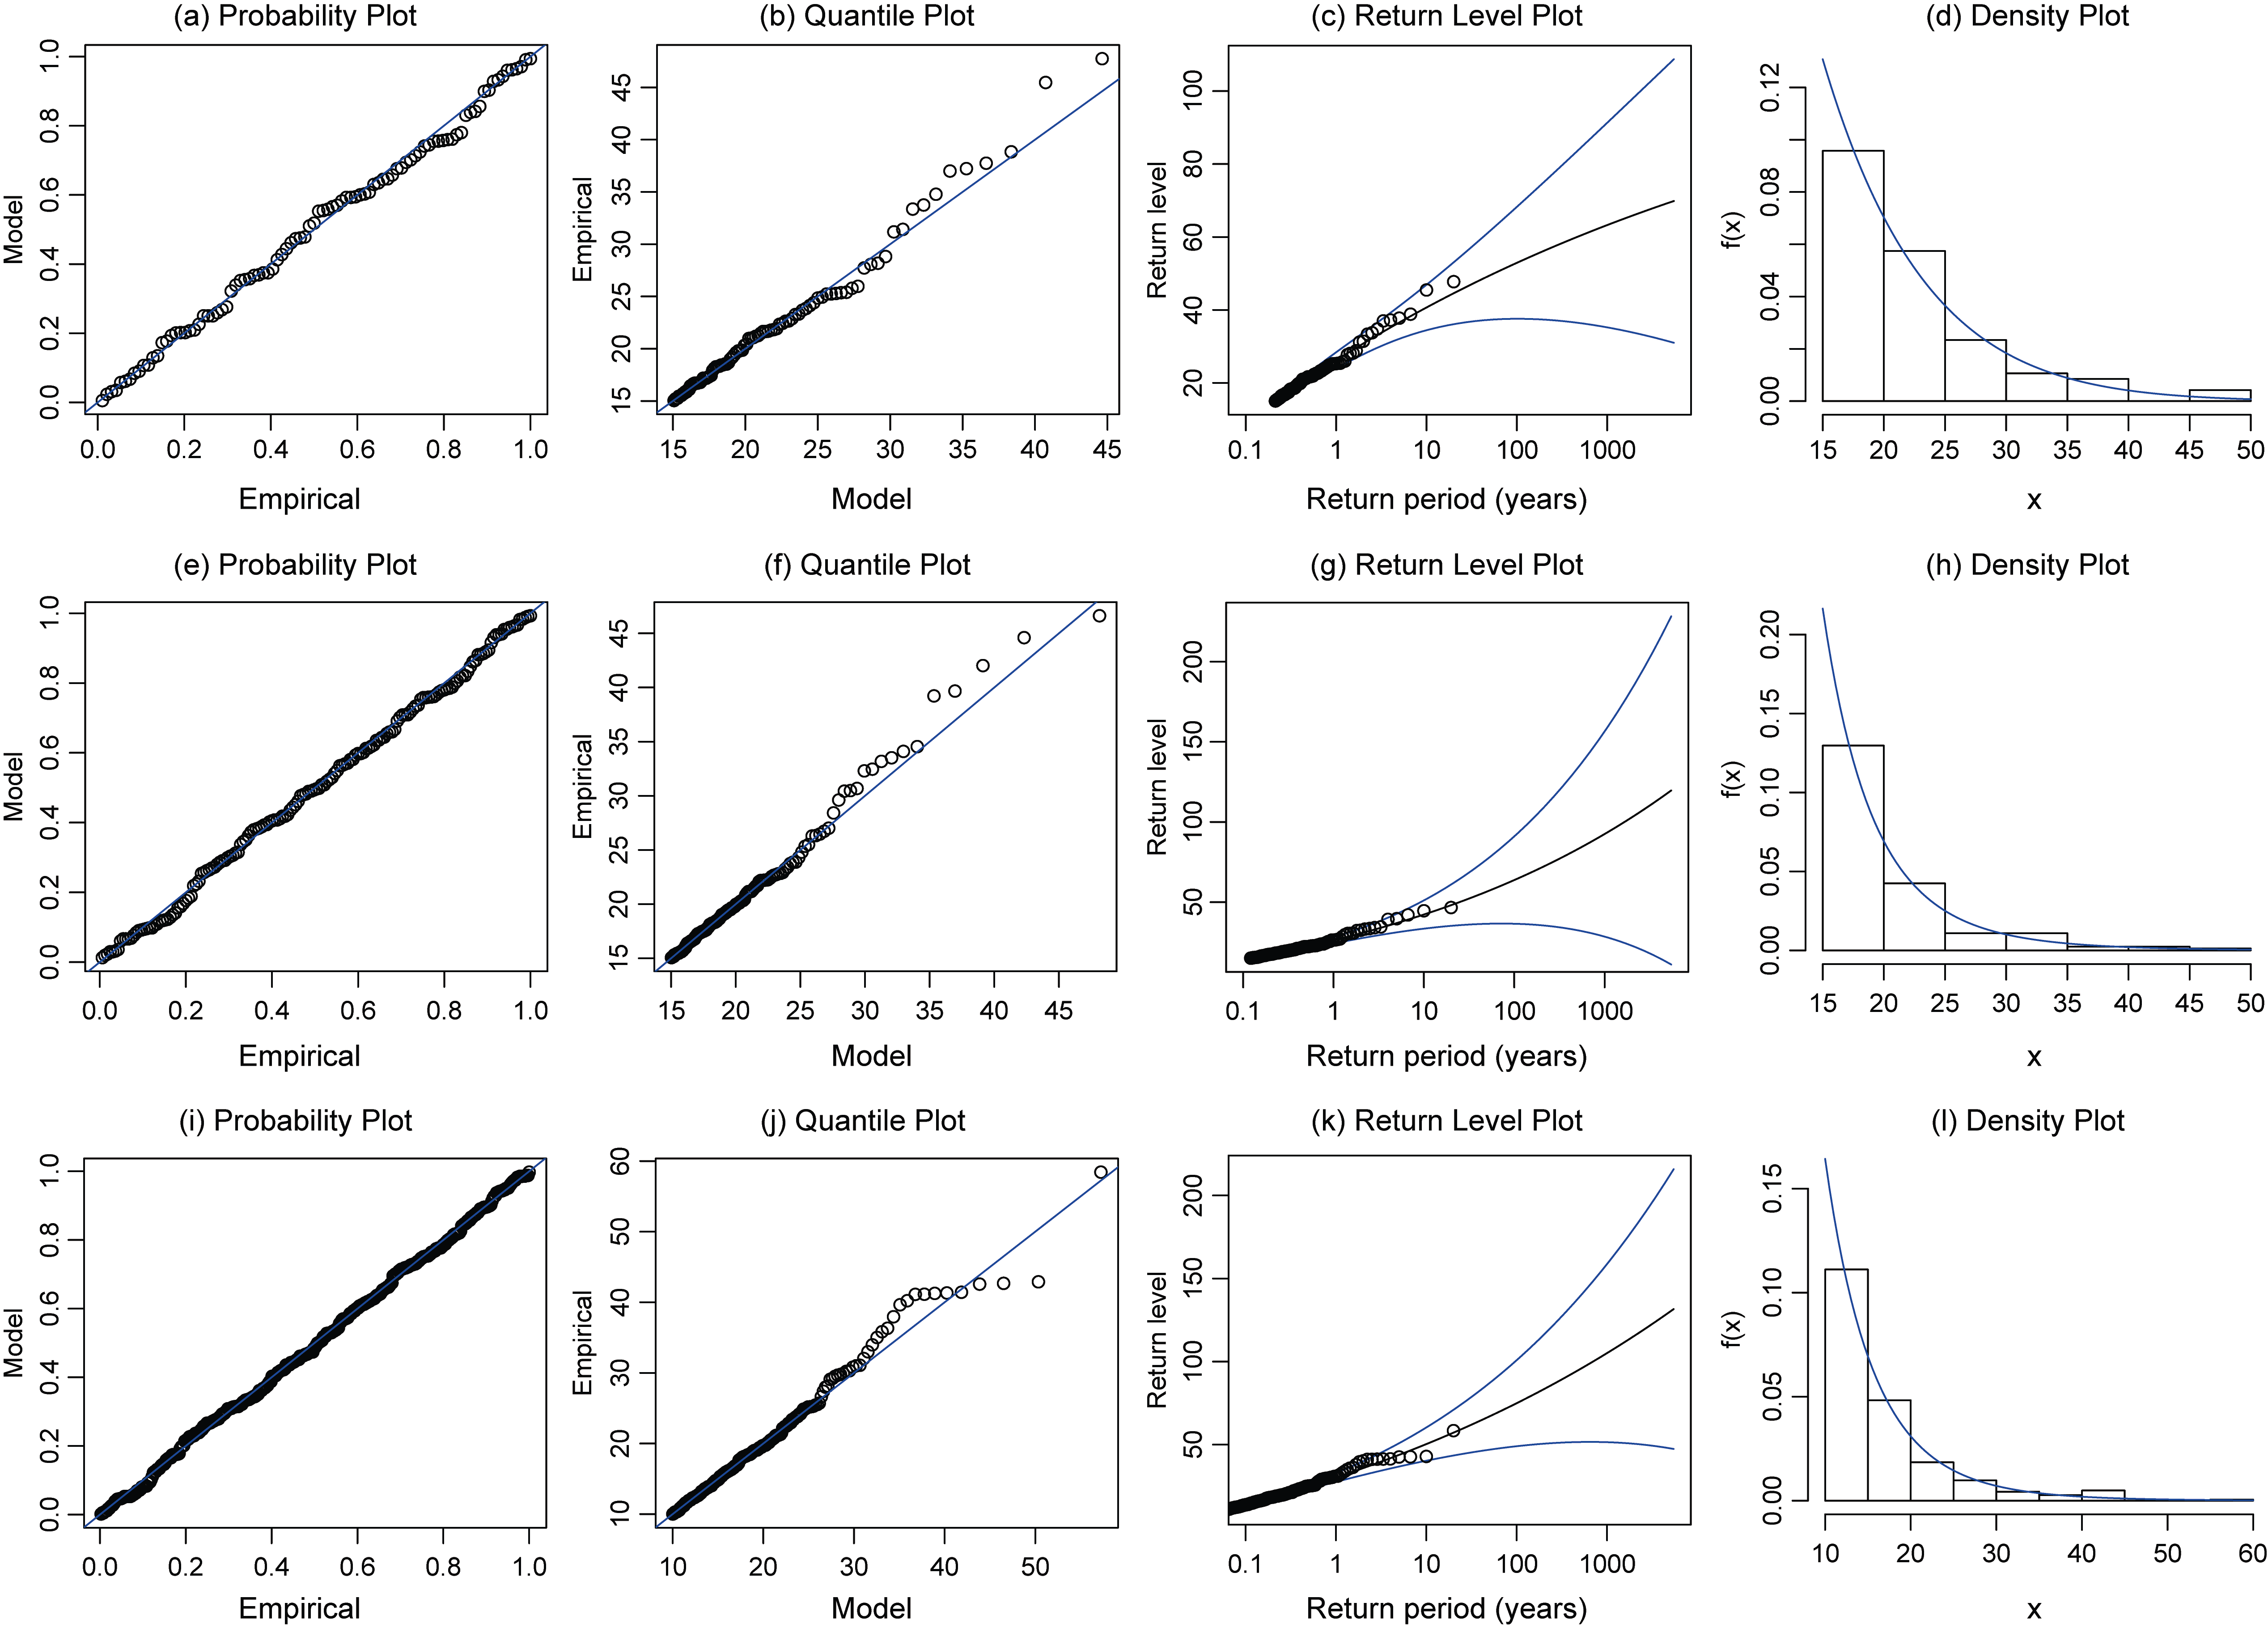
Detecting Changes in Precipitation and Temperature Extremes over China Using a Regional Climate Model with Water Table Dynamics Considered |
|
QIN Pei-Hua
, WANG Ai-Wen |
| Figure 3 a-d Diagnostic plots from fitting observed daily precipitation, e-h daily precipitation from the CTL run, and i-l HYD run to the GP distribution in the Haihe River Basin from 1 September 1982 to 28 August 2002 . |
| |