Detecting Changes in Precipitation and Temperature Extremes over China Using a Regional Climate Model with Water Table Dynamics Considered
QIN Pei-Hua1 , XIE Zheng-Hui1  , WANG Ai-Wen
1, 2
, WANG Ai-Wen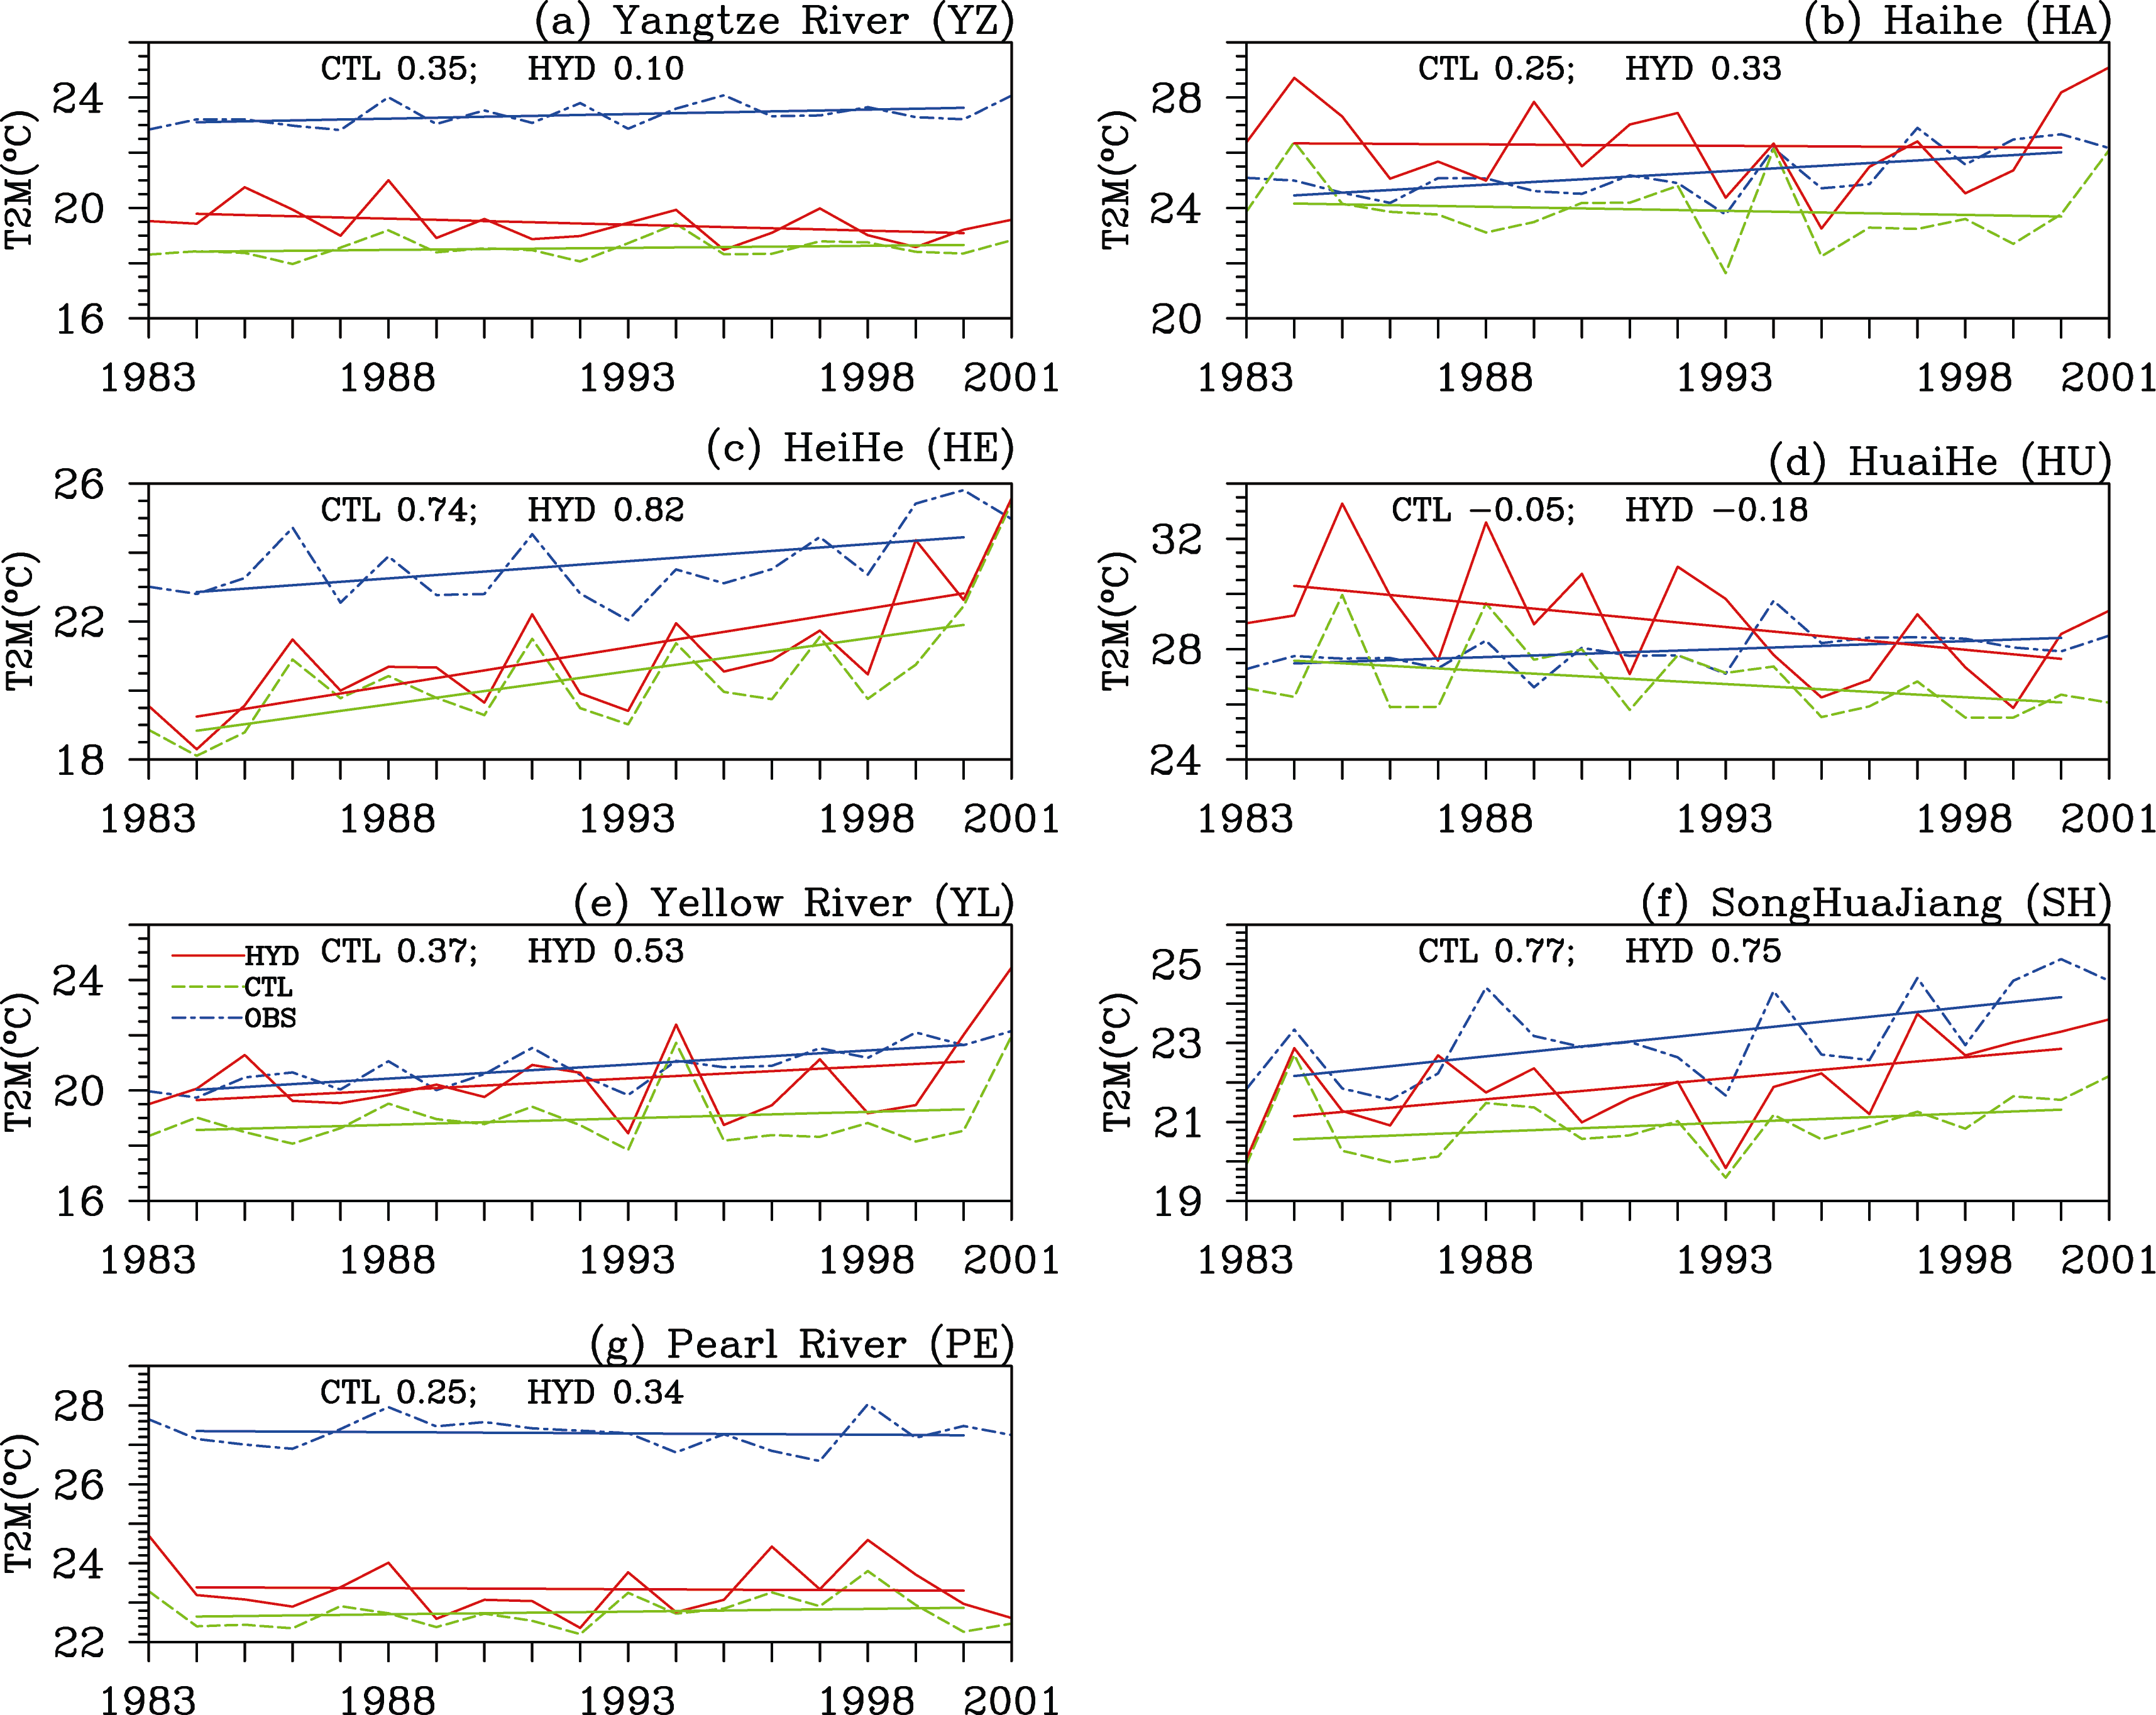
Detecting Changes in Precipitation and Temperature Extremes over China Using a Regional Climate Model with Water Table Dynamics Considered |
|
QIN Pei-Hua
, WANG Ai-Wen |
| Figure 4 Time series for daily temperatures at 2 m T2M above the 95th percentile TX95n, #cod#x000b0;C of seven river basins in China. Associated trends are shown as: red solid line#cod#x02014;T2M from the HYD run; green dashed line#cod#x02014;T2M from CTL run; blue dashed line#cod#x02014;observed T2M. The correlation coefficients for the CTL run and HYD run compared with the observed values are also shown. |
| |