

Decadal Variation of the Aleutian Low-Icelandic Low Seesaw Simulated by a Climate System Model (CAS-ESM-C)
[DONG Xiao1, 2  , SU Tong-Hua
1 , WANG Jun3 , LIN Ren-Ping2 ]
, SU Tong-Hua|
|


Based on a simulation using a newly developed climate system model (Chinese Academy of Sciences-Earth System Model-Climate system component, CAS-ESM-C), the author investigated the Aleutian Low- Icelandic Low Seesaw (AIS) and its decadal variation. Results showed that the CAS-ESM-C can reasonably reproduce not only the spatial distribution of the climatology of sea level pressure (SLP) in winter, but also the AIS and its decadal variation. The period 496-535 of the integration by this model was divided into two sub-periods: 496-515 (P1) and 516-535 (P2) to further investigate the decadal weakening of the AIS. It was shown that this decadal variation of the AIS is mainly due to the phase transition of the Pacific Decadal Oscillation (PDO), from its positive phase to its negative phase. This transition of the PDO causes the sea surface temperature (SST) in the equatorial eastern (northern) Pacific to cool (warm), resulting in the decadal weakening of mid-latitude westerlies over the North Pacific and North Atlantic. This may be responsible for the weakening of the inverse relation between the Aleutian Low (AL) and the Icelandic Low (IL).
Teleconnection is an essential phenomenon in atmospheric general circulation ( Walker and Bliss, 1932; Wallace and Gutzler, 1981; Gong and Wang, 1999; Thompson and Wallace, 2000). In the Northern Hemisphere, the North Atlantic Oscillation (NAO), and the North Pacific Oscillation (NPO), which reside over the mid-to-high latitude ocean, are intimately associated with climate anomalies around the globe ( Hurrell, 1995; Wu and Huang, 1999; Linkin and Nigam, 2008; Wang et al., 2011). Associated with the NAO and NPO, the Icelandic Low (IL) and the Aleutian Low (AL) are two semi-permanent atmospheric action centers in boreal winter. Honda et al. (2001) found that there is a notable negative correlation between the two lows, which is called the Aleutian Low-Icelandic Low Seesaw (AIS). Further studies have shown that the AIS can exert an influence on the interannual variation of the northern hemispheric general circulation in winter ( Honda and Nakamura, 2001). Besides, the AIS can also modulate the regional climate in the northern Atlantic/Pacific and the variation of the stratosphere ( Nakamura and Honda, 2002; Honda et al., 2005).
During the late 1970s, there was an interdecadal variation of the air-sea system, which may be linked to the Pacific Decadal Oscillation (PDO) ( Trenberth and Hurrell, 1994; Mantua et al., 1997). The PDO is recognized as an internal variability of the climate system and its origin may result from air-sea coupling processes ( Yang et al., 2004). The PDO can be affected by external forcing, such as volcanic eruption ( Wang et al., 2012). Due to the phase transition of the PDO, the general circulation has experienced remarkable changes. Based on observations, reanalysis data and an atmospheric general circulation model simulation, Dong et al. (2013) investigated the decadal variation of the AIS. It was revealed that the phase transition of the PDO plays a major role in the decadal shift of the AIS during the late 1970s. The phase transition of the PDO from a negative phase to a positive one leads to a warmer sea surface temperature (SST) over the tropical Pacific Ocean and a cooler SST in the North Pacific. In the meantime, the two lows become more deepened with a strengthened westerly to the south flanks of the lows. As a result, the negative correlation between the AL and the IL tends to become significant through the dispersive process of Rossby waves. They also showed that, driven by the observed SST and sea ice, an atmospheric general circulation model from the Institute of Atmospheric Physics (IAP AGCM4) generally reproduces the observed decadal shift of the AIS and the related mechanism.
Nevertheless, considering the formation mechanism of the PDO, a stand-alone AGCM may, to some extent, misrepresent the processes associated with the formation of the PDO. Whether the PDO-related decadal variation of the AIS can be reproduced in a coupled climate system model remains unclear. In the present reported study, based on the control simulation with a fully coupled climate system model (Chinese Academy of Sciences-Earth System Model-Climate system component, CAS-ESM-C) ( Sun et al., 2012), we further investigated the decadal variation of the AIS and its relationship to the PDO. We wanted to answer this question: Can the AIS and its decadal variation be reasonably reproduced in the air-sea coupled climate system model?
The rest of this paper is organized as follows. The model and data are described in section 2. Section 3 shows the main results. The conclusion and discussion are given in section 4.
The model used in this study was a fully coupled climate system model (CAS-ESM-C), which consists of an atmospheric component (IAP AGCM4), an oceanic component (the State Key Laboratory of Numerical Modeling for Atmospheric Sciences and Geophysical Fluid Dynamics (LASG)/IAP Climate system Ocean Model, LICOM 1.0), a land component (Community Land Model, CLM3), and a sea ice component (Community Sea Ice Model, CSIM5). The coupler (cpl6 for short), developed at the National Center for Atmospheric Research (NCAR), is employed in this model to couple each component model together ( Sun et al., 2012).
The atmospheric component, IAP AGCM4, with a horizontal resolution of 1.4°×1.4° and 26 vertical layers, is a newly developed atmospheric general circulation model from IAP. The dynamical frame design is based on previous IAP models, and the physical processes are introduced from the Community Atmospheric Model, Version 3.1 (CAM3.1) of NCAR, which has three schemes. In this model, the Emanual scheme is used. The model is similar to CAM3.1 in simulating the basic features of the global climate ( Zhang et al., 2009, 2011; Dong et al., 2012). The oceanic component, LICOM 1.0, is a modified version of the third version of the ocean general circulation model developed at LASG, IAP ( Liu, et al., 2004). The land component (CLM3) and sea ice component (CSIM5) are both developed at NCAR ( Dickinson et al., 2006). For more detailed information about the CAS- ESM-C, see Sun et al. (2012).
In this study, the CAS-ESM-C was integrated for 550 years. External forcing, including both natural and anthropogenic forcing, was fixed in our experiment. As is described in the control experimental design in the fifth phase of the Climate Model Intercomparison Project (CMIP5), CO2concentration (total solar irradiance) is set to a constant value of 286.3 ppm (1365 W m-2), while the volcanic forcing is not considered. Results from 450 to 550 were adopted to analyze the decadal variation of the AIS. Because the PDO is an internal process of the coupled air-sea system ( Yang et al., 2004), it may have little effect on our main results, as external forcing was excluded from our experimental design.
To evaluate the spatial pattern of the long-term mean sea level pressure (SLP) simulated by the CAS-ESM-C, monthly mean SLP observational data (HadSLP2) derived from the Hadley Centre were adopted ( Allan and Ansell, 2006). The winter (December-February, DJF) mean SLP was calculated for the period 1900-1999 using HadSLP2.
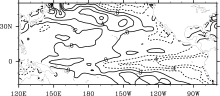
Before exploring the AIS, the climatology of SLP in boreal winter was evaluated. It was shown that the CAS- ESM-C can reasonably reproduce the spatial distribution of the SLP, especially the three main action centers including the AL, IL, and Siberian High (Fig. 1). Both the location and magnitude of the action centers were simulated by the CAS-ESM-C and compared to observations. It is interesting to note that while the simulated location of the AL in the IAP AGCM4 is more westward than the observation ( Dong et al., 2013), the AL in the CAS-ESM- C is well reproduced, but with a little eastward shift. Why this bias is rectified when air-sea coupling is taken into consideration remains unclear.
 | Figure 1 Climatology of sea-level pressure (SLP) in the Northern Hemisphere in boreal winter (DJF) (units: hPa): (a) observation; (b) simulation by the Chinese Academy of Sciences-Earth System Model-Climate system component (CAS-ESM-C). Regions with SLP values less than 1004 hPa are shaded. |
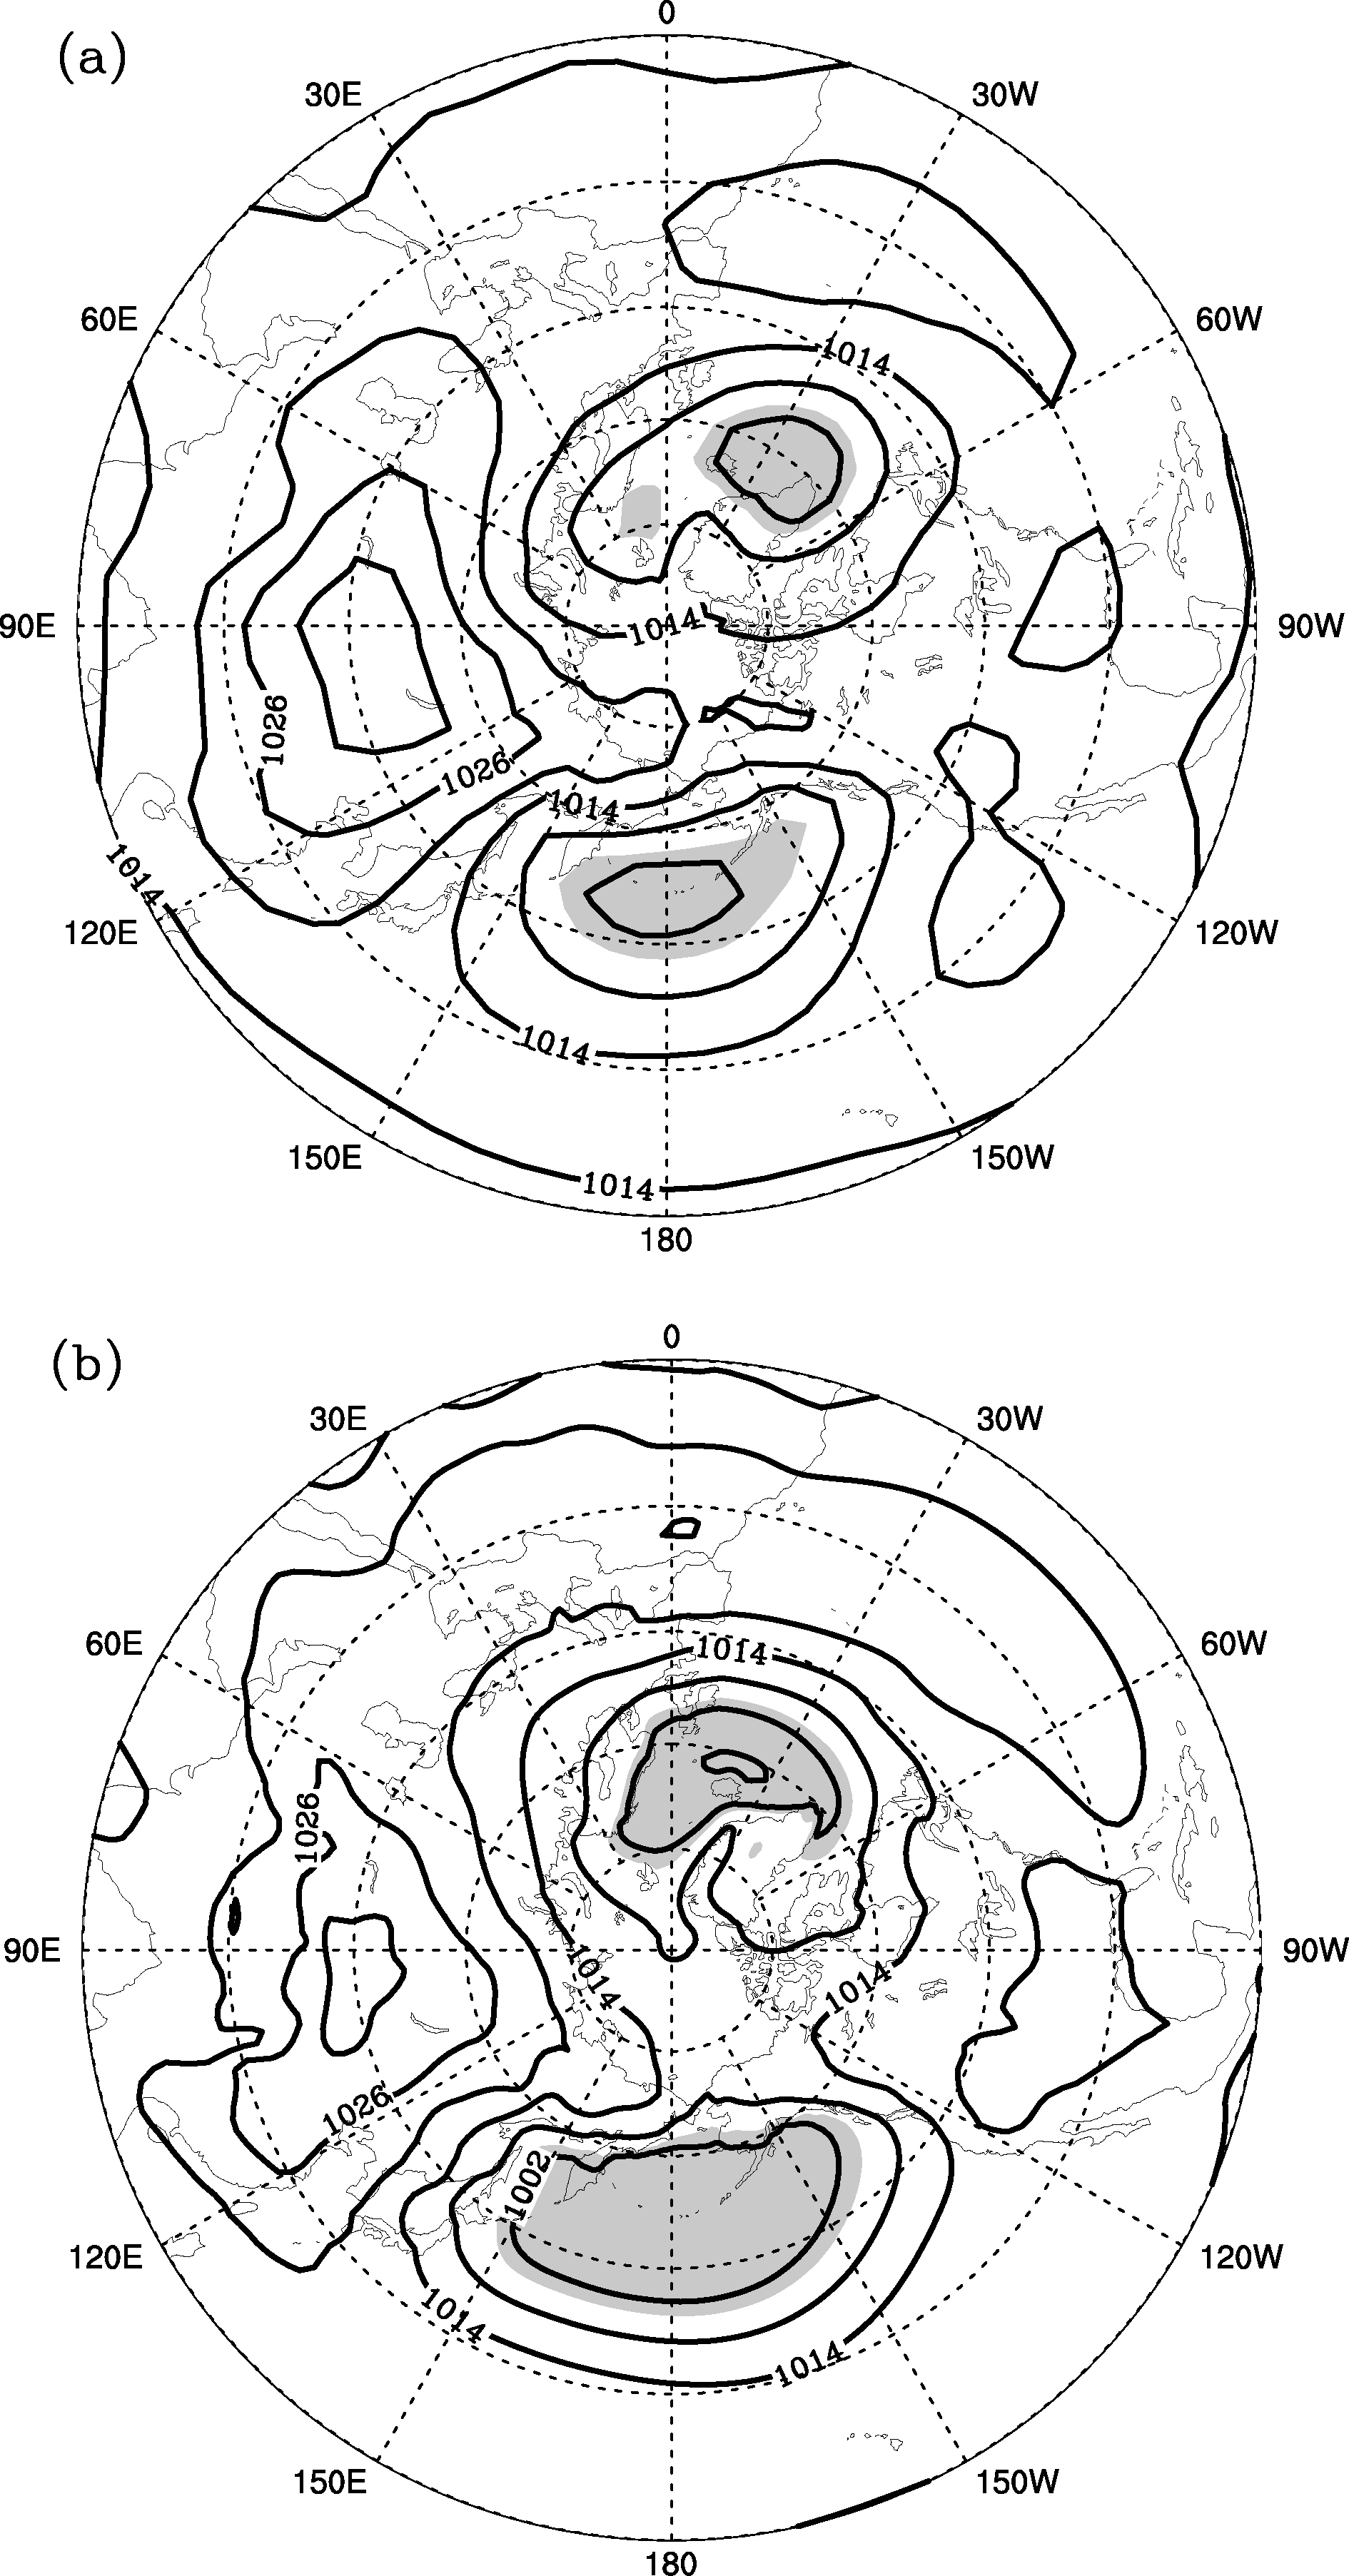
According to the definition of the AL and IL in Dong et al. (2013), the AL and IL in this study are defined as SLP-averaged over (40-60°N, 160°E-160°W) and (55-65°N, 15-35°W), respectively. Table 1 shows the correlation coefficient between the simulated AL and IL during the period 450-550 in each month during the winter half year (October to March). The relationship between the simulated AL and IL is more notable in January (-0.23) than in any other months. Thus in the following analysis, only the simulated AL, IL, and the associated variables in January are investigated. The 11-yr running mean time series of AL and IL in January are displayed in Fig. 2a, shedding light on the decadal component. It is notable that the AL and IL have an intimately inverse relationship with a correlation coefficient of -0.51.
| Table 1 Correlation coefficient between the Aleutian Low (AL) and Icelandic Low (IL) during the period of 450-550 in different months of the winter half year (October to March). |
As in Dong et al. (2013), the 21-yr running correlation coefficient was calculated based on the raw time series of AL and IL, in order to investigate the stability of the inverse correlation between the two lows (Fig. 2b). Thedashed line indicates the value of -0.41, below which the negative correlation is at a 95% confidence level. It is shown that during the period 496-515 (P1), the AL and IL have the most significant negative correlation. After 516, the correlation tends to weaken, indicating a decadal variation of the AIS. We then further analyzed the decadal variation of the AIS between the two sub-periods: P1 and 516-535 (P2).
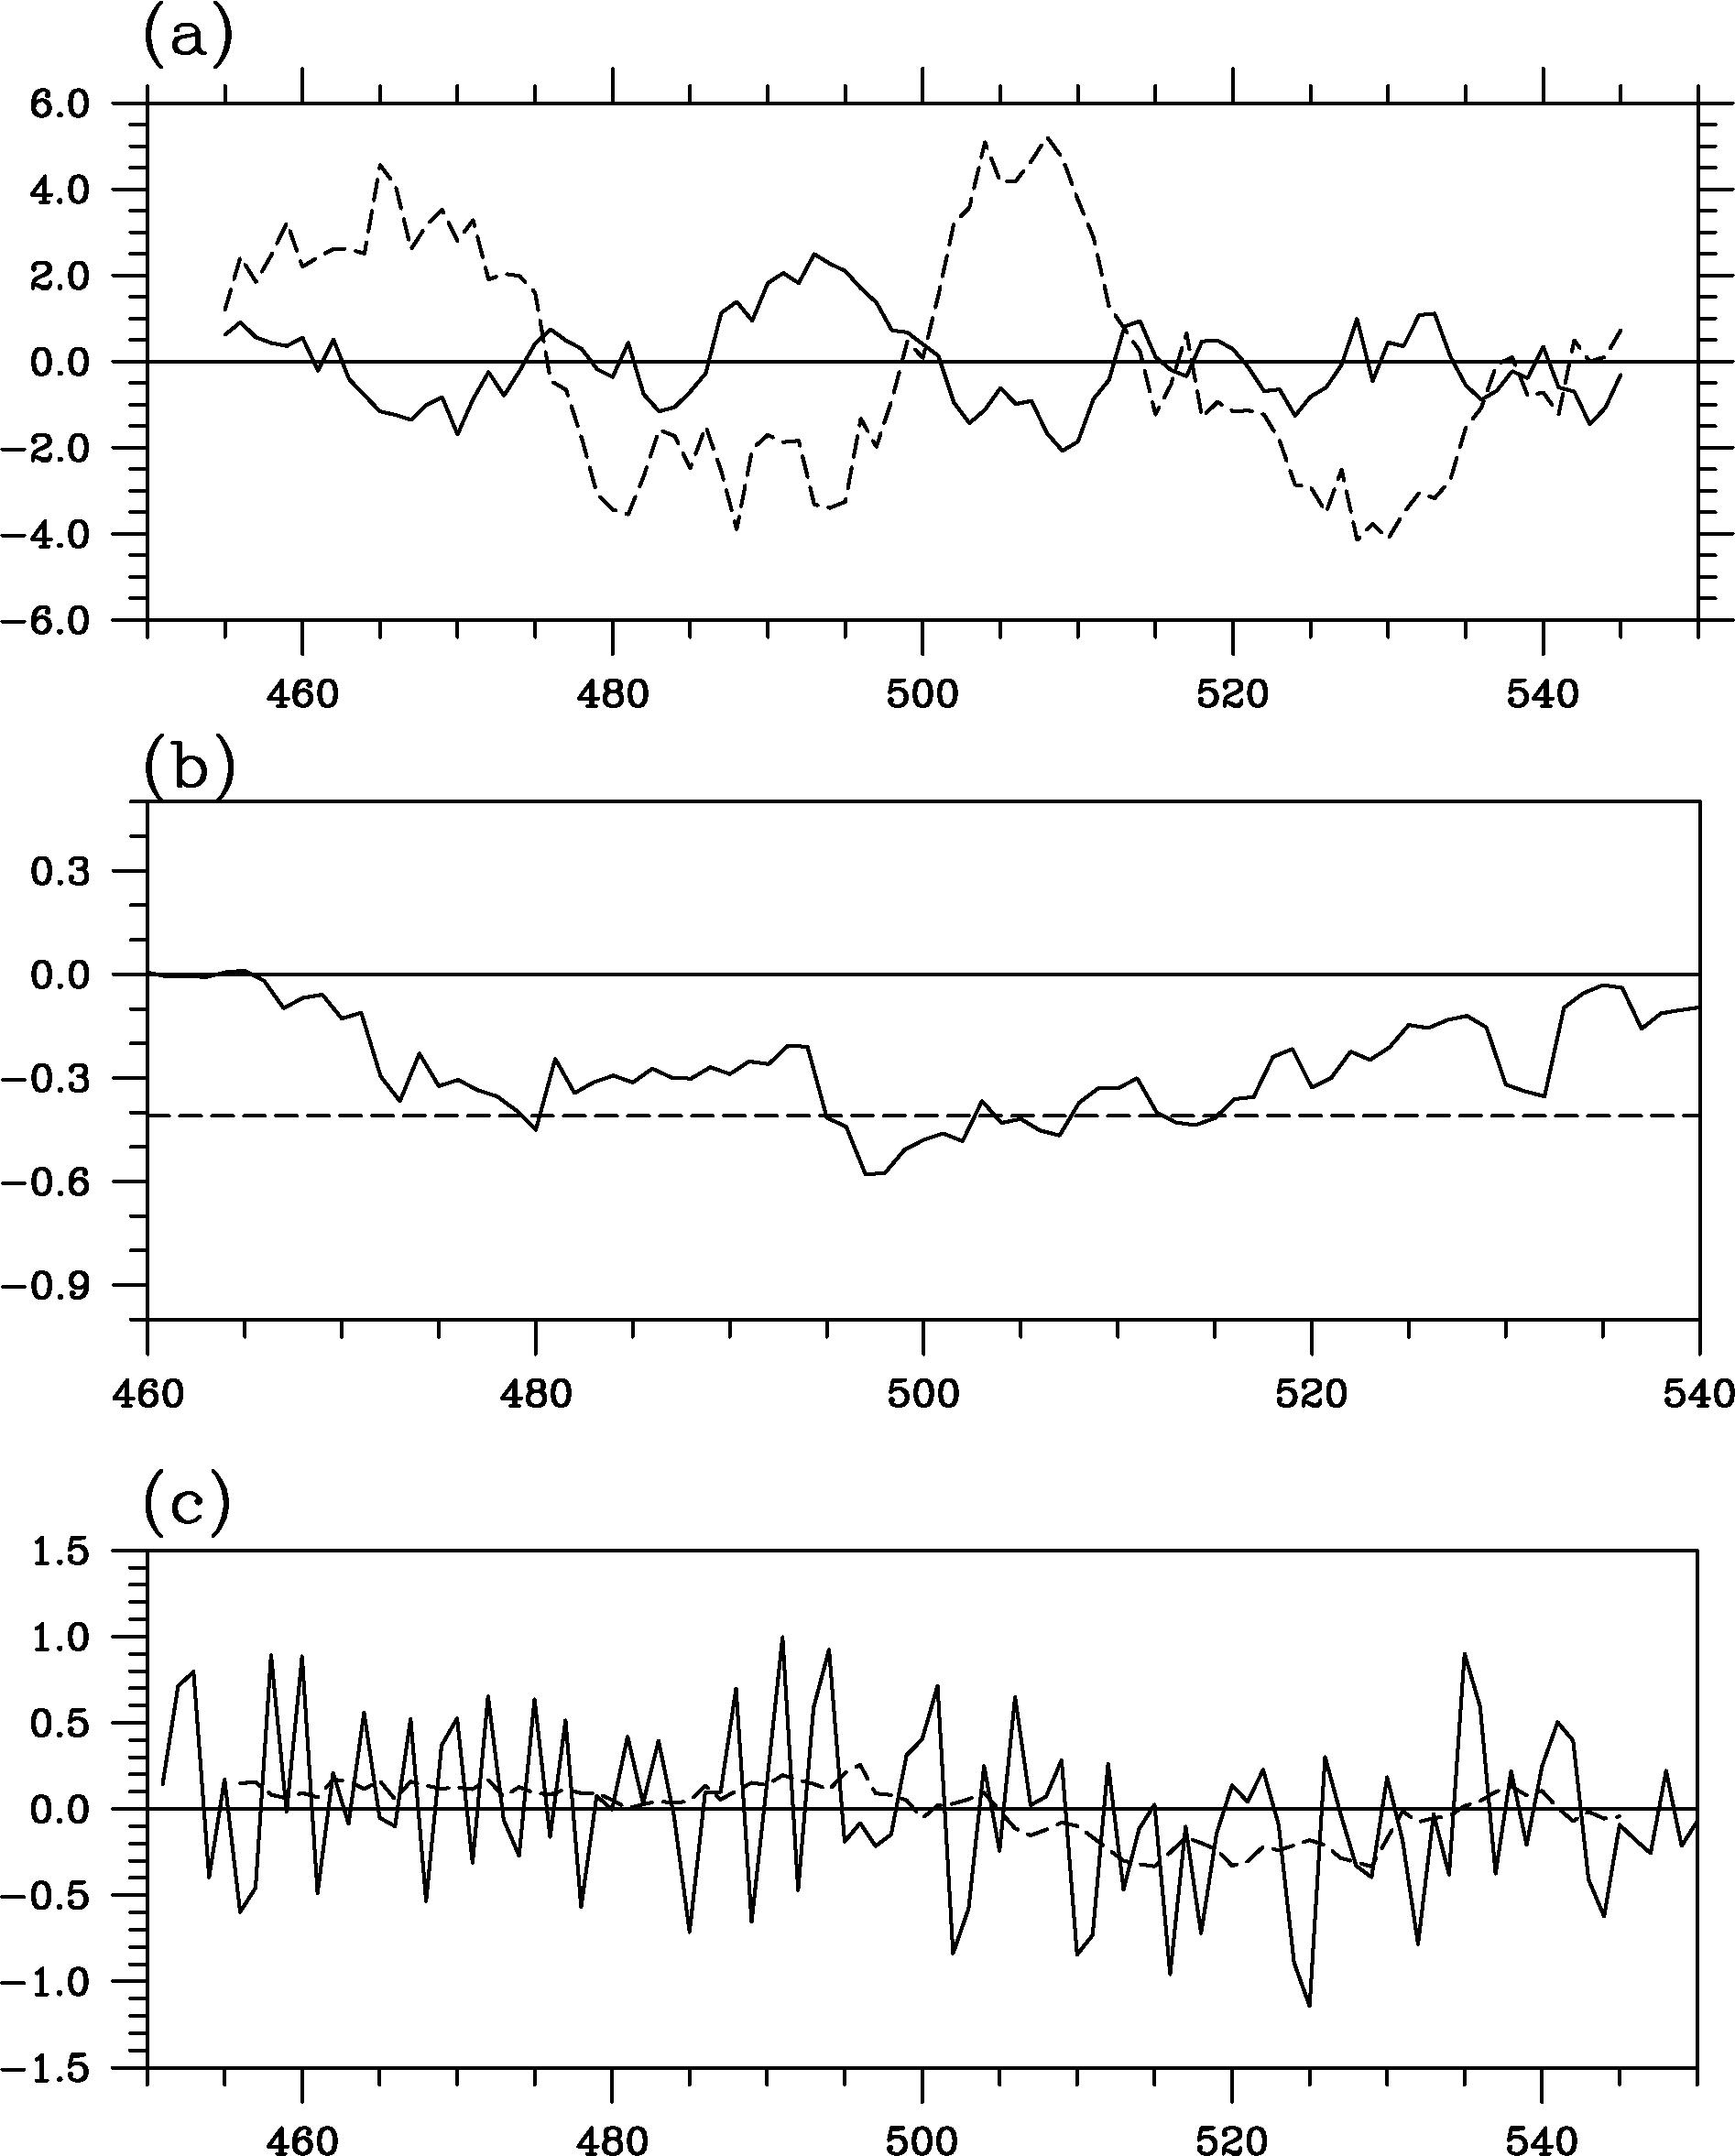 | Figure 2 (a) 11-yr running mean time series of AL (solid) and IL (dashed) in January. (b) 21-yr running correlation of AL and IL. The value of the dashed line is -0.41, which means it exceeds the 95% confidence level. (c) The simulated time series of PDO (the Pacific Decadal Oscillation) index (solid line) and its 11-yr running mean (dashed line). |
Figure 3 shows the spatial distribution of the correlation coefficient between the AL and the Northern Hemispheric SLP in the separate periods P1 and P2, respectively. In P1, the AL has a close negative correlation with the IL region, while in P2 the correlation between them weakens. Meanwhile, compared to P1, the negative correlation region around the North Pole in P2 extends further to northern Asia. Alongside this, the positive correlation between the AL and SLP in Europe strengthens.
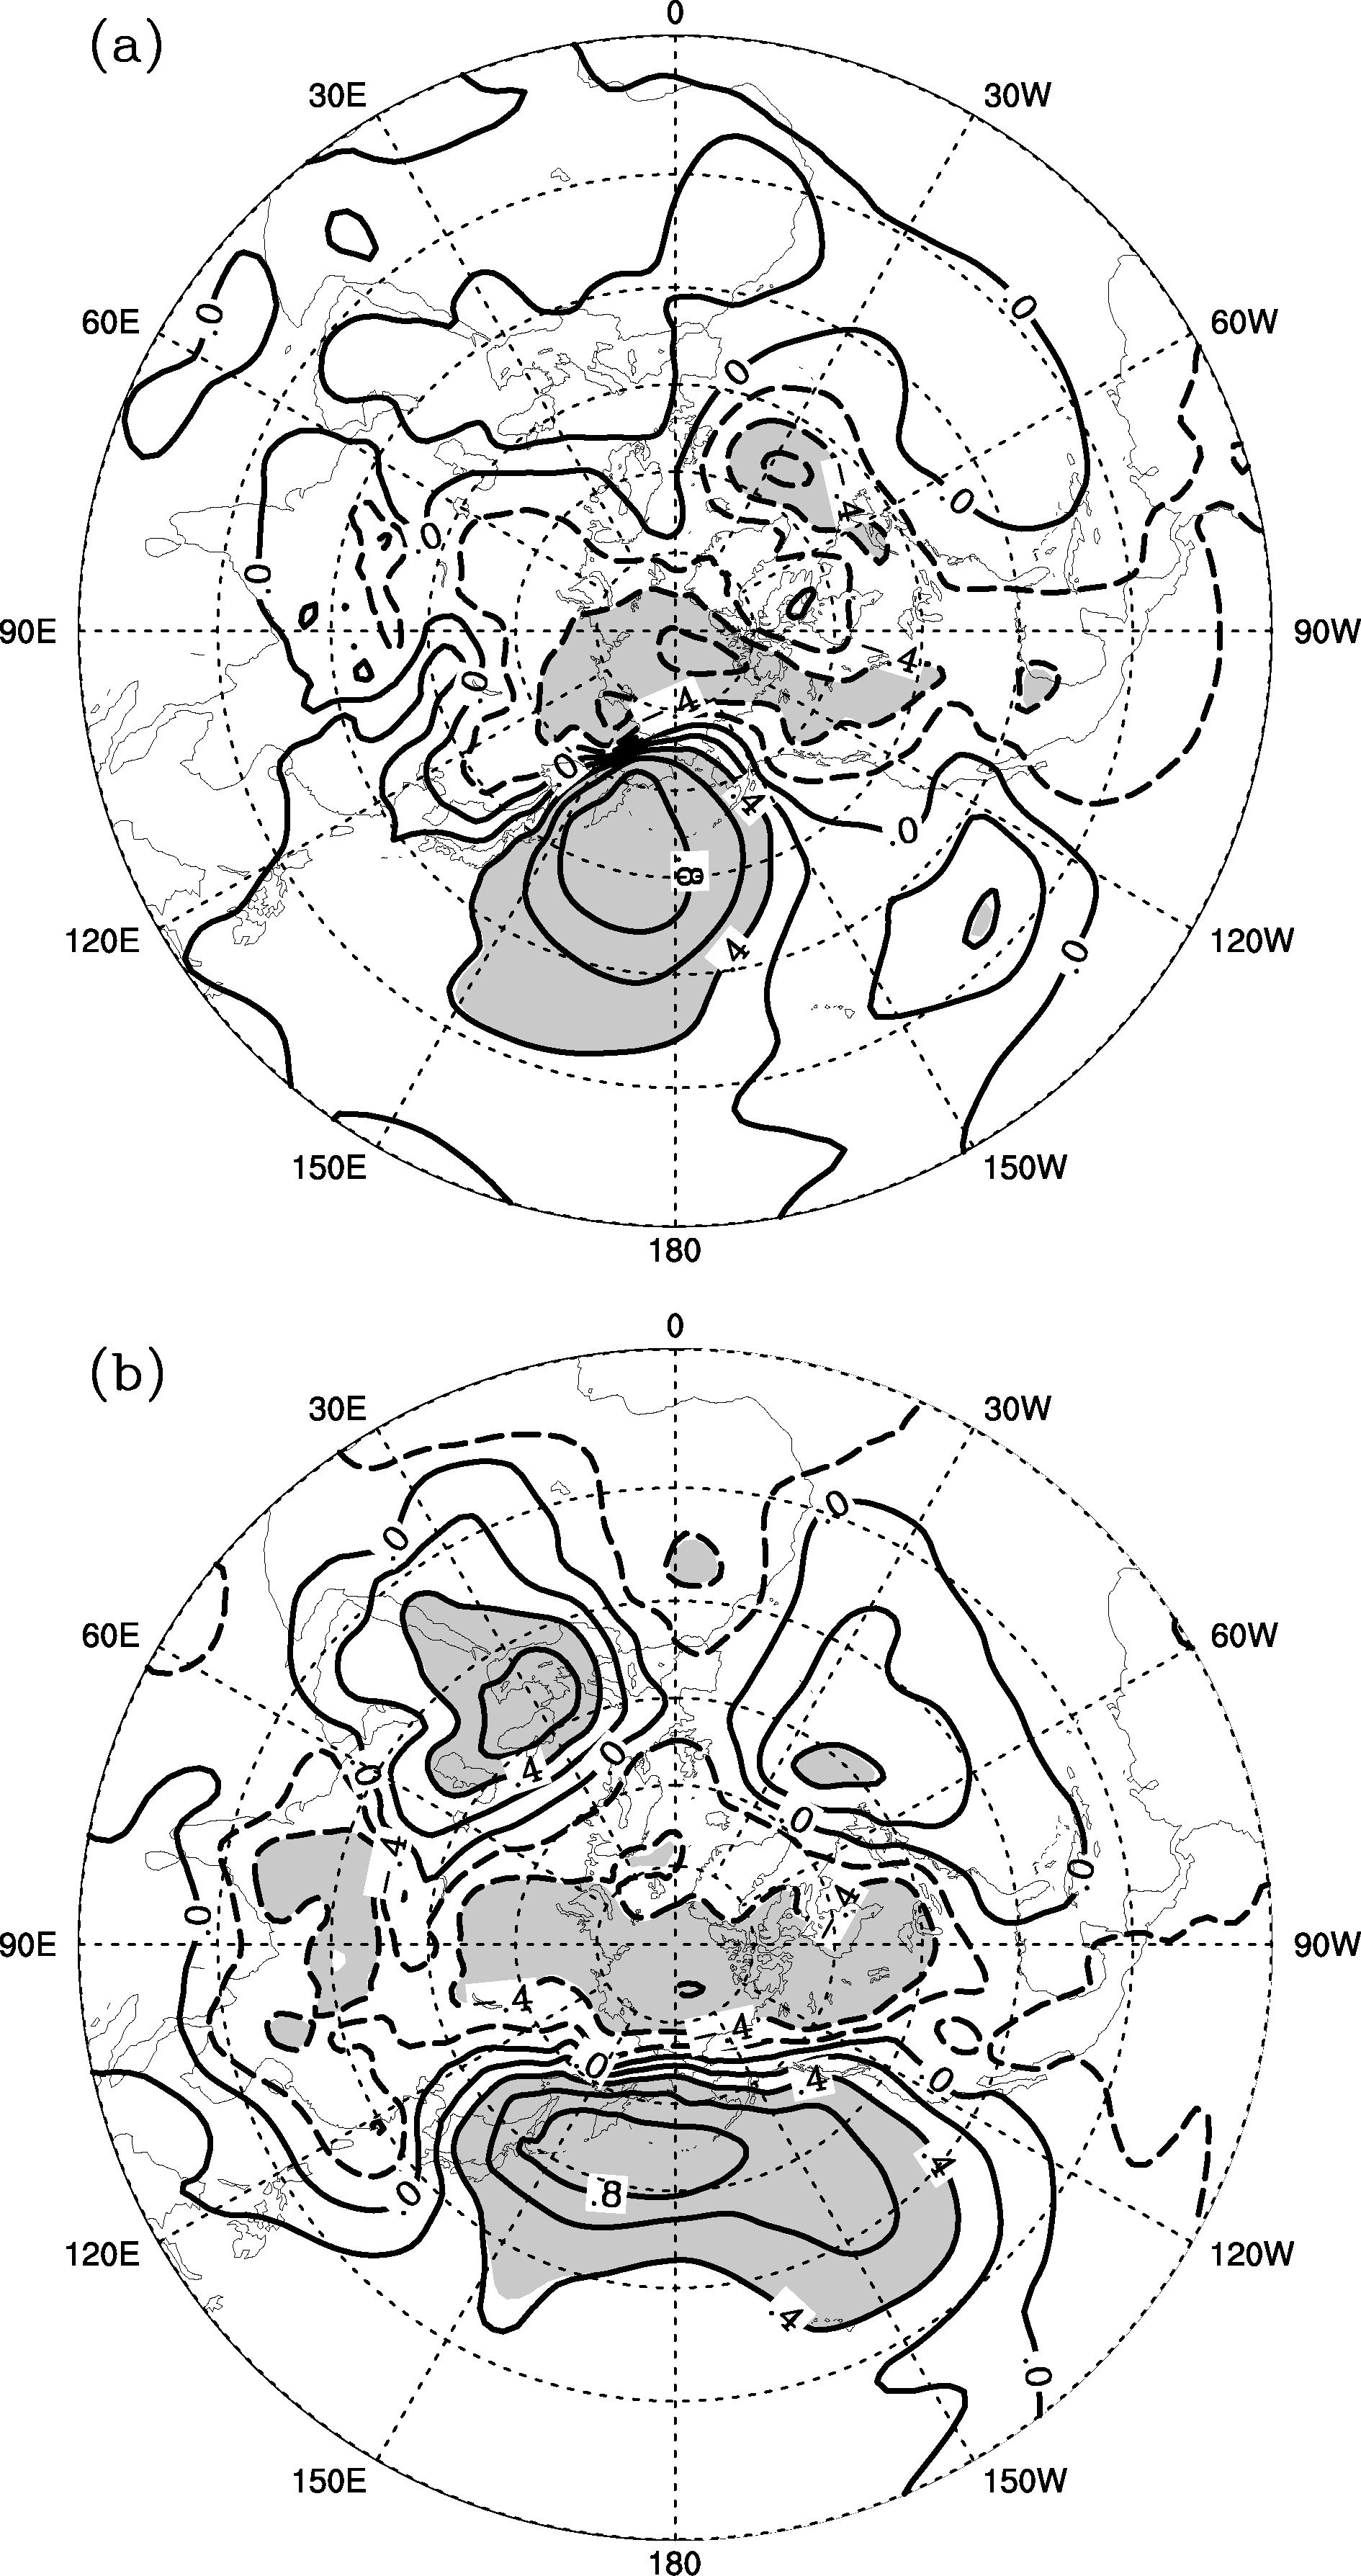 | Figure 3 Correlation coefficient between the AL and SLP in January: (a) 496-515 (P1); (b) 516-535 (P2) (units: dimensionless). Regions above the 95% confidence level are shaded. |
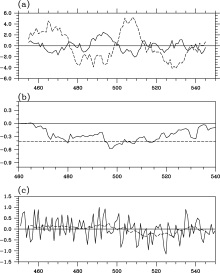
Based on the conclusion drawn by Dong et al. (2013), the decadal variation of the AIS may be due to the phase transition of the PDO and the associated decadal variation of the SST in the northern Pacific. The simulated difference of the SST in the northern and tropical Pacific between P2 and P1 is shown in Fig. 4. It is evident that the SST in the eastern tropical (northern) Pacific experiences decadal cooling (warming). This pattern is reminiscent of the decadal variation of the PDO from its positive phase to its negative phase.
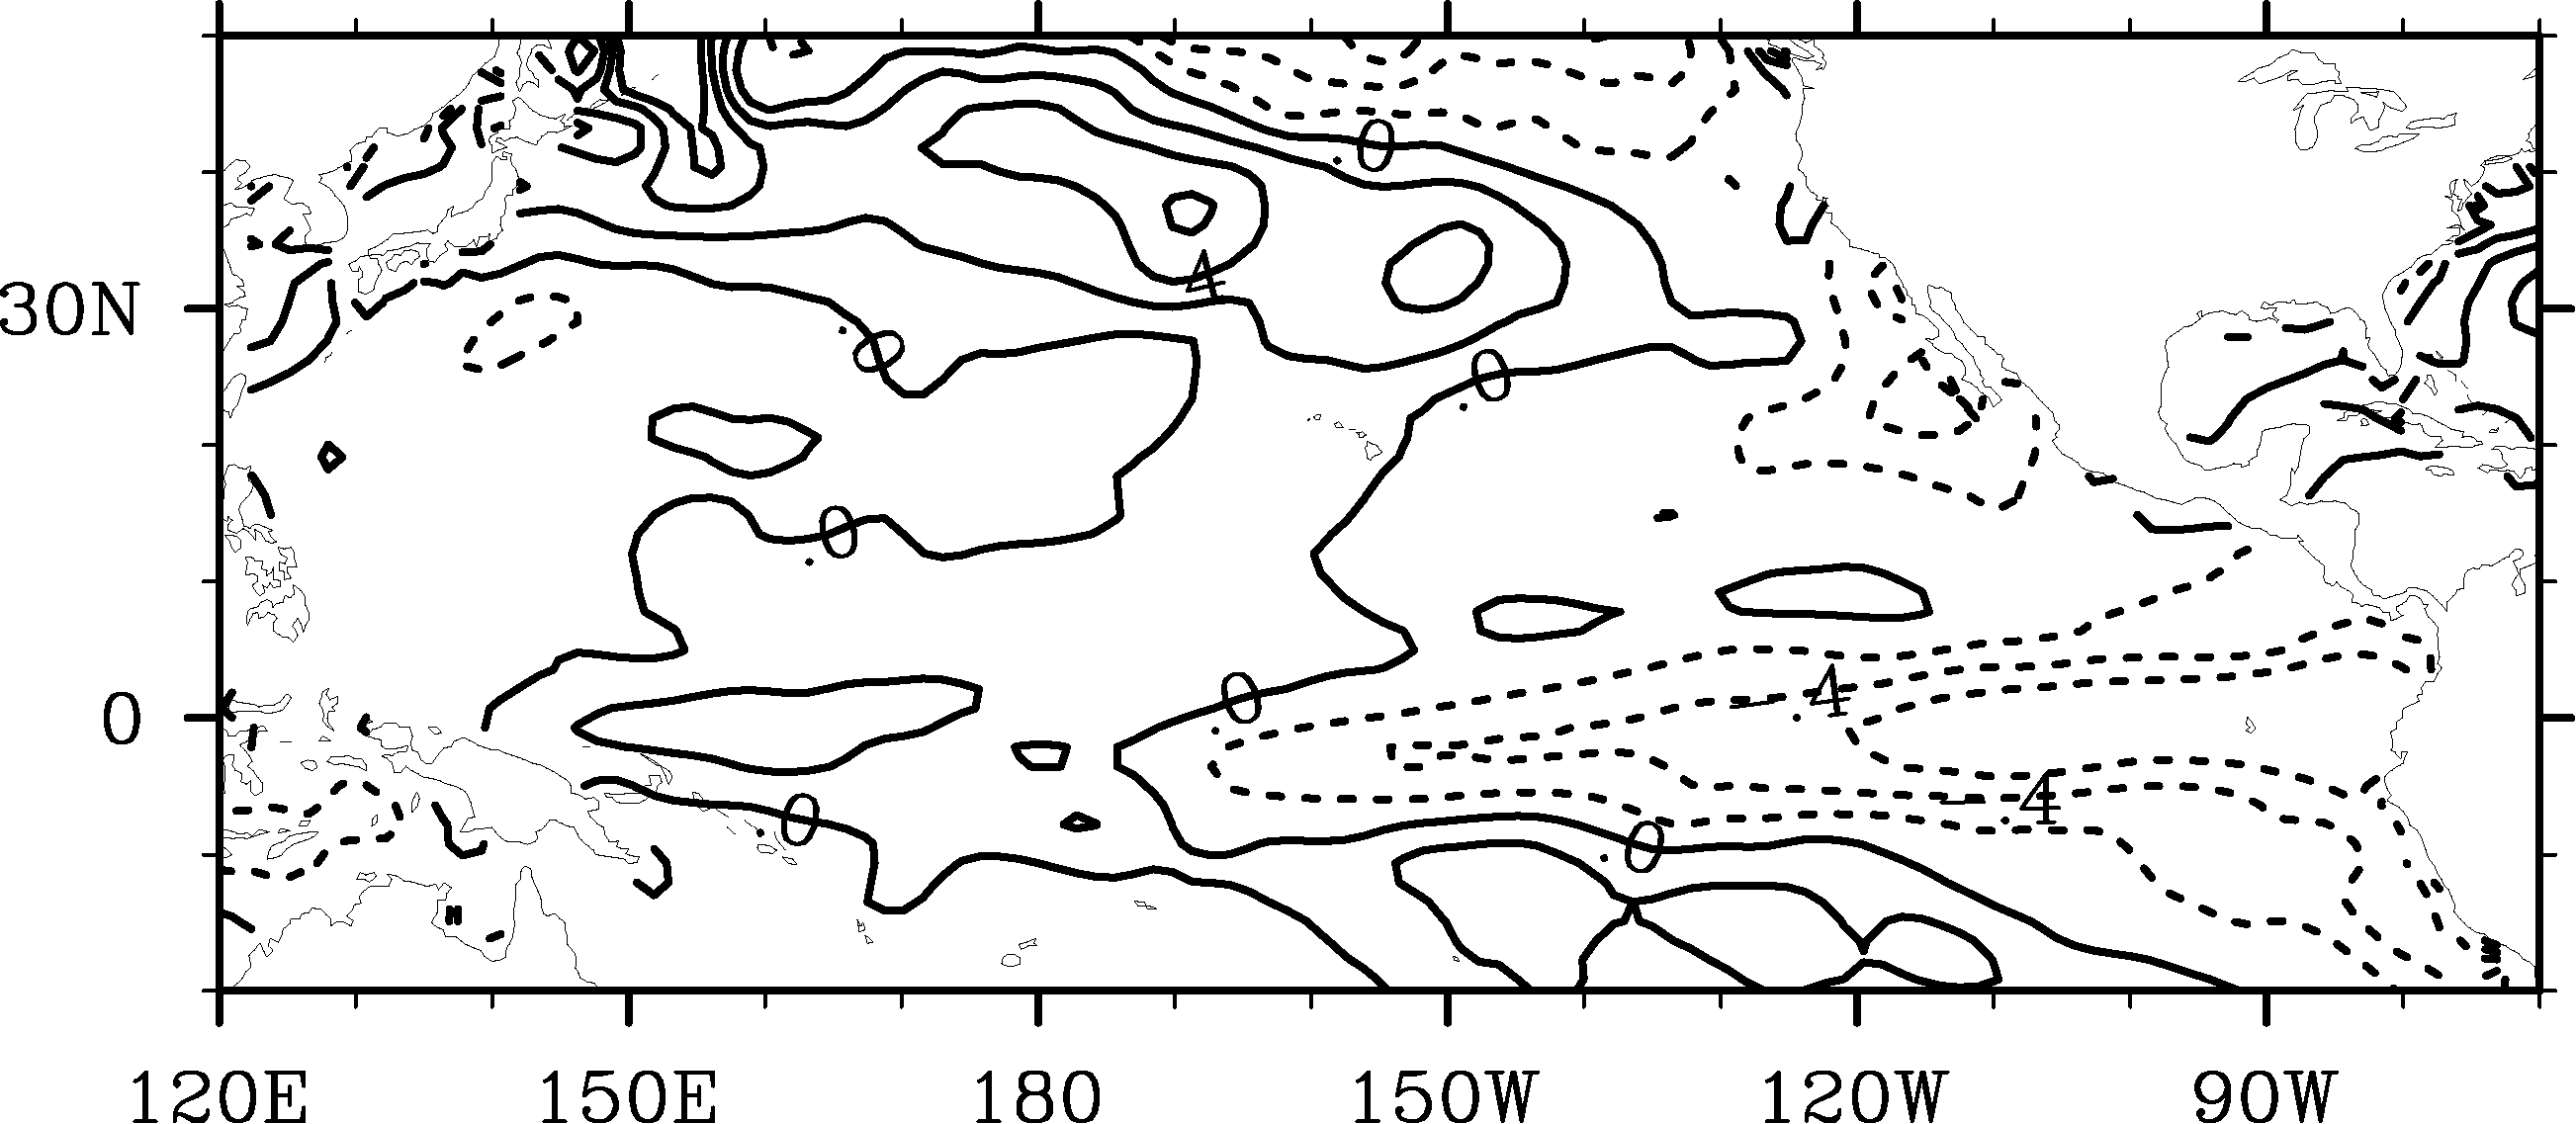 | Figure 4 The epoch difference of mean SST in January between P2 and P1 (units: °C). |
Before examining the temporal variation of the PDO simulated by the CAS-ESM-C, the spatial pattern of the simulated PDO was evaluated (not shown). In general, the CAS-ESM-C can reasonably reproduce the spatial distribution of the PDO and the regressed pattern of the SST in the tropical eastern and northern Pacific on the PDO index. Therefore, the time series of the PDO index, which is defined as the leading principal component (PC1) of the North Pacific monthly mean SST variability (poleward of 20°N) ( Zhang et al., 1997), is displayed in Fig. 2c. It can be seen that from P1 to P2, the PDO experiences a notable decadal phase transition from positive phase to negative phase, which is consistent with the results in Fig. 4.
Associated with the decadal variation of the SST, the atmospheric general circulation also experiences a notable decadal variation. The epoch difference of the 500-hPa wind field between P2 and P1 simulated by the CAS- ESM-C show that decadal weakening of the westerlies over the northern Pacific is notable (not shown). This may be due to the weakening of the meridional temperature gradient associated with the phase transition of the PDO. The weakening of the westerlies in the mid-latitudes may thus weaken the propagation of the anomaly from the northern Pacific to the northern Atlantic through the dispersive process of Rossby waves. Furthermore, the epoch difference of the 500-hPa wave activity flux of the spherical, quasi-geostrophic, quasi-stationary planetary wave ( Plumb, 1985) between P2 and P1 verifies the conclusion (not shown).
Based on the control simulation using a newly developed climate system model (CAS-ESM-C), we investigated AIS and its decadal variation. Results showed that the CAS-ESM-C can not only reasonably reproduce the spatial distribution of the climatology of SLP in boreal winter, but also simulate the AIS and its decadal variation.
In the period 496-535 of the control integration, the AIS experienced a notable decadal weakening. Therefore, the period 496-535 of the model run was divided into two sub-periods: P1 and P2 to further investigate the relationship between the decadal weakening of the AIS and the phase transition of the PDO. It was shown that with the phase transition of the PDO, the SST in the equatorial eastern (north) Pacific is cooling (warming), resulting in the decadal weakening of the mid-latitude westerly over the north Pacific and north Atlantic. This may induce the weakening of the inverse relation between the AL and the IL, which is consistent with the conclusion in our earlier work.
It is noted that, the decadal variation of the AIS in this study appears as a gradual process, which looks like the decadal variation in the 1930s found by Dong et al. (2013). However, the decadal variation in the late 1970s in Dong et al. (2013) seems to be a sudden change. The difference between these two types of decadal variation of the AIS may be associated with different features of the two phase transitions of the PDO. Dong et al. (2013) noted that the decadal variation of the PDO in the 1930s was weaker than that in the late 1970s. What causes the two types of decadal variation deserves further study.
| 1 |
|
| 2 |
|
| 3 |
|
| 4 |
|
| 5 |
|
| 6 |
|
| 7 |
|
| 8 |
|
| 9 |
|
| 10 |
|
| 11 |
|
| 12 |
|
| 13 |
|
| 14 |
|
| 15 |
|
| 16 |
|
| 17 |
|
| 18 |
|
| 19 |
|
| 20 |
|
| 21 |
|
| 22 |
|
| 23 |
|
| 24 |
|
| 25 |
|
| 26 |
|