Comparative Analysis of Extreme High Temperature Weather in the Summers of 2013 and 2003
ZHANG Li-Sheng , XUE Jian-Jun, WANG Wei-Guo, SUN Jin
, XUE Jian-Jun, WANG Wei-Guo, SUN Jin 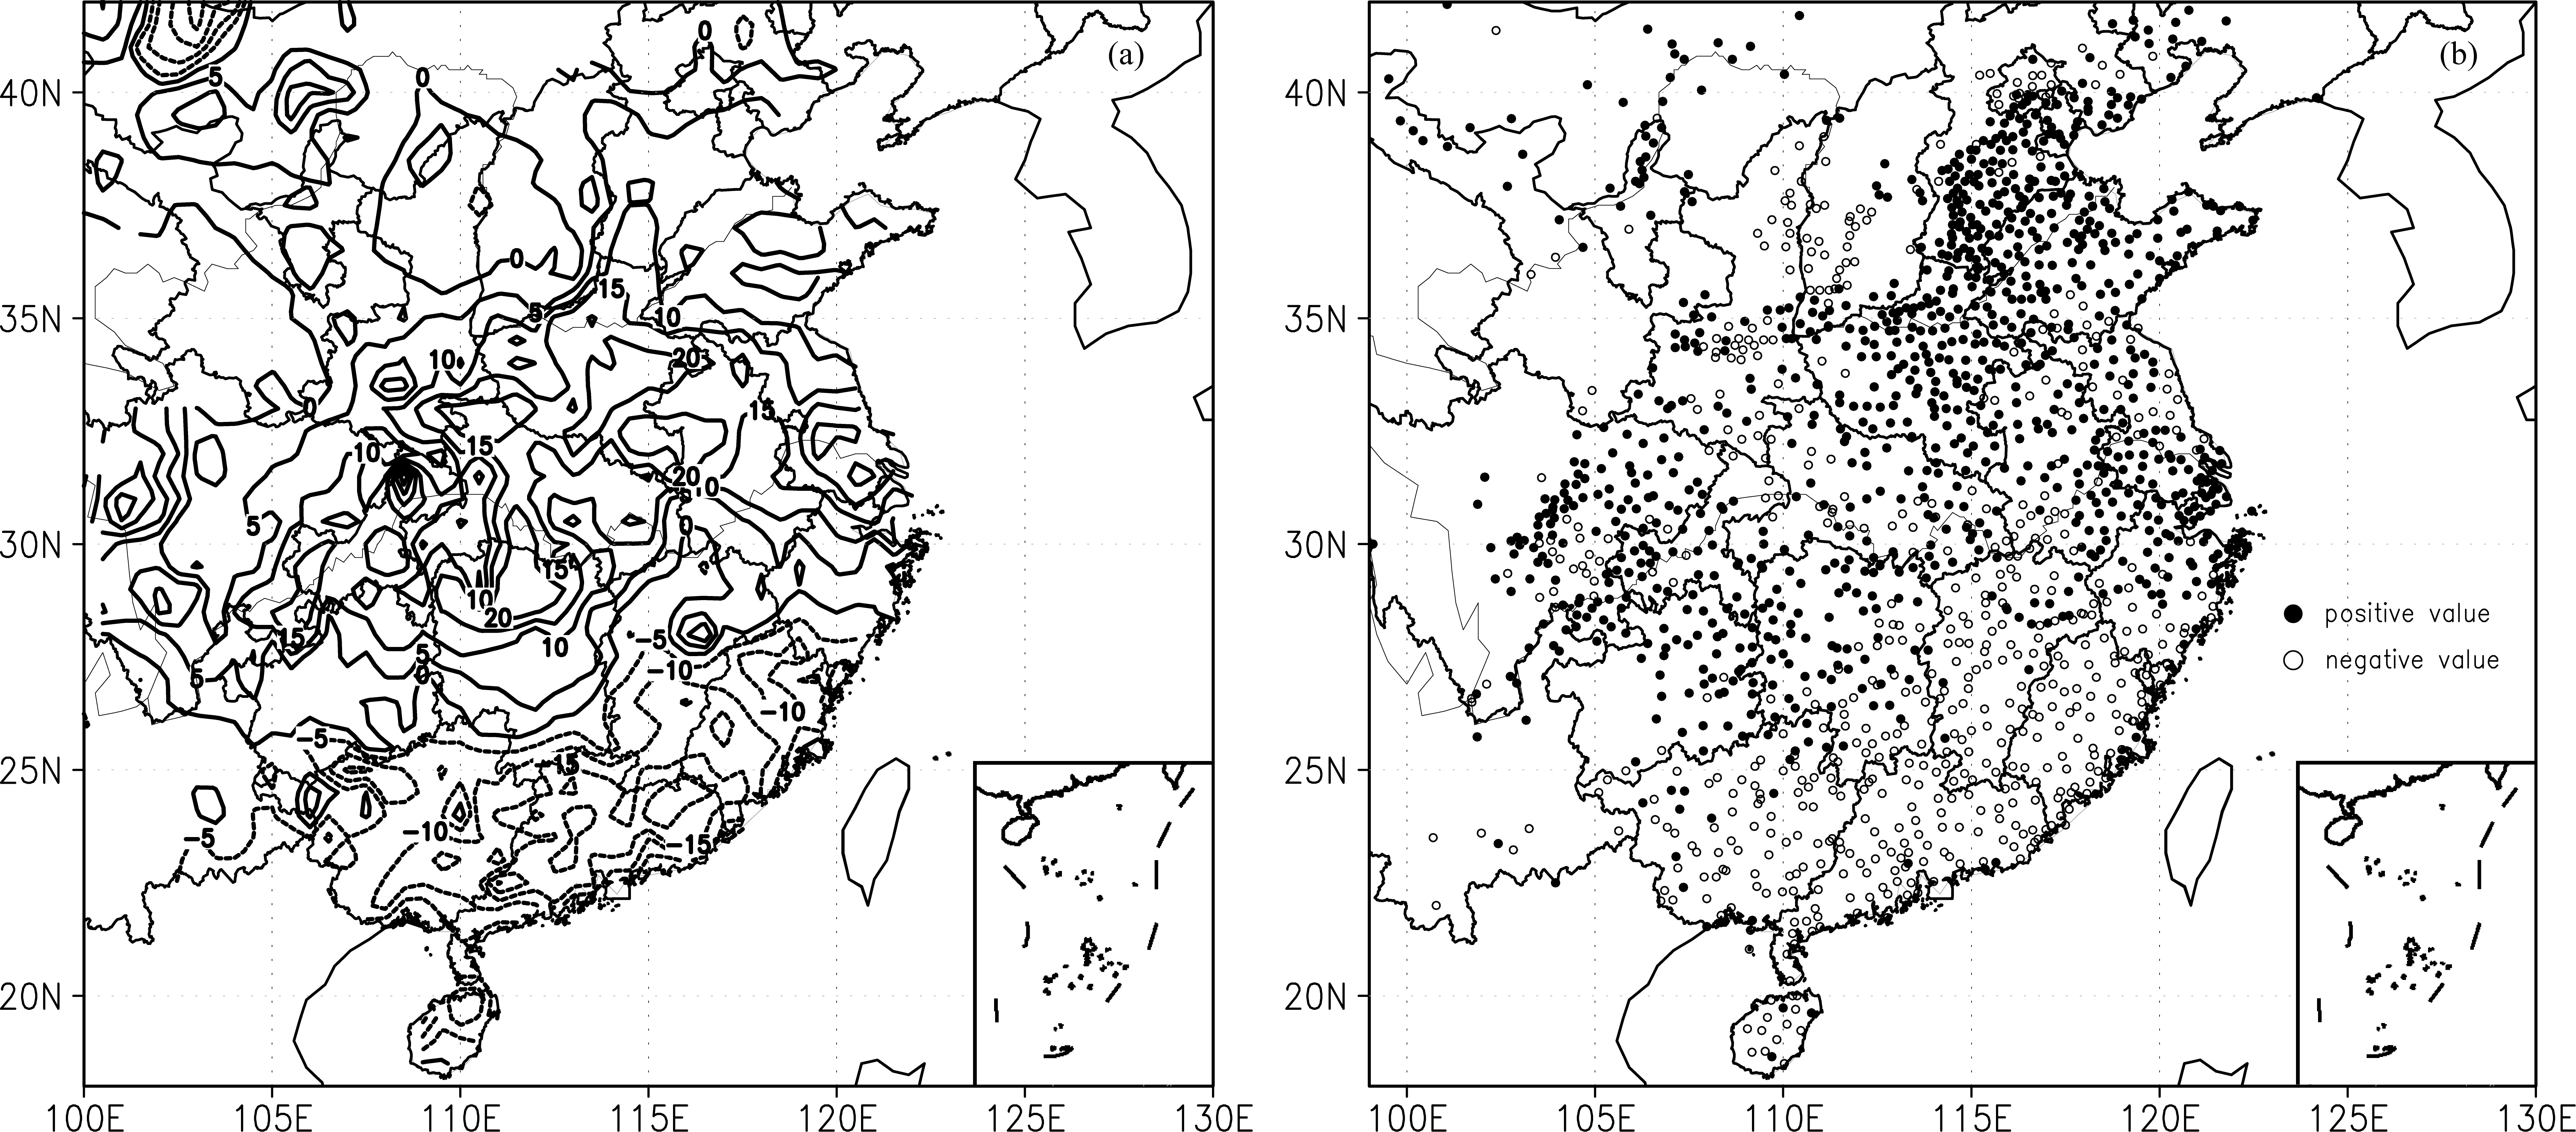
Comparative Analysis of Extreme High Temperature Weather in the Summers of 2013 and 2003 |
|
ZHANG Li-Sheng
, XUE Jian-Jun, WANG Wei-Guo, SUN Jin |
| Figure 2 Differences between a number of HT days units: days and b maximum temperatures between 2013 and 2003, where a positive value or solid dot represents more or higher in 2013 and a negative value or open circle represents more or higher in 2003. |
| |