Assessment of Historical Climate Trends of Surface Air Temperature in CMIP5 Models
FENG Xiao-Li1 , ZHI Hai1 , LIN Peng-Fei2  , LIU Hai-Long
2
, LIU Hai-Long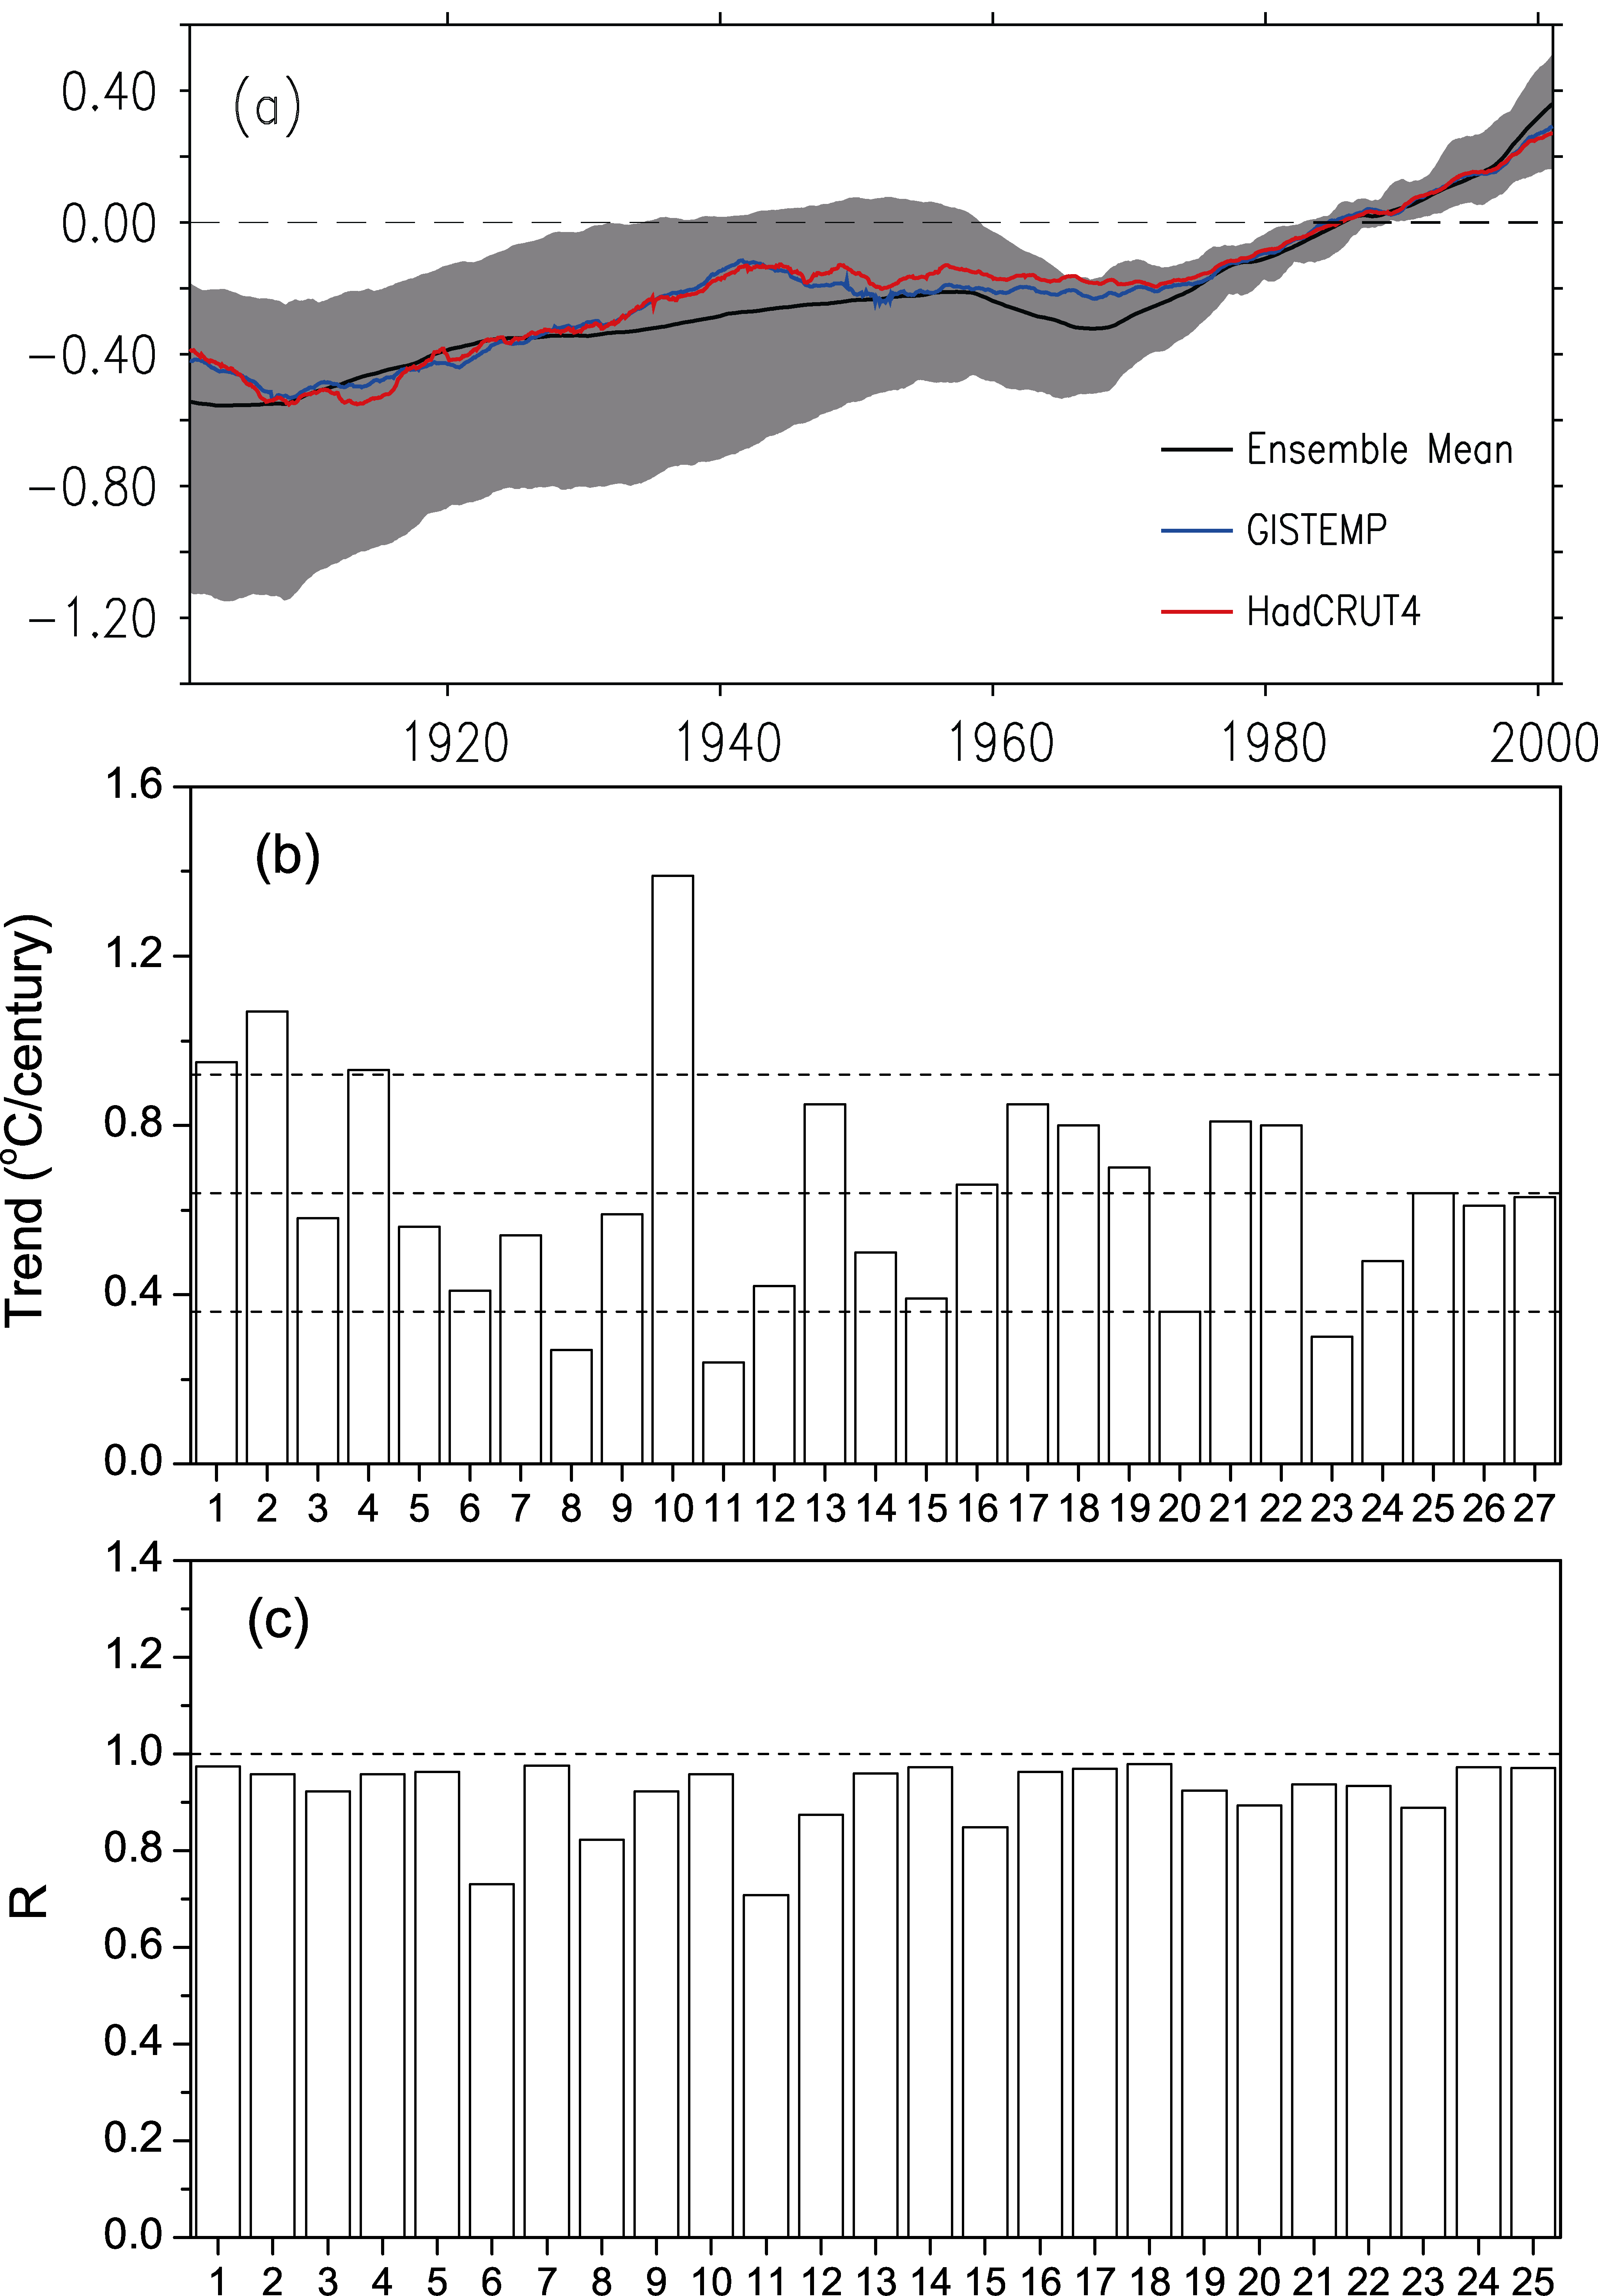
Assessment of Historical Climate Trends of Surface Air Temperature in CMIP5 Models |
|
FENG Xiao-Li
, LIU Hai-Long |
| Figure 1 a Time series of globally averaged 10-year running mean surface air temperature SAT anomalies #cod#x000b0;C, 1901-2000 determined by models and observations Goddard Institute for Space Studies Surface Temperature Analysis GISTEMP and the Met Office Hadley Centre and Climatic Research Unit Latest Version HadCRUT4, b their linear trends #cod#x000b0;Ccentury, and c correlation coefficients between each model and GISTEMP. The gray shaded areas in a represent the zones between the maximum and minimum values from the 24 models. The x -axes in b and c are labeled with the 24 model numbers shown in Table 1 and their ensemble mean value, shown in the 25th column. The 26th and 27th columns in b represent observed trends from GISTEMP and HadCRUT4, respectively. The black dashed lines in b indicate the locations of the ensemble mean trend and ensemble mean trend #cod#x000b1; 1 RMSD. |
| |