Can Current AGCMs Reproduce Historical Changes in the Atmospheric Diabatic Heating over the Tibetan Plateau?
DUAN An-Min1, 3  , XIAO Zhi-Xiang
1, 2 , HU Jun1, 2
, XIAO Zhi-Xiang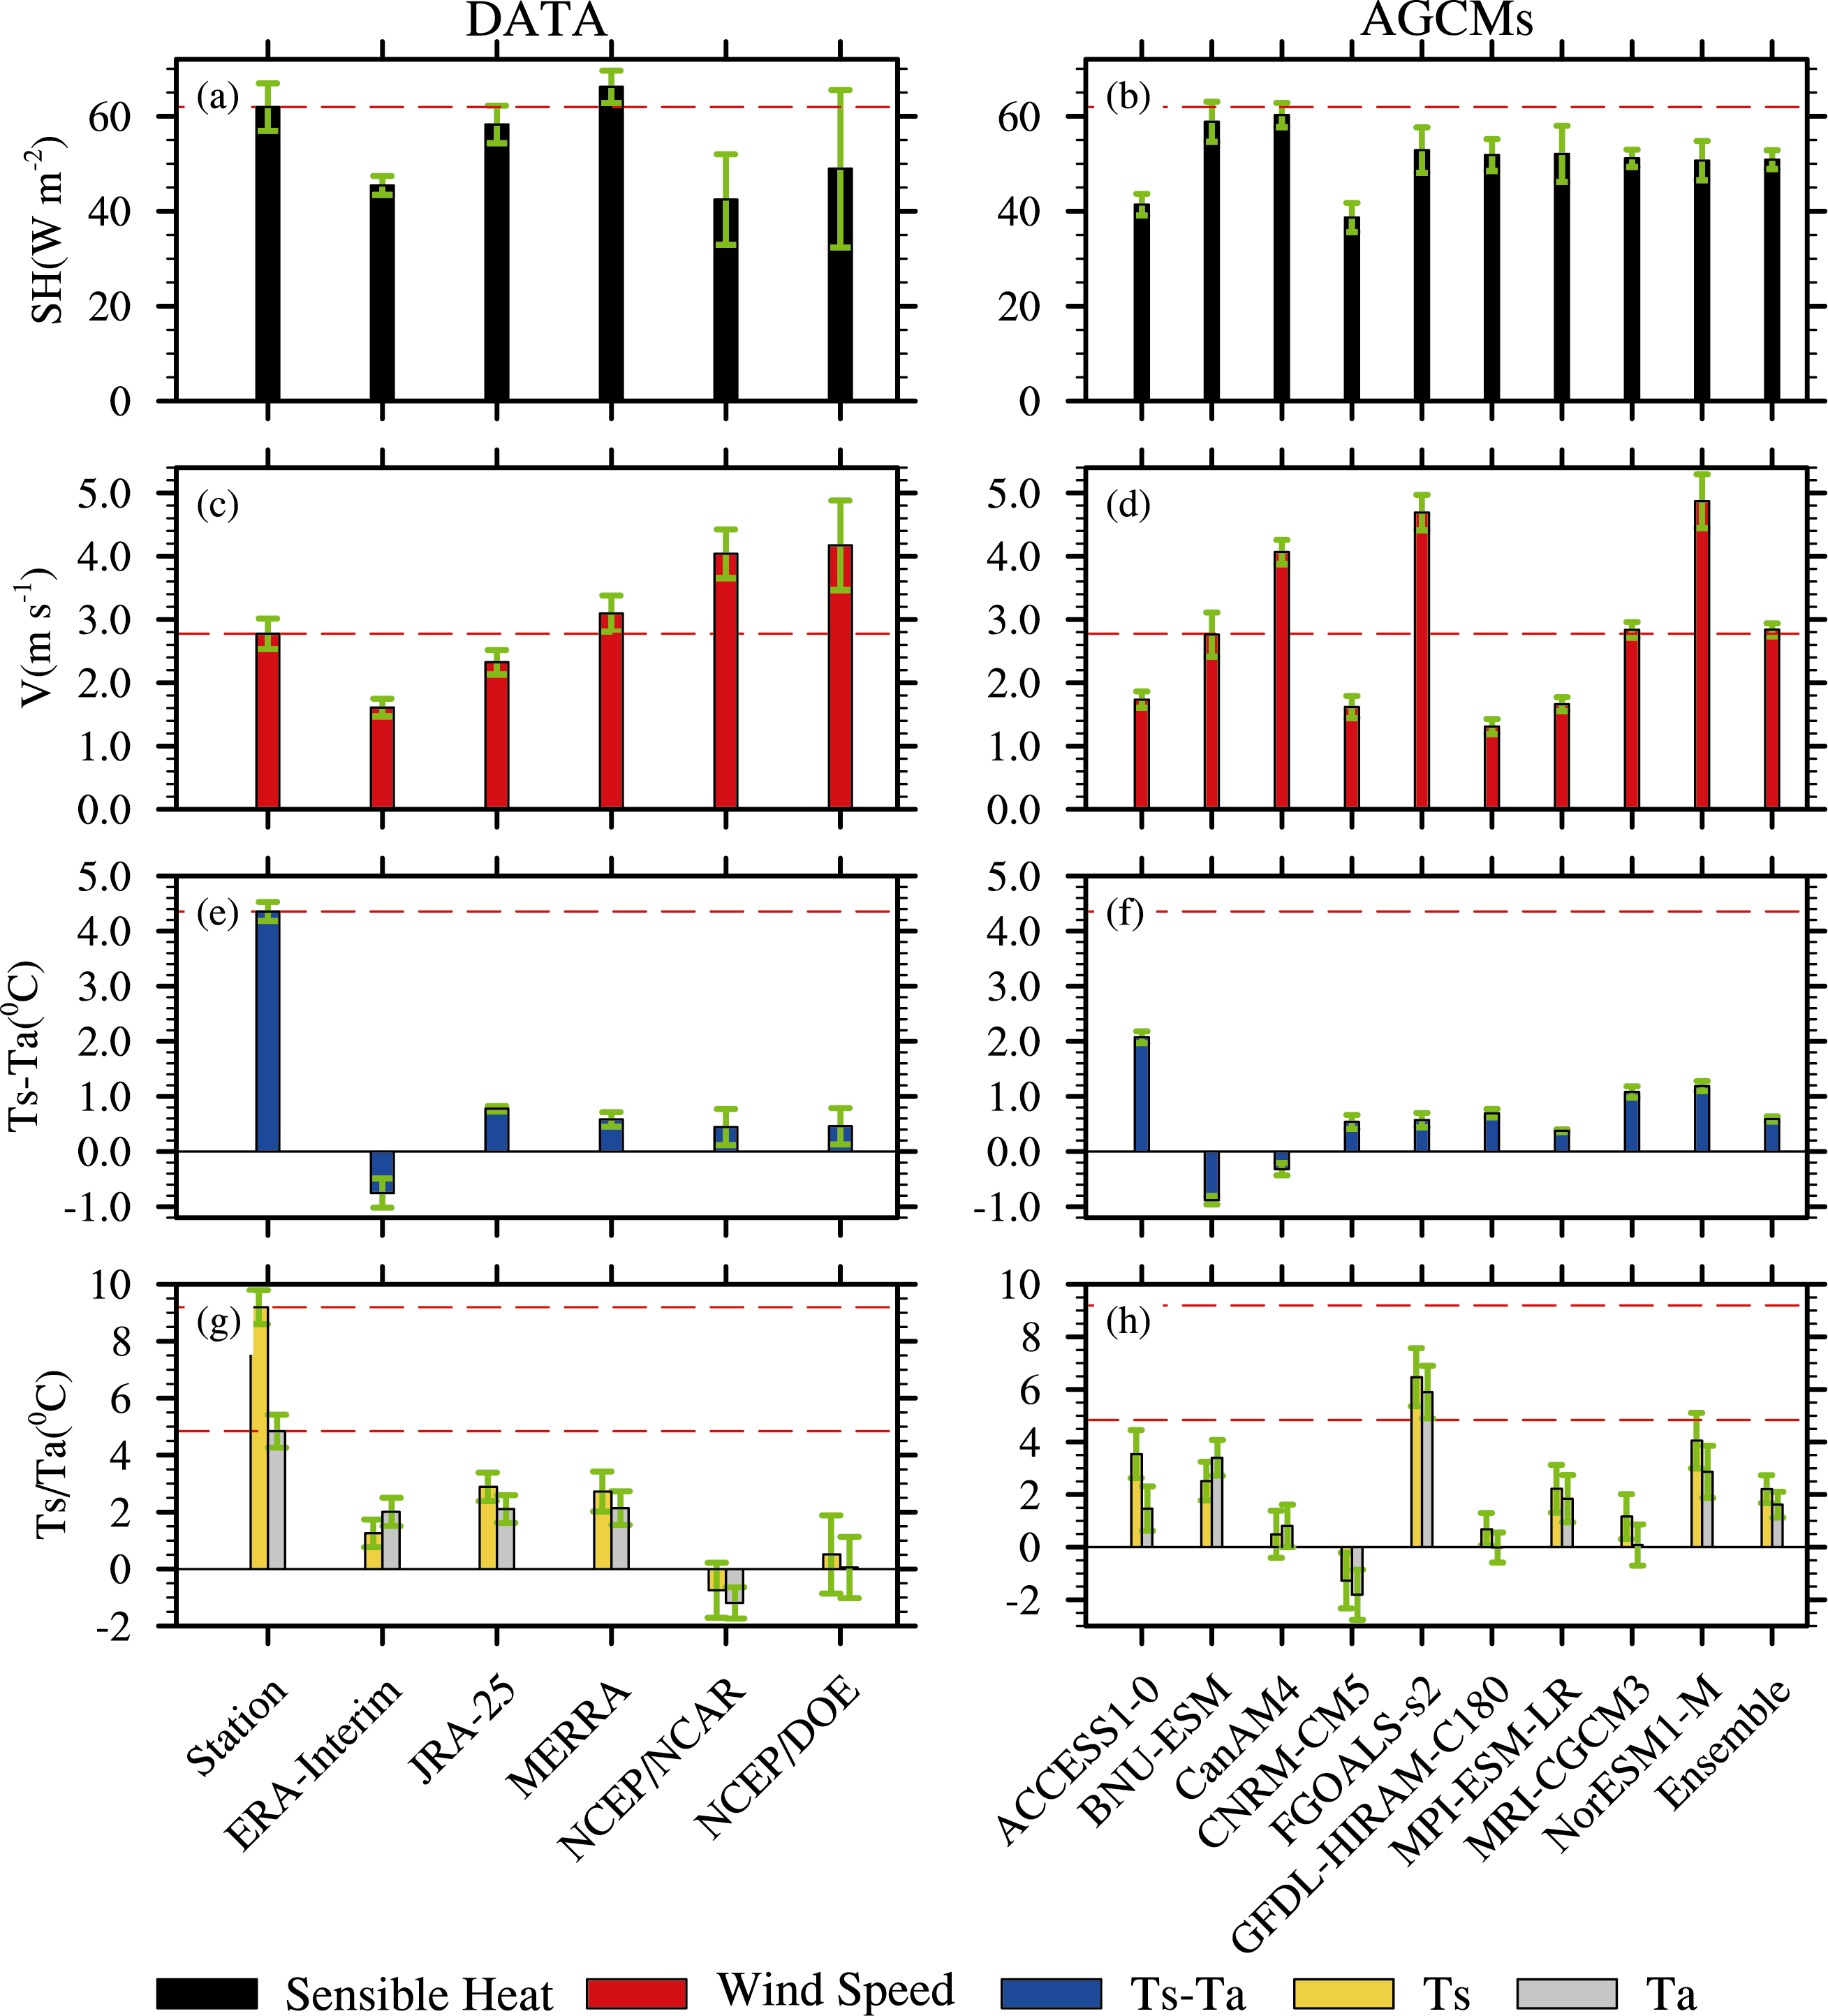
Can Current AGCMs Reproduce Historical Changes in the Atmospheric Diabatic Heating over the Tibetan Plateau? |
|
DUAN An-Min
, XIAO Zhi-Xiang |
| Figure 2 Average for the 71 stations, and results from the five reanalysis datasets and nine AGCMs interpolated onto the locations of 71 stations for: a and b spring mean SH flux W m -2 , c and d 10-m wind speed V m s -1 , e and f T s - T a #cod#x000b0;C, and g and h T s and T a #cod#x000b0;C for 1980- 2005. The red dashed lines denote the corresponding station values and the green bars denote the standard deviation. |
| |