
Evaluation of the WRF Model with Different Land Surface Schemes: A Drought Event Simulation in Southwest China during 2009-10
[HU Zu-Heng1, 2 , XU Zhong-Feng1, 3  , ZHOU Ning-Fang
4 , MA Zhu-Guo1 , LI Guo-Ping2 ]
, ZHOU Ning-Fang|
|


The authors examined the performance of version 3.4.1 of the Weather Research and Forecasting Model (WRF) with various land surface schemes in simulating a severe drought event in Southwest China. Five numerical experiments were completed using the Noah land surface scheme, the Pleim-Xiu land surface scheme, the Noah-MP land surface schemes, the Noah- MP scheme with dynamic vegetation, and the Noah-MP scheme with dynamic vegetation and groundwater processes. In general, all the simulations reasonably reproduced the spatial and temporal variations in precipitation, but significant bias was also found, especially for the spatial pattern of simulated precipitation. The WRF simulations with the Noah-MP series land surface schemes performed slightly better than the WRF simulation with the Noah and Pleim-Xiu land surface schemes in reproducing the severe drought events in Southwest China. The leaf area index (LAI) simulated by the different land surface schemes showed significant deviations in Southwest China. The Pleim-Xiu scheme overestimated the value of LAI by a factor of two. The Noah-MP scheme with dynamical vegetation overestimated the magnitude of the annual cycle of the LAI, although the annual mean LAI was close to observations. The simulated LAI showed a long-term lower value from autumn 2009 to spring 2010 relative to normal years. This indicates that the LAI is a potential indictor to monitor drought events.
In comparison with general circulation models (GCMs), regional climate models (RCMs) have higher spatial resolution and can better describe the underlying surface heterogeneity. Therefore, the RCM is an important tool for the study of regional climate change. The Weather Research and Forecasting (WRF) model is a new generation of numerical prediction and research model, which has been widely used in weather and climate research. The WRF can better reproduce warm-season precipitation in the Central United States compared with most current global climate models ( Bukovsky and Karoly, 2011), and also shows good performance in precipitation simulation in Spain ( Argüeso et al., 2012). The performance of the WRF model has also been assessed in the East Asian region, in which it was shown to perform fairly well in forecasting the meteorological fields in southeastern China ( Li and Tang, 2012), and reasonably reproduce meteorological variables in urban and semiarid areas of China ( Dong et al., 2011).
Over recent decades, many studies have indicated that land-atmosphere interaction plays an important role in modulating climate change ( Zhang et al., 2011a, 2013b). Southwest China is one of the regions of strong land- atmosphere coupling ( Zhang et al., 2008). Land-atmosphere interactions change the momentum, energy, and water vapor fluxes between the land surface and the atmosphere, which in turn influence atmospheric circulation and climate (e.g., Roesch et al., 2001; Xu et al., 2009). Land surface models (LSMs) have developed over a long time and can simulate many land surface process, such as snow ( Jin et al., 1999), vegetation dynamics ( Dickinson et al., 2002), soil hydrology ( Yeh and Eltahir, 2005), and groundwater processes ( Kollet and Maxwell, 2008). Several studies have examined the impact of land surface schemes in the WRF model on rainstorm simulations (e.g., Ma et al., 2009; Zhang et al., 2011b; Zeng et al., 2012). However, it is still not very clear how well the WRF model can reproduce drought events and which land surface scheme performs better in drought simulation in East Asia.
Recently, a new Noah LSM with multiphysics options (Noah-MP) was developed ( Niu et al., 2011; Yang et al., 2011) and incorporated in WRF version 3.4.1. The Noah- MP LSM incorporates dynamic vegetation and groundwater processes, and is more comprehensive in representing the interactions and feedbacks between physical, biological, and chemical processes. Currently, most regional weather or climate models do not consider dynamical vegetation and groundwater processes. These processes may play an important role in weather and climate simulation, since the variations in vegetation, soil moisture, and groundwater can last from several weeks to whole seasons ( Schlosser and Miller, 2002). Hence, it is necessary to assess the performance of the WRF model with newly introduced dynamical vegetation and groundwater processes in extreme drought event simulation over East Asia. It is known that Southwest China suffered from a persistent drought event from October 2009 to April 2010. We take this case as an example to examine the performance of the WRF in simulating drought events.
With continuous improvement and development, different LSMs have been incorporated into the WRF, such as Noah, Pleim-Xiu, and Noah-MP. The Noah LSM can predict soil moisture and temperature in four layers with thicknesses from top to bottom of 0.1, 0.3, 0.6, and 1.0βm ( Chen and Dudhia, 2001). Vegetation parameters depend on the vegetation type or land use category. The Pleim- Xiu LSM ( Xiu and Pleim, 2001; Pleim and Xiu, 2003) includes two layers (1-cm surface layer and 1-m root zone layer) for soil moisture and temperature, directly from the soil surface, the canopy, and via vegetative evapotranspiration are three pathways for evaporation. Based on the Noah LSM, the Noah-MP LSM ( Niu et al., 2011; Yang et al., 2011) has several improvements in the surface energy balance, surface albedo, snow and frozen soil, runoff, groundwater, and leaf dynamics. Dynamic vegetation and groundwater processes are two options among others. The leaf area index (LAI) is simulated by a dynamic leaf model ( Dickinson et al., 1998; Yang and Niu, 2003) when the dynamic vegetation option is used. An unconfined aquifer below the 2-m bottom of the Noah soil column has been added to account for the exchange of water between the soil and the aquifer ( Niu et al., 2007). The initial depth of groundwater is set to 2.5βm in the current version of Noah-MP.
To evaluate the performance of the WRF with different land surface schemes in reproducing the extreme event in Southwest China, several WRF simulations were conducted with the Pleim-Xiu LSM (hereafter Px), the Noah LSM, the Noah-MP LSM without dynamic vegetation and groundwater (hereafter Nondveg), the Noah-MP LSM with dynamic vegetation but without groundwater (hereafter dveg), and the Noah-MP LSM with both dynamic vegetation and groundwater processes (hereafter dvegGW). The spatial patterns and temporal variations of precipitation, evaporation, and LAI simulated by the WRF model were compared with observation data to investigate the influence of various schemes on the simulation of the extreme drought event.
The WRF domain covers most of the Asian region. The model domain was centered at (37°N, 102.5°E). The Lambert conformal conic projection was adopted, and the horizontal resolution of the simulation was 30βkm with 175 × 151 grids in the west-east and north-south directions. The model was driven by the six-hourly of the National Center for Environmental Prediction Final (NCEP FNL) Operational Global Analysis data with a resolution of 1.0° × 1.0°. To compare the difference between the drought year and a normal year, all the simulations were integrated from December 2007 to December 2010, instead of the drought period only. Gridded observational precipitation data were used to validate the simulations. The daily rainfall data were observed by 612 stations in China covering the period 2008-10, and were collected and compiled by the National Meteorological Information Center of the China Meteorological Administration. Global Land Data Assimilation System (GLDAS) data with a resolution of 0.25° × 0.25° were used to assess the evaporation. We employed the National Aeronautics and Space Administration (NASA) Moderate-Resolution Imaging Spectroradiometer (MODIS) eight-day LAI products with a resolution of 1βkm as reference data to evaluate the model’s ability to predict LAI.
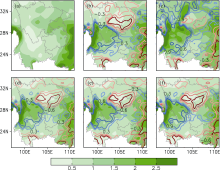
Figure 1 shows the observed and simulated precipitation in Southwest China averaged from 1 October 2009 to 30 April 2010. The comparison of the five WRF simulations with observations shows that all the simulations performed well in Yunnan, Guizhou, and Northwest Guangxi provinces; however, all the simulations overestimated precipitation over southern Sichuan Province (Fig. 1). It is worth pointing out that the large bias of precipitation mostly occurred in areas with steep topography, such as the western Sichuan Plateau and Hengduan Mountains. The steep topography may partly account for the large bias of precipitation. The WRF simulation with the Noah scheme underestimated the precipitation in eastern and northern Sichuan Province compared with the observations (Fig. 1b). The Px scheme generally predicted more precipitation compared with the observations over most parts of Southwest China, especially in southern Sichuan Province (Fig. 1c). The Noah-MP schemes (Nondveg, Dveg, and DvegGW) slightly improved the precipitation simulation, characterized by a relatively small dry bias compared with the Noah scheme in eastern Sichuan Province and a smaller wet bias compared with the Px scheme in southern Sichuan Province (Figs. 1d-f). The accumulated precipitation averaged over Southwest China (22-32°N, 99-108°E) from 1 October 2009 to 30 April 2010 were 200.4, 230.3, 297.3, 225.8, 223.3, and 219.4 mm for the observations, Noah, Px, Nondveg, Dveg, and DvegGW experiments, respectively. The root- mean-square errors (RMSEs) of the drought-period-mean precipitation ( October 2009 to April 2010) for the Noah, Px, Nondveg, Dveg, and DvegGW experiments were 0.792, 0.873, 0.789, 0.773, 0.762, respectively, in Southwest China. This suggests that the DvegGW experiment showed a slightly better performance than the other experiments in reproducing the spatial pattern of precipitation.
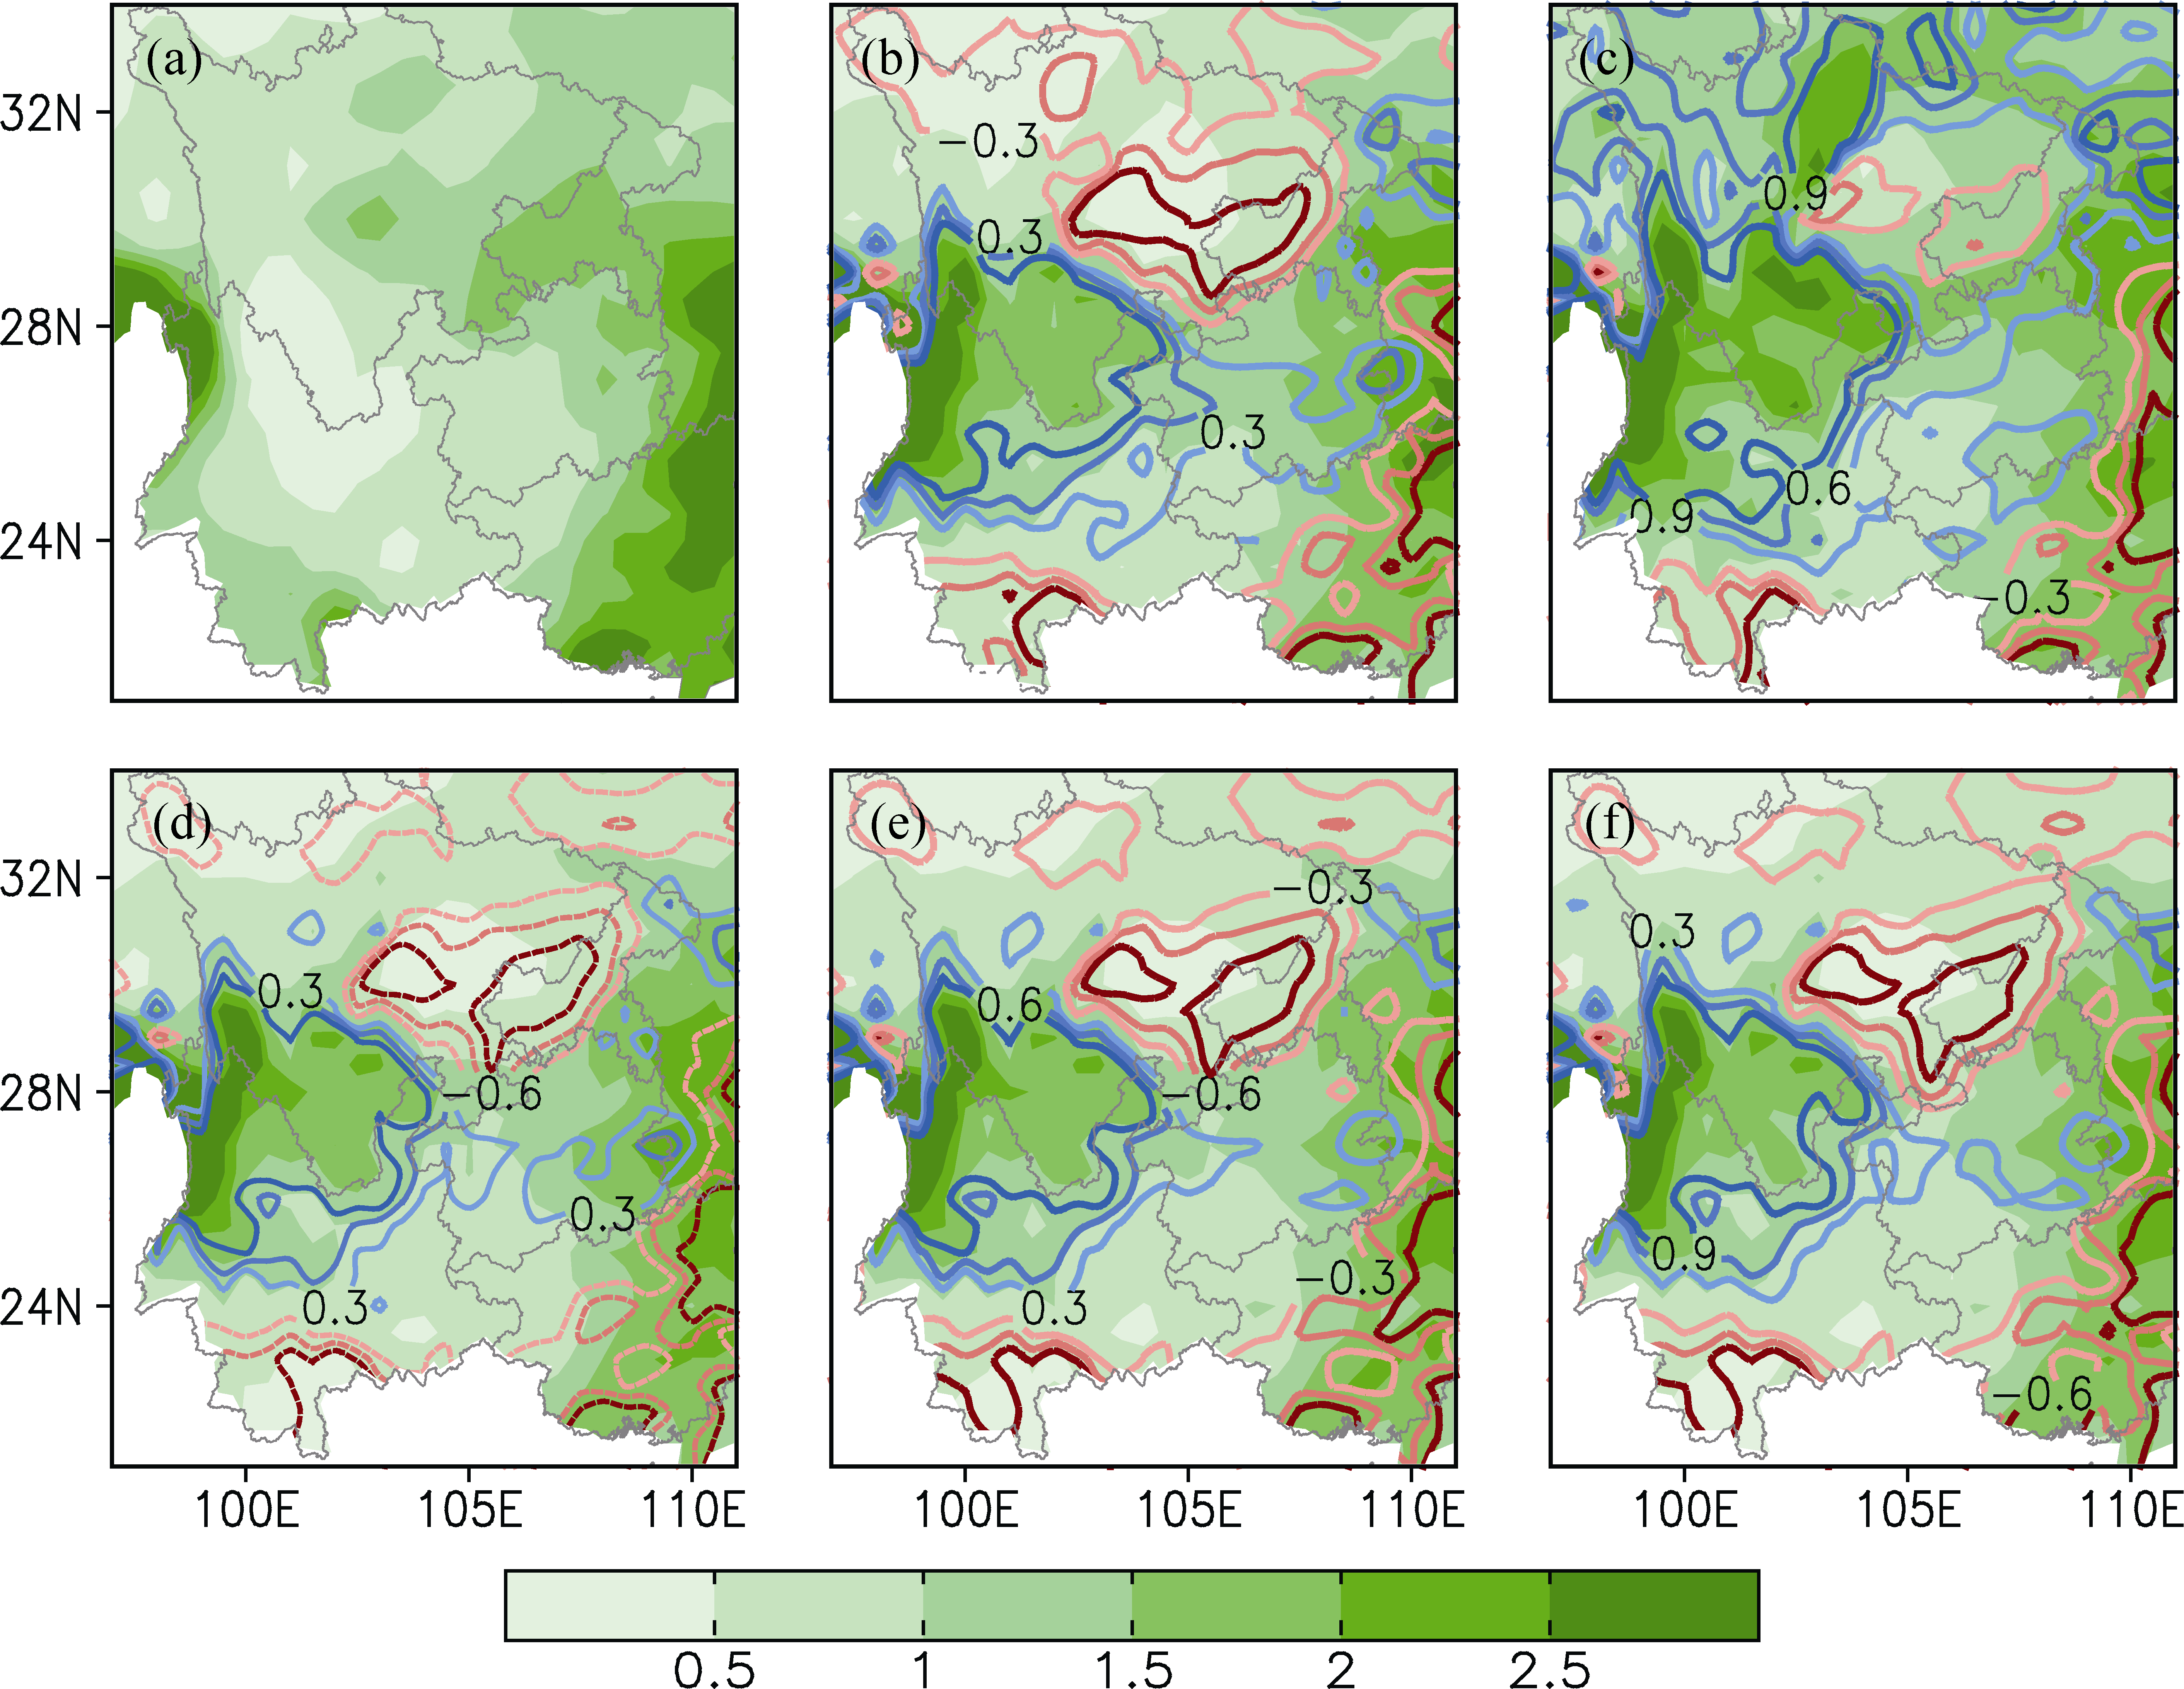 | Figure 1 Precipitation (shading) and the differences in precipitation between simulations and observations (contours) averaged from October 2009 to April 2010 in Southwest China: (a) observation, (b) Noah, (c) Px, (d) Nondveg, (e) Dveg, and (f) DvegGW. Units: mm d-1. |
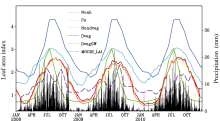
To assess the performance of the WRF model with various land surface schemes in reproducing the temporal variation of precipitation, Fig. 2a illustrates the area-mean daily precipitation for the five WRF simulations; 15-day running means were used to filter out the high-frequency signals and retain the low-frequency signals of daily precipitation. All five WRF simulations simulated the temporal variation of precipitation from September to April well, although there were relatively larger biases in May, June, July, and August (Fig. 2a). All the WRF simulations produced a longer drought period from autumn to spring in 2009-10 than in 2008-09, which indicates that the WRF model can capture the long-persistent drought event in Southwest China. The comparison of observations with different WRF simulations showed that the Dveg and DvegGW experiments produced smaller RMSEs for precipitation than the Noah, Px, and Nondveg experiments did throughout the 3-yr simulation (Fig. 2a), as well as for the drought period only in Southwest China (not shown). The dynamic vegetation and groundwater processes led to a slight improvement in the simulation of the temporal variation of precipitation.
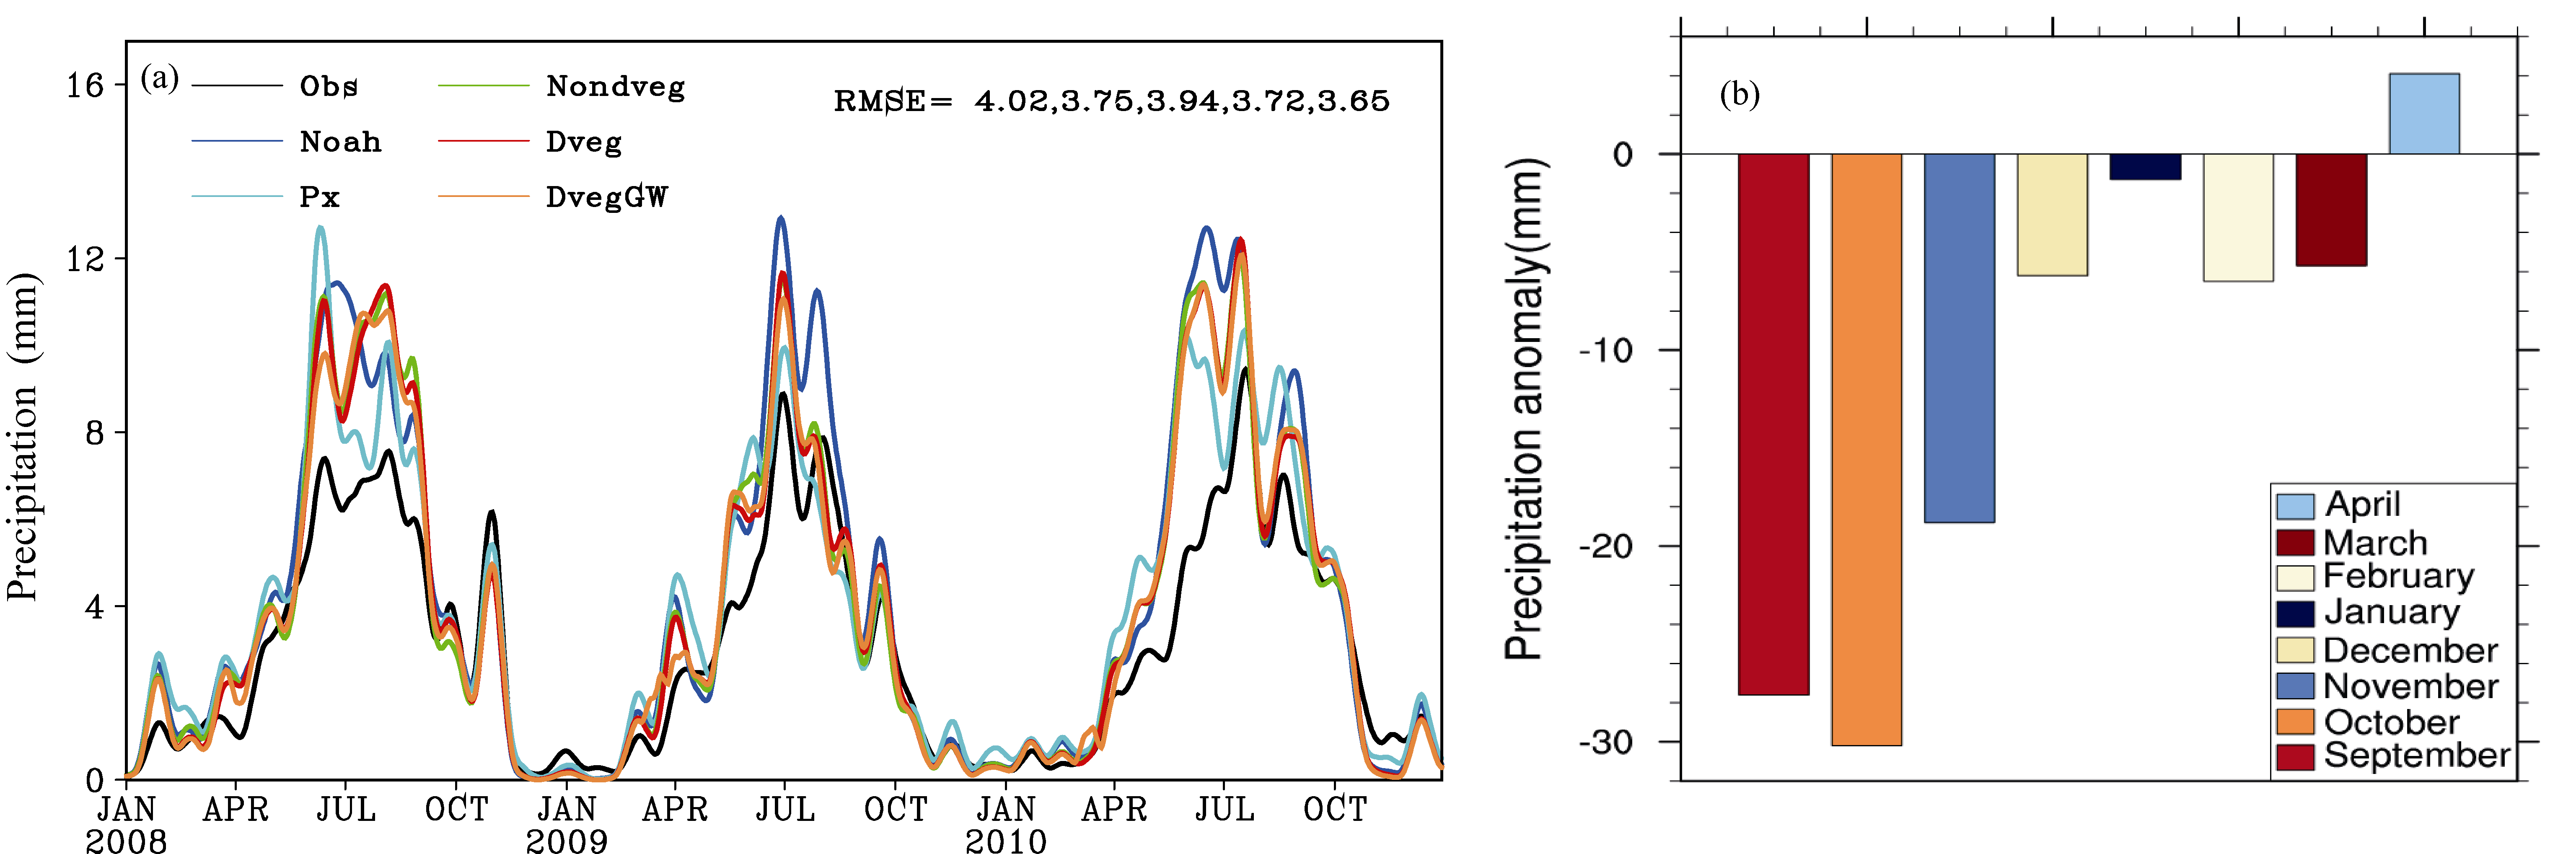 | Figure 2 (a) Time series of area-averaged precipitation for the observation and five WRF simulations; the RMSEs are also shown for Noah, Px, Nondveg, Dveg, and DvegGW. (b) Observational precipitation anomaly from September 2009 to April 2010 relative to the observed precipitation over 2008-10 in Southwest China (22°N-32°N, 99°E-108°E). |
To further quantify the change in the precipitation anomaly during the severe drought period, we calculated the percentage of the monthly precipitation variation using the 3-yr simulations and observations in the same period. Table 1 shows the percentage of the precipitation variation from September 2009 to April 2010. All the WRF simulations simulated a relative drought period from autumn 2009 to spring 2010 compared with the 3-yr averaged monthly precipitation for the same period. The observed severe drought occurred in September, November, December, January, and February, which was well simulated by the Dveg and DvegGW runs. In contrast, Noah (Px) underestimated the precipitation deficiency in February (December).
| Table 1 The percentage of precipitation anomaly from September 2009 to April 2010 relative to the monthly precipitation averaged over 2008-10. |
In addition to precipitation, evaporation also plays a very important role in the formation of drought; we therefore assessed the evaporation simulated by the five WRF experiments with the various land surface schemes. Similar to precipitation, the RMSEs of the drought-period- mean evaporation in the spatial pattern for the Noah, Px, Nondveg, Dveg, and DvegGW experiments were 0.43, 0.57, 0.65, 0.54, 0.59, respectively, over Southwest China. All five WRF simulations also showed a reasonable temporal variation of evaporation, although the evaporation was overestimated in summer (figure not shown). The overestimated evaporation likely resulted from the overestimated precipitation in the same period (Fig. 2a). Consistent with GLDAS data, all the WRF simulations produced a longer persistent period of low evaporation from autumn 2009 to spring 2010 than in 2008-09.
Dynamic vegetation and groundwater processes were newly introduced into version 3.4.1 of the WRF model and had not yet been validated in the East Asian region. Clearly, the vegetation and groundwater are two variables that are closely related to drought events. The Normalized Difference Vegetation Index (NDVI) and LAI showed a delayed response to precipitation in the study area. The highest correlations between NDVI and rainfall occurred in the lag intervals of 16-24 days ( Zhang et al., 2013a). The time-lag correlation between LAI and precipitation was more significant in evergreen and deciduous forest areas than in those regions where vegetation is strongly impacted by human activity ( Wang and Tian, 2006).
In this section we briefly assess the performance of the WRF model in simulating LAI by comparing the simulation with observations. Figure 3 shows the LAI simulated or prescribed in the WRF simulations with various land surface schemes and the observed LAI derived from MODIS. Daily precipitation is also shown in Fig. 3 to illustrate the relationship between precipitation and LAI.
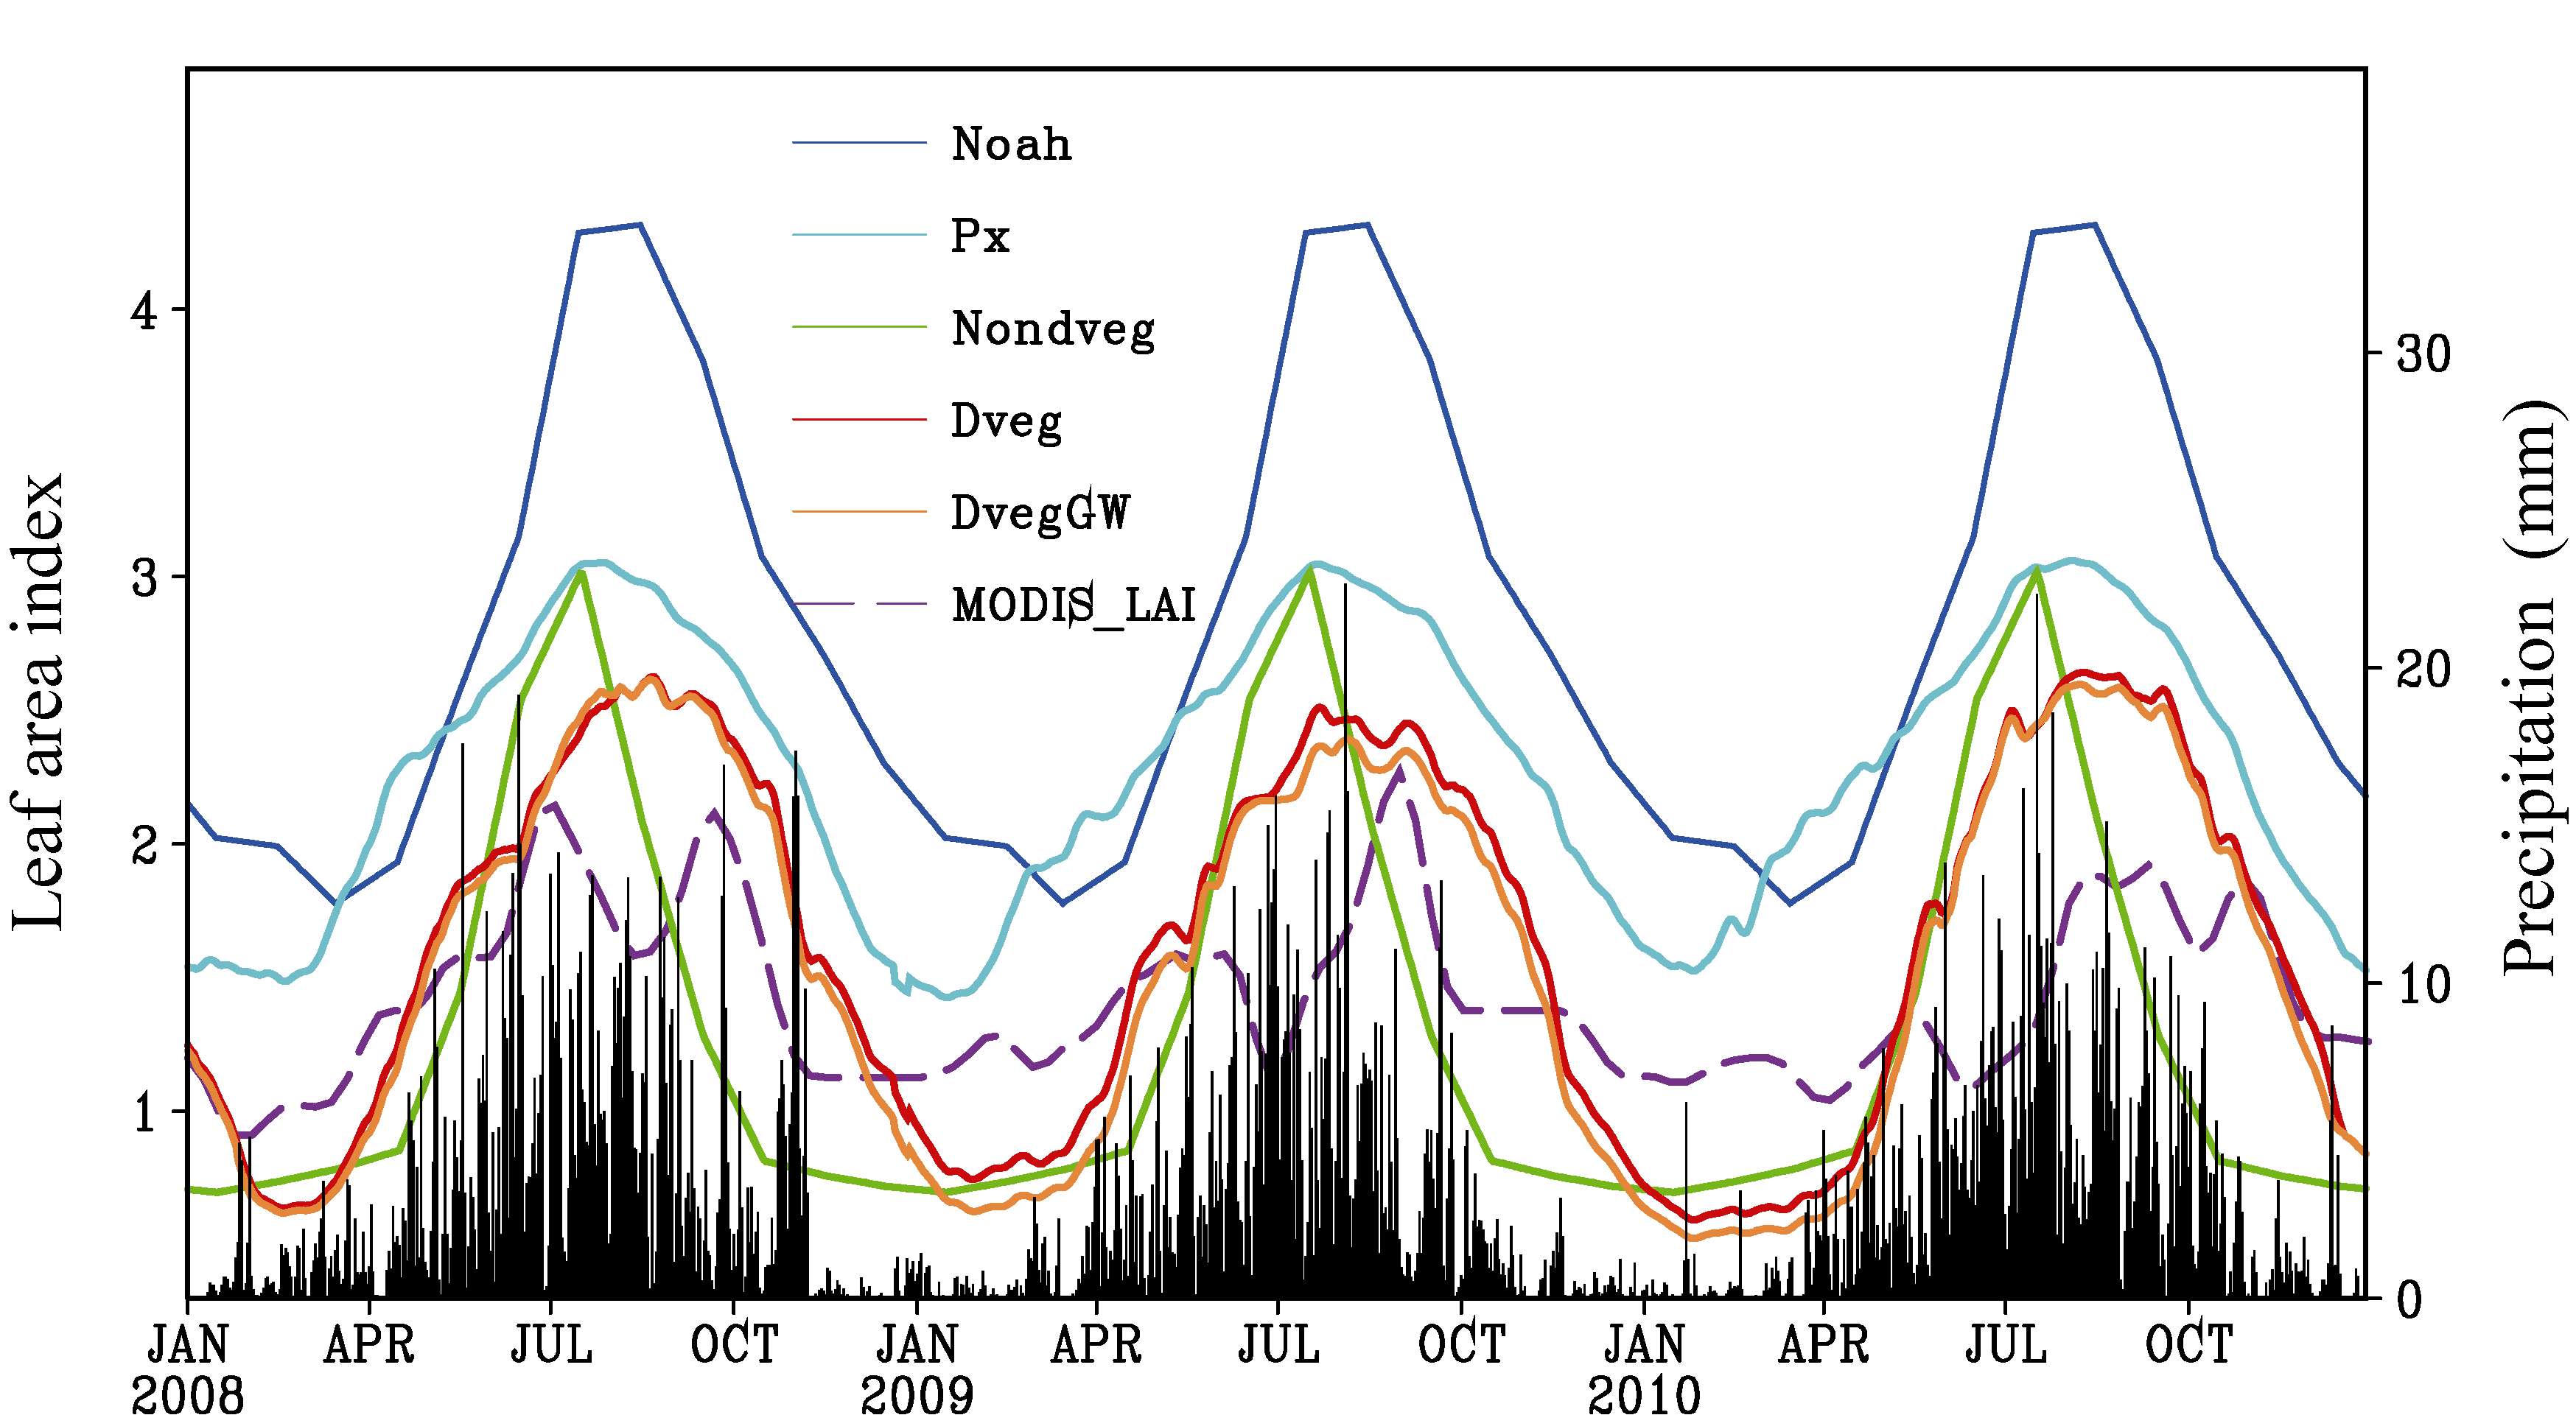 | Figure 3 Area-averaged leaf area index and precipitation (black bars) in Southwest China (22°N-32°N, 99°E-108°E). |
The Noah land surface scheme does not consider the interannual change of LAI because LAI is prescribed in Noah, where it is defined as a function of land cover. The LAI in the Noah land surface scheme is much higher than the MODIS LAI. Similarly, the monthly LAI is also prescribed based on various vegetation types in the Nondveg scheme. In contrast, LAI is a prognostic variable in the Px, Dveg, and DvegGW schemes. The comparison of observed LAI with the simulated ones shows that the Px scheme significantly overestimated LAI by a factor of approximately two. All the WRF simulations overestimated the amplitude of the annual cycle of LAI. However, the annual mean LAI simulated by the WRF model with dynamic vegetation processes (Dveg and DvegGW runs) was close to the MODIS LAI. LAI is a good indicator for measuring drought, since LAI is closely related to changes in precipitation. It is also seen from Fig. 3 that the temporal variation of LAI is much smoother than that of precipitation. Hence, it is easy to measure the beginning and ending time of a drought event using LAI. To assess the simulated LAI and its potential to measure drought, Table 2 shows the percentage of monthly LAI variation from October 2009 to May 2010. Clearly the Px scheme failed to reproduce the negative LAI anomaly during the severe drought period from October 2009 to April 2010. The LAI simulated by the Px scheme in the drought period was even higher than in normal years. The LAI simulated by the Dveg and DvegGW runs showed clear negative anomalies over the drought period, and the MODIS LAI showed negative anomalies, except in November, January, and February (Table 2). However, it should be noted that the MODIS LAI may also contain some uncertainties due to the inappropriate algorithm ( Wang et al., 2001), although the initial results of validating the MODIS LAI with ground measurements are encouraging ( Myneni et al., 2002).
| Table 2 The percentage of LAI anomaly from October 2009 to May 2010 in 2008-10. |
In addition to LAI, the water table depth (ZWT) and groundwater storage (WT) simulated by the WRF model with the DvegGW scheme are shown in Table 3. We also computed the percentage of ZWT and WT variation during the Southwest China drought event. Clearly the ZWT and WT also showed significant negative anomalies in the drought period. The result is reasonable. However, it is unclear whether or not the simulated temporal variation is consistent with observations because we did not compare the simulation with observations due to the lack of groundwater observation data.
| Table 3 The percentage of ZWT and WT anomaly from September 2009 to April 2010 in 2008-10. |
In this study, we assessed the performance of the WRF model with five different land surface schemes in simulating a severe drought event in Southwest China from autumn 2009 to spring 2010. The main conclusions can be summarized as follows:
(1) All the WRF simulations with different land surface schemes can reasonably simulate the spatial pattern and temporal variation of precipitation in Southwest China, although the simulations still show significant errors relative to observations. For example, all the WRF simulations reproduced well the severe drought event in Southwest China characterized by a longer drought period with lower-than-normal precipitation from autumn 2009 to spring 2010. The comparison of the WRF simulations with different land surface schemes indicated that the Noah-MP scheme with dynamic vegetation and groundwater processes (Dveg, DvegGW) showed a slightly better performance in the drought simulations, characterized by smaller RMSEs relative to the WRF simulations with the Noah or Pleim-Xiu land surface schemes. This indicates that the incorporation of dynamic vegetation and groundwater processes can improve the simulation of precipitation to a certain extent in this case.
(2) Unrealistic LAI likely causes significant errors in regional climate simulations, since LAI strongly impacts many land surface variables such as albedo, evapotranspiration, roughness, etc. The Noah-MP land surface scheme simulated a more realistic LAI, although the amplitude of the annual cycle of LAI was overestimated. The simulated LAI and groundwater showed a clear response to the severe drought event in Southwest China, characterized by significant negative anomalies in LAI and groundwater storage during the drought period. This indicates that the simulated LAI and groundwater storage are potential indictors to measure drought events.
This study should be considered as a preliminary evaluation of the WRF model with different land surface schemes, since the simulations were only run over three years and we only focused on the drought event in Southwest China. It would be interesting to perform longer simulations and assess the performance of the WRF model in different regions.
| 1 |
|
| 2 |
|
| 3 |
|
| 4 |
|
| 5 |
|
| 6 |
|
| 7 |
|
| 8 |
|
| 9 |
|
| 10 |
|
| 11 |
|
| 12 |
|
| 13 |
|
| 14 |
|
| 15 |
|
| 16 |
|
| 17 |
|
| 18 |
|
| 19 |
|
| 20 |
|
| 21 |
|
| 22 |
|
| 23 |
|
| 24 |
|
| 25 |
|
| 26 |
|
| 27 |
|
| 28 |
|
| 29 |
|