ZHANG Jin-Qiang, XUAN Yue-Jian, XIA Xiang-Ao, LIU Ming-Yuan, YAN Xiao-Lu, PANG Li, BAI Zhi-Xuan, WAN Xiao-Wei. Performance Evaluation of a Self-Developed Ozonesonde and Its Application in an Intensive Observational Campaign. Atmospheric and Oceanic Science Letters, 2014, 7(3): 175-179
Permissions
Copyright 2014, Editorial office of Atmospheric and Oceanic Science Letters
This is an Open Access article under the terms of CCAL.
Performance Evaluation of a Self-Developed Ozonesonde and Its Application in an Intensive Observational Campaign
ZHANG Jin-Qiang1, XUAN Yue-Jian1, XIA Xiang-Ao1, LIU Ming-Yuan1, YAN Xiao-Lu2, PANG Li3, BAI Zhi-Xuan1, WAN Xiao-Wei1
1 Key Laboratory of Middle Atmosphere and Global Environment Observation, Institute of Atmospheric Physics, Chinese Academy of Sciences, Beijing 100029, China 2 Chinese Academy of Meteorological Sciences, Beijing 100081, China 3Jiangsu Radio Scientific Institute Company Limited, Wuxi 214000, China
To make a detailed test on the reliability and detection performance of the electrochemical concentration cell (ECC) type ozonesonde which had been developed and preliminarily evaluated by the authors, an intensive ozonesonde release experiment was held at two sites in Beijing and Changchun in June 2013. The results showed that the mean background current and its standard deviation were 0.03 (0.04) μA and 0.02 (0.03) μA in Beijing (Changchun). The average response time and its standard deviation were 27.8 s (30.4 s) and 4.0 s (3.7 s) in Beijing (Changchun). The ozone partial pressure profiles at both sites showed a central peak in the stratosphere and a side peak in the boundary layer. Large variation in ozone partial pressure was observed at the middle levels of the atmosphere (10-17 km). A more marked gradient of ozone change was observed in Beijing (3.4 mPa km-1) at the lower atmosphere level, as compared to that in Changchun (0.4 mPa km-1). The results presented in this paper indicate that this self-developed ozonesonde shows a high level of reliability and good performance. The ozonsonde is expected to play an important role in operational observations of ozone profiles.
Accurate ozone measurements are crucial to investigate local ozone distributions, long-term trends of change, ozone depletion, and associated climatic as well as environmental effects ( Zhou and Luo, 1994). The ozonesonde is an important approach in providing ozone partial pressure measurements with high vertical resolution from the surface to atmospheric layers higher than 30 km. The global network of ozone sounding stations has provided the longest time series of vertical ozone distributions Vömel and Diaz, 2010; Thompson et al., 2011).
Three major types of ozonesonde have been developed and widely used: the Brewer-Mast (BM) ( Brewer and Milford, 1960); the electrochemical concentration cell (ECC) ( Komhyr, 1969); and the carbon iodine cell (KC) ozonesonde ( Kobayashi and Toyama, 1966). The ECC ozonesonde is composed of two half cells, while a single-cell approach is used for both the BM and KC ozonesondes. The Juelich Ozonesonde Intercomparison Experiment ( Smit and Kley, 1998; Smit et al., 2007) and the Balloon Experiment on Standards for Ozonesondes ( Deshler et al., 2008) proved that the precision of the ECC ozonesonde was better than that of both BM and KC. The ECC ozonesonde has been used to replace KC96 in the Japanese ozone sounding network since 2011 ( Smit et al., 2013), and the BM ozonesonde has also been replaced by the ECC ozonesonde at many European stations Stübi et al., 2008).
In China, the single-cell Global Positioning System ozonesonde (GPSO3), which was developed more than 20 years ago ( Wang et al., 2003; Xuan et al., 2004), has been used in Beijing to measure ozone profiles every week since 2001. As shown by Zheng and Li (2005), the ozone partial pressure measurements by the GPSO3 ozonesonde were higher than those by the ECC ozonesonde for the atmospheric layer below 15 km and from 25 to 30 km.
In order to further improve the measurement accuracy of the ozone profile in China, an ozonesonde composed of two half cells was developed at the Institute of Atmospheric Physics (IAP), Chinese Academy of Sciences in 2013. The ozonesonde is simply named the “IAP ozonesonde” hereafter. The performance of the IAP ozonesonde has been preliminarily evaluated by comparing its observations with measurements from the ECC ozonesonde and Brewer spectrophotometer ( Zhang et al., 2013). The results showed that the IAP ozonesonde was able to capture vertical ozone structures very well, and in good agreement with ECC ozonesonde measurements. To further test its reliability and detection performance in detail, an intensive ozonesonde launch experiment was held in Beijing and Changchun in June 2013. The objective of the experiment was to evaluate the ozonesonde’s performance during the pre-flight preparation procedures, as well as to study the vertical ozone structures over the two sites. Section 2 describes the instrumentation and the field campaign. The results of the ozonesonde’s performance and the vertical ozone structures it retrieved are presented in section 3. The main conclusions are summarized in section 4.
2 Instrumentation and field campaign
2.1 Ozonesonde description
Similar to the ECC type developed by Komhyr (1969), the IAP ozonesonde is also based on an electrochemical method. For a detailed description of the ozonesonde, readers are referred to Zhang et al. (2013). The ozonesonde-based ozone partial pressure can be computed from the following equation:
, (1)
where P is the ozone partial pressure (mPa); I is the cell output current (µA); IBG is the cell background current (µA); T is the temperature of the ozonesonde box (K); t is the time for the pump to bubble 100 milliliters (mL) of airflow through the cathode solution (s); η is the conversion efficiency; and is the efficiency of the pump flow rate.
In the conventional method, a pressure dependent background correction is applied for the ECC ozonesonde. However, many studies conducted at the laboratory (e.g., Thornton and Niazy, 1983; Smit et al., 1994) for the ECC ozonesonde were unable to confirm the pressure dependence on the background current; therefore, a constant background current correction was suggested to be applied throughout the entire ozone profile. Based on this, a constant background current measured during pre-flight preparations at surface pressure was applied for the IAP ozonesonde background current correction during the post-flight data processing throughout the entire ozone profile in this study. η is assumed to be 1 during normal operation for the ECC ozonesonde, which is also deployed in the IAP ozonesonde. The pump volumetric flow rate is relatively constant from surface pressure to about 300 hPa during the balloon flight; however, one would expect a steady decrease in the pump flow rate with altitude higher than 300 hPa due to an increase in resistance from pumping against the cathode solution fluid head, dead space in the cylinder of the piston pump, and pump leakage ( Komhyr et al., 1995; Steinbrecht et al., 1998; Johnson et al., 2002). A slight ozone deficiency in the IAP ozonesonde measurements, generally less than 10% compared to the ECC ozonesonde retrievals, was observed in the upper atmosphere, which was likely caused by a decrease in the pump flow rate of the IAP ozonesonde ( Zhang et al., 2013). It should be noted that further study of the pump correction factor as a function of altitude is still required for the IAP ozonesonde; however, in the meantime, it was assumed to be 1 in the present study, which may have resulted in a bias of less than 10% in the upper atmosphere on the basis of our previous results obtained in the preliminarily evaluation campaign.
2.2 Field campaign
A total of 22 and 23 releases of the IAP ozonesonde were carried out at Beijing Observatory (BJ, (39.81°N, 116.47°E), 31 m above mean sea level (MSL)) and Changchun Observatory (CC, (43.9°N, 125.2°E), 237 m above MSL) in June 2013. The radiosonde used for the data transmission was provided by Changfeng Company, which participated in the Eighth World Meteorological Organization International Radiosonde Comparison held at Yangjiang, China in 2010 ( Nash et al., 2011). An ozonesonde was generally launched at around 14:00 Local Standard Time (LST) per day; in addition, three ozonesondes were released at 07:30, 14:30, and 19:30 LST on 26 June in BJ to investigate the variation in vertical ozone distributions during different periods for a particular day. The maximum detection altitudes exceeded 30 km above ground level (AGL) over the two sites, except for two launches (one at BJ and one at CC).
3 Results
3.1 Ground check of ozonesonde performance
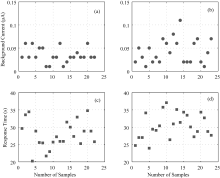
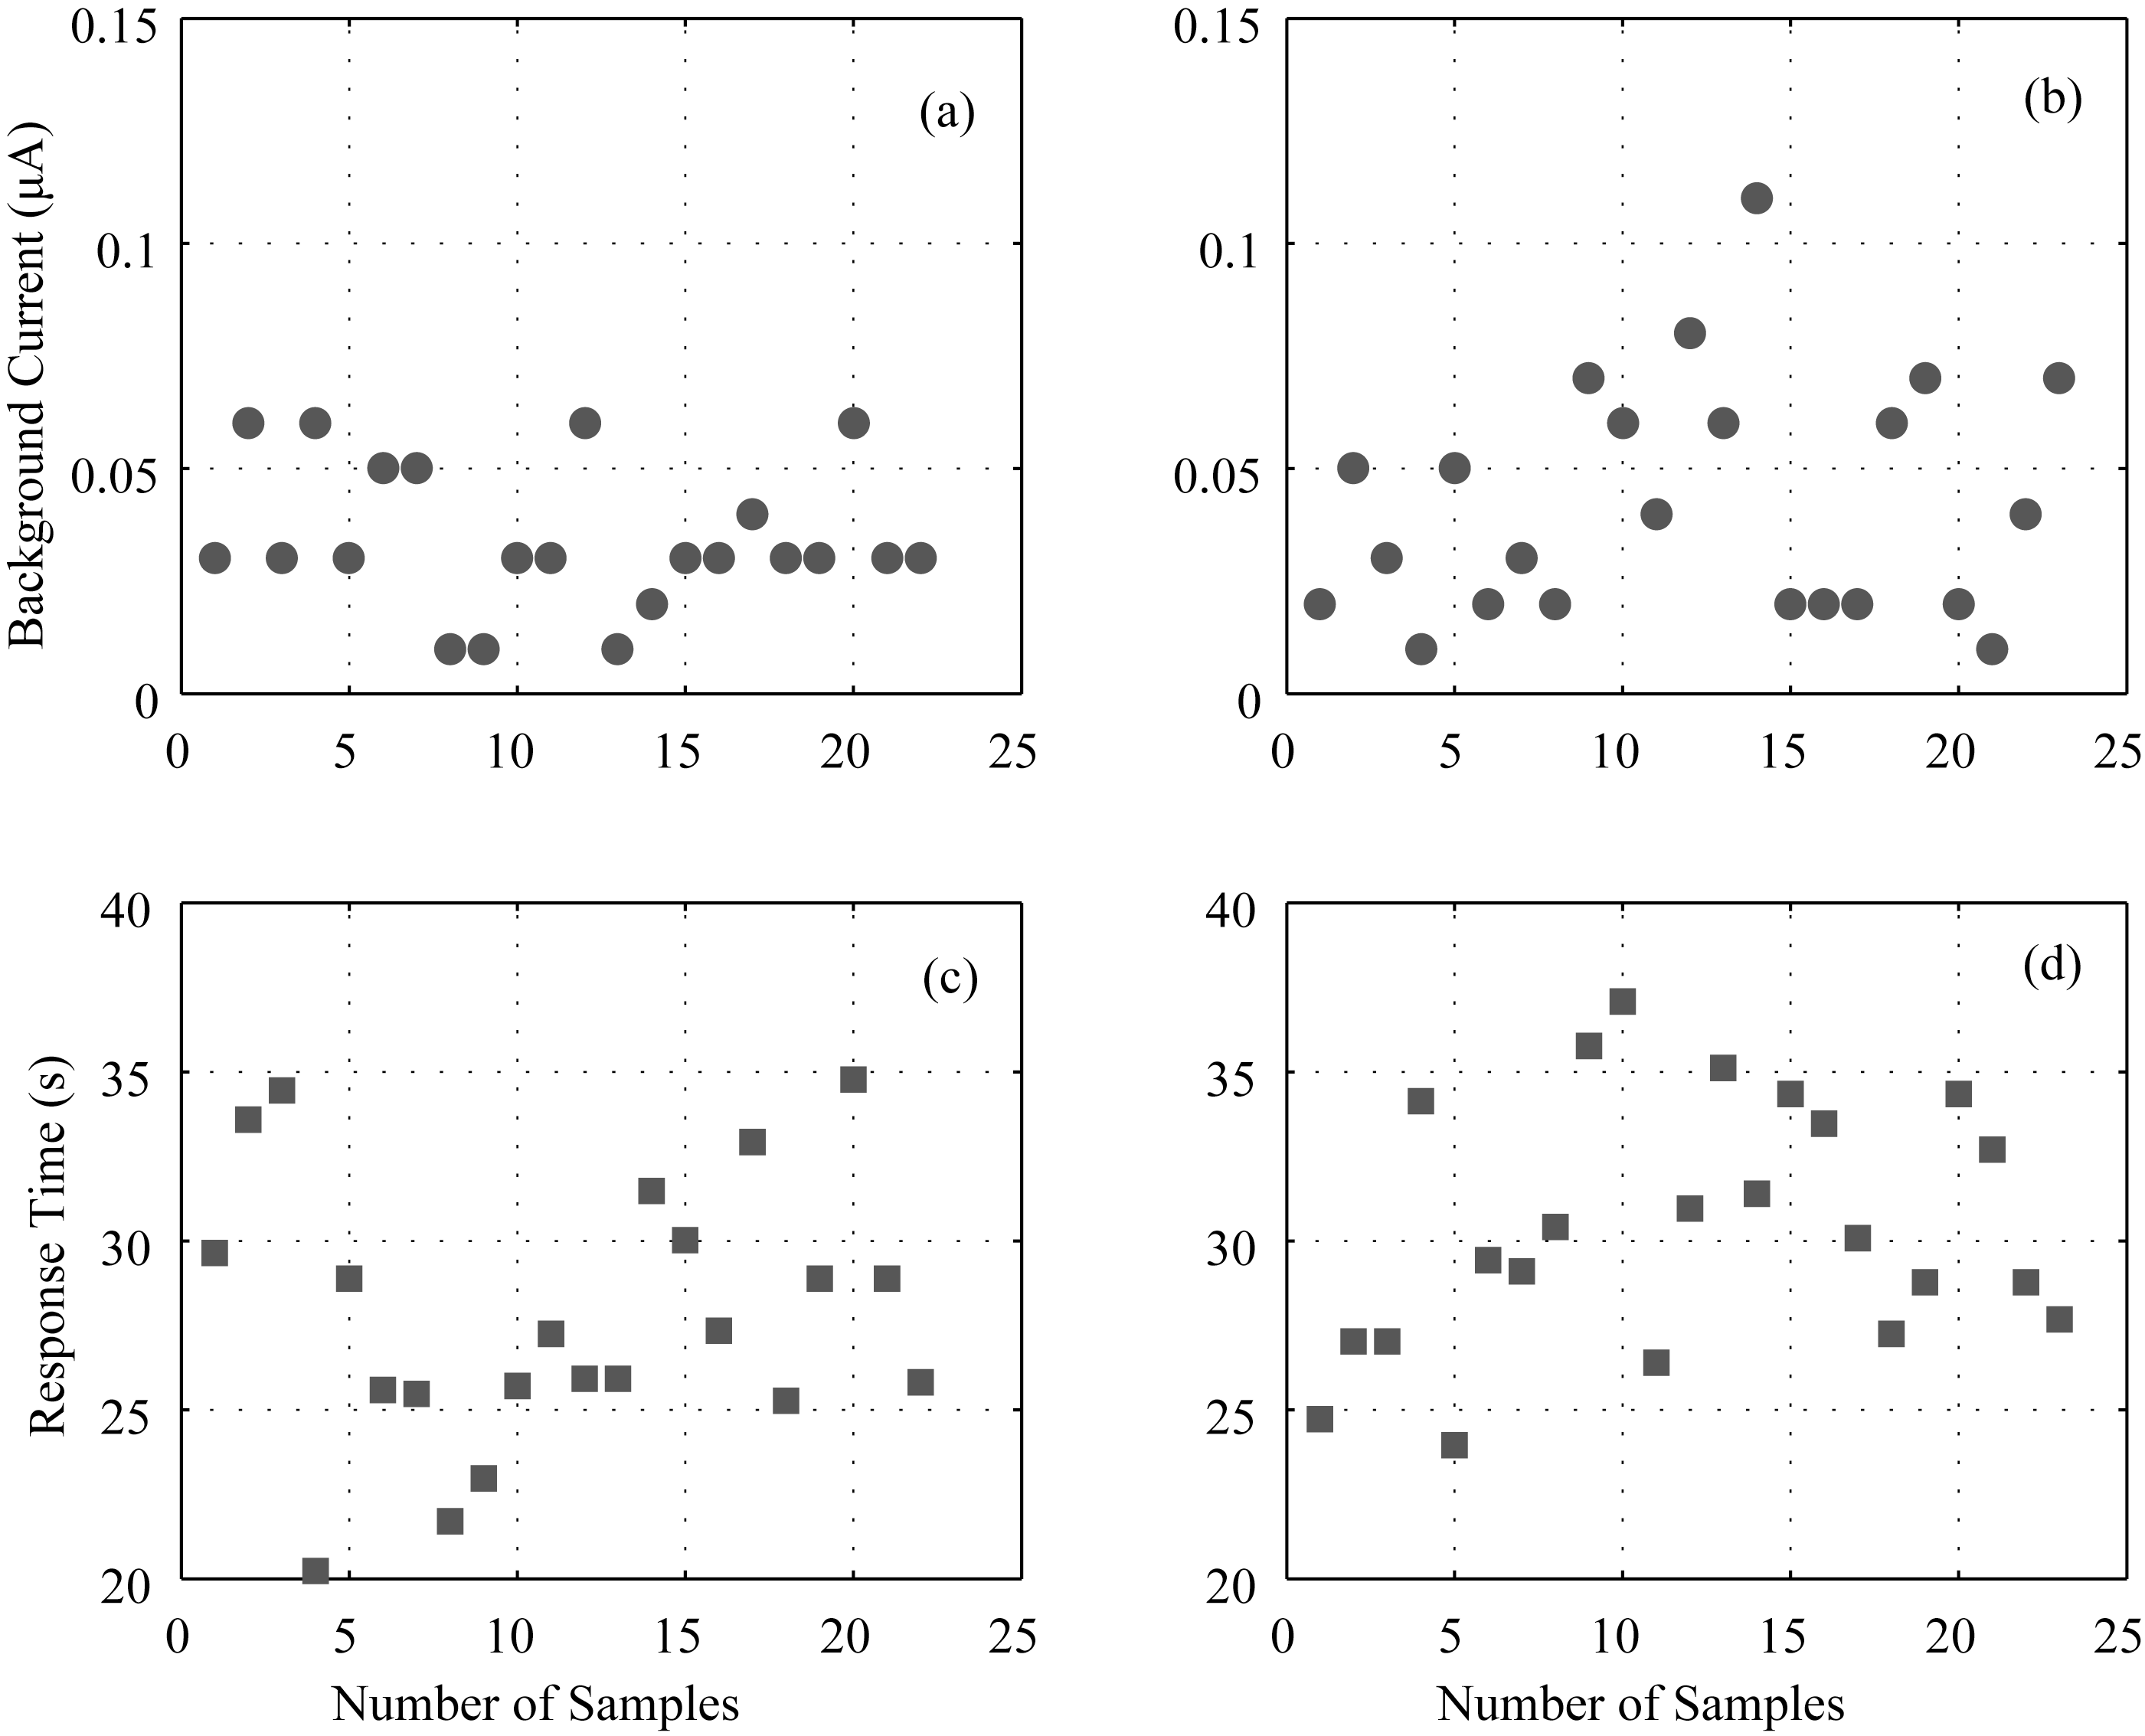
The two ozonesonde performance parameters, i.e., background current and response time, obtained during the pre-flight preparation procedures at BJ and CC, are shown in Fig. 1. The background current was less than 0.05 μA for 18 out of 22 releases at BJ (Fig. 1a), and 15 out of 23 releases at CC (Fig. 1b). The mean background currents were 0.03 μA at BJ and 0.04 μA at CC, and their standard deviations of the background current were 0.02 μA and 0.03 μA, respectively. Figures 1c and 1d illustrate the response times, which were generally less than 35 seconds. The response time was less than 30 seconds for 16 and 11 releases at BJ and CC, respectively. The average response time and its standard deviation were 27.8 s and 4.0 s at BJ, and 30.4 s and 3.7 s at CC, respectively. The ascent of the IAP ozonesonde was about 5 m s-1, thus translating into a vertical altitude resolution of about 140 m (27.8 m s-1 × 5 m s-1) at BJ and 150 m (30.4 m s-1 × 5 m s-1) at CC, as well as resulting in a slight displacement of the observational profile in the vertical direction compared to the actual profile. In general, no corrections are made for the response lag during usual practice, which was also adopted by the IAP ozonesonde measurements at BJ and CC. The background current and response time over the two sites were, respectively, 0.04±0.02 μA and 29.1±4.0 s, which is comparable to results for the ECC ozonesonde (typically 0.03-0.11 μA for the background current and 20-30 s for the response time) ( Smit et al., 2013) (Table 1).
Note that the same pre-flight preparations were conducted for the IAP ozonesondes released at BJ and CC; the background currents at the two stations were close to each other and were also close to that of the ECC ozonesonde. The response time of the IAP ozonesonde at BJ was close to that of the ECC ozonesonde; however, it was slightly larger by ~2.6 s at CC as compared to that at BJ. The different atmospheric environment at the two stations, such as the temperature and/or relative humidity, was the likely cause for the difference in response time, which needs further study.
Figure 1 The background current (upper panels) and response time (lower panels) for the ozonesondes released over the Beijing (left panels) and Changchun (right panels) site.
Table 1
Table 1
Table 1 The average background current (µA) and response time (s) for the IAP ozonesonde at the Beijing site, Changchuan site, and the two sites combined, as well as their typical values for the ECC ozonesonde.
IAP ozonesonde
ECC ozonesonde
Background current
Response time
Background current
Response time
Beijing site
0.03±0.02
27.8±4.0
0.03-0.11
20-30
Changchun site
0.04±0.03
30.4±3.7
Two sites combined
0.04±0.02
29.1±4.0
Table 1 The average background current (µA) and response time (s) for the IAP ozonesonde at the Beijing site, Changchuan site, and the two sites combined, as well as their typical values for the ECC ozonesonde.
3.2 Vertical ozone distributions
The ozonesonde measures data every second with average ascent about 5 m s-1 that results in vertical resolution of about 5 m (5 m s-1 × 1 s). The observed profiles are projected to layers spaced at 50-m intervals from the surface to the upper atmosphere. Figure 2 shows the ozone partial pressure profiles from all ozonesonde launches. In general, the ozone structure at both stations was similar, with large ozone partial pressure located in
the middle of the stratosphere ranging from 20 to 28 km. The maximum ozone partial pressure was about 14 mPa at the two sites. However, a rather larger difference can be revealed by a more detailed inspection. The ozone partial pressure in the planetary boundary layer occasionally exceeded 10 mPa at BJ; however, it was generally less than 8 mPa at CC. The ozone partial pressure in the upper layer of the troposphere (10-15 km) at CC occasionally exceeded 10 mPa. This is indicative of a strong stratosphere-troposphere exchange due to the outbreak of a cold vortex over Northeast China in this season Yang and Lü, 2004).
Figure 2 Vertical distributions of the ozone partial pressure retrieved from ozonesondes launched in (a) Beijing and (b) Changchun; spaced at 50-m intervals. The areas colored in black denote the altitude ranges without detections, and the other colors represent the ozone partial pressure (in units of mPa).
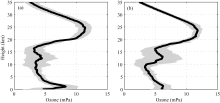
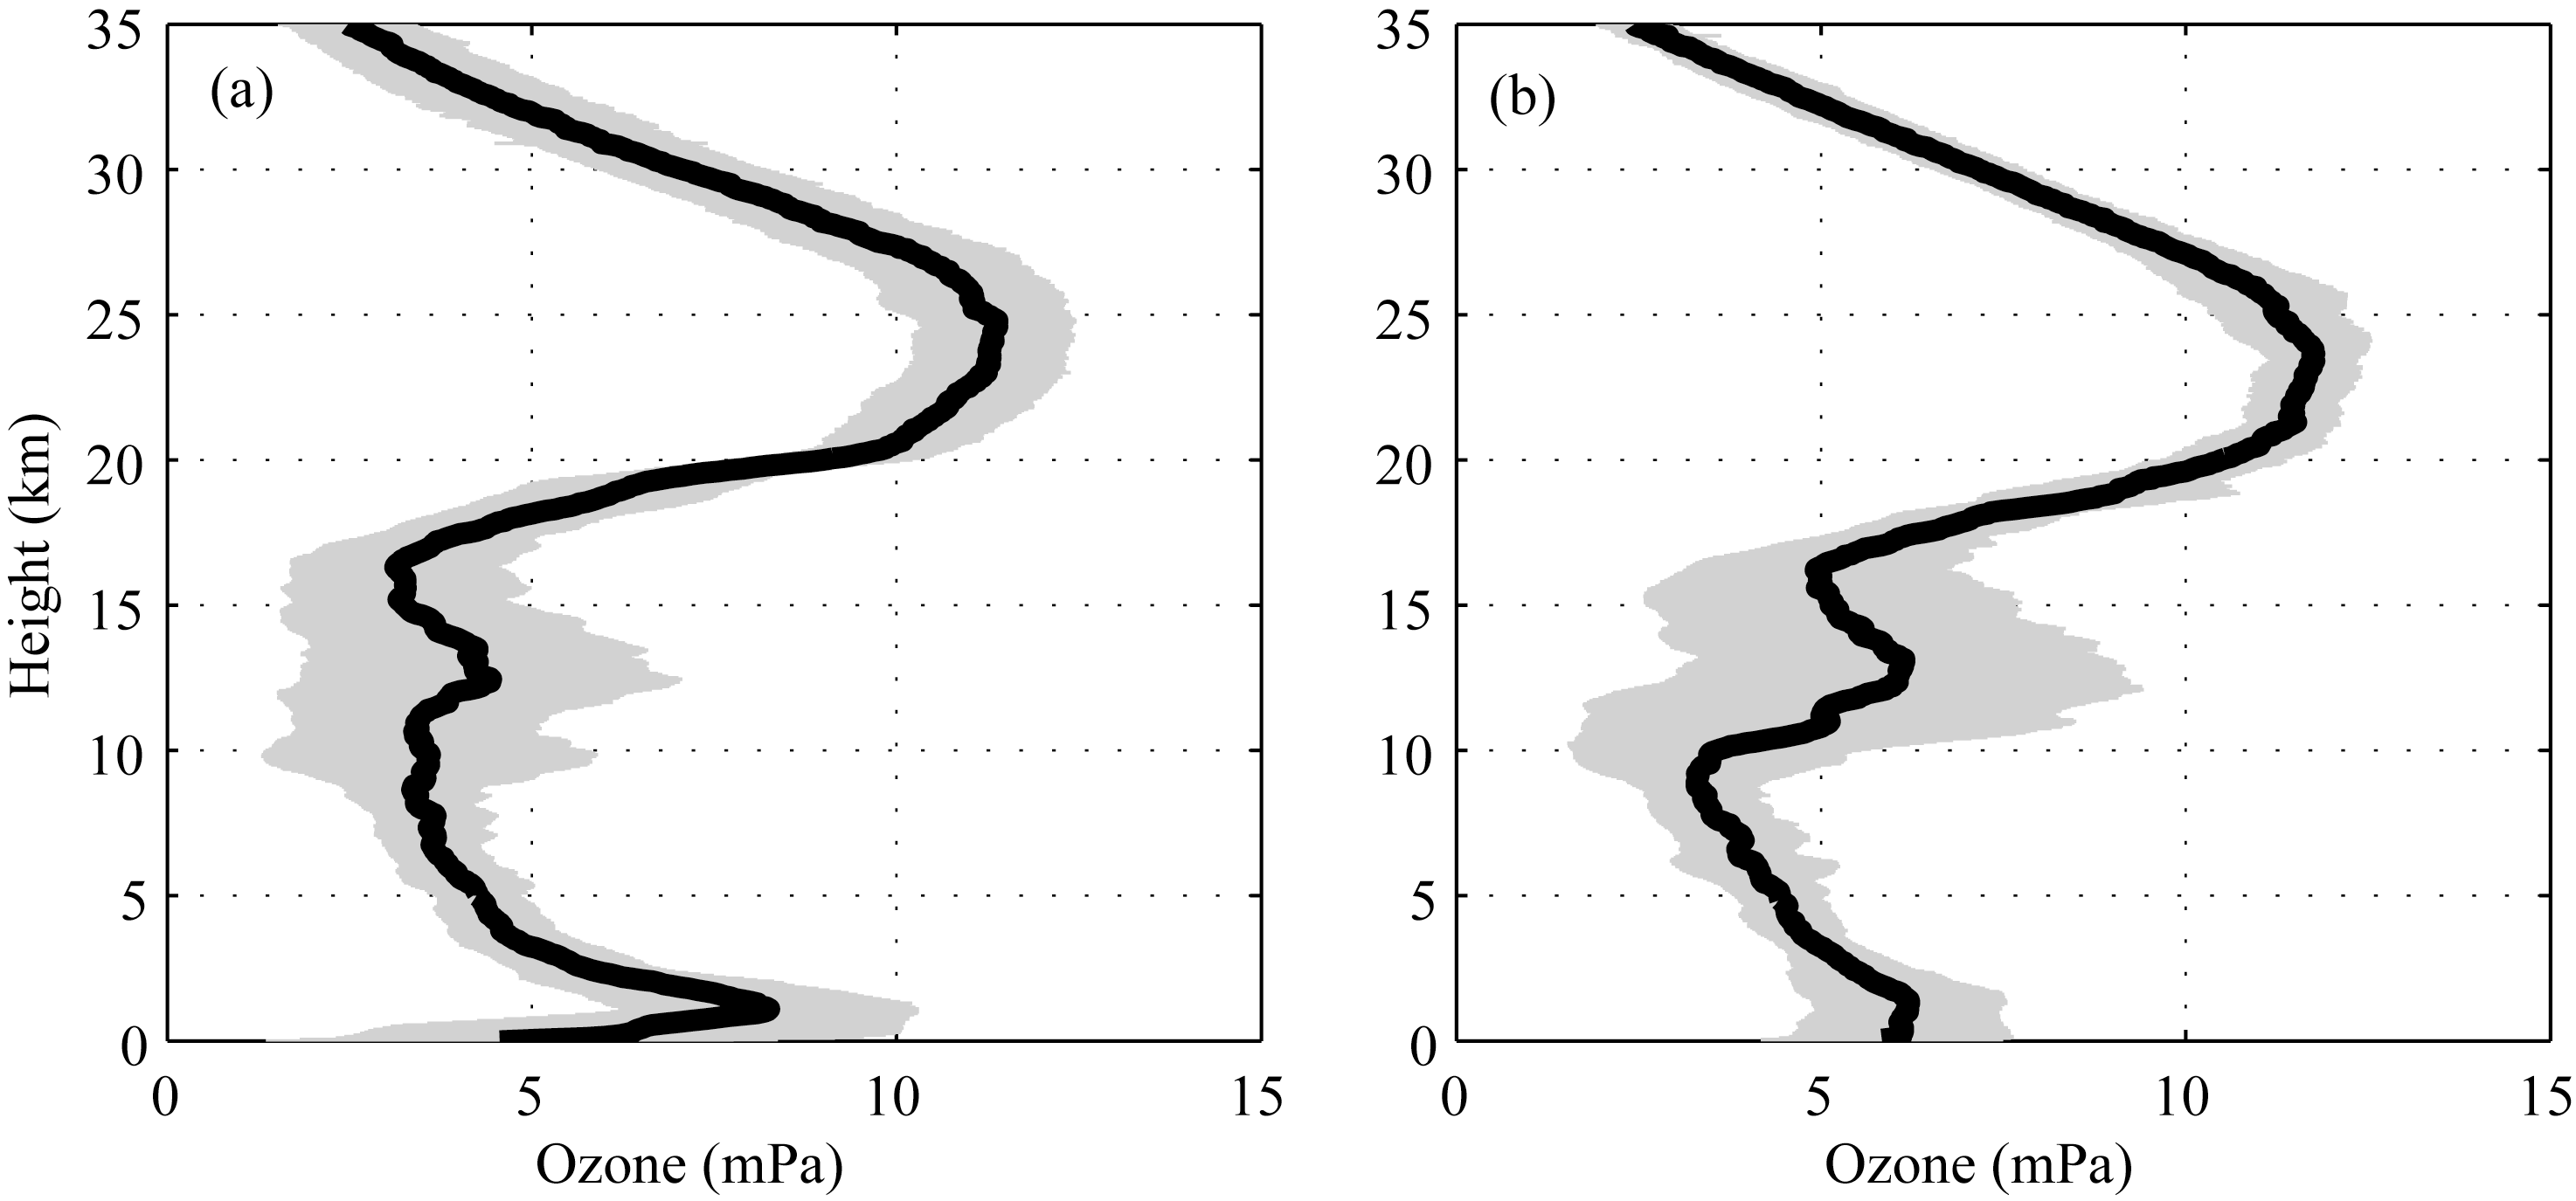
Figure 3 shows the average profile and its standard deviation of ozone partial pressure. The mean ozone partial pressure profile at BJ showed a bimodal distribution, with a central peak in the middle of the stratosphere and a side peak in the planetary boundary layer. The maximum magnitude of ozone partial pressure was 11.4 mPa, which was located at 24.8 km. The pattern of the vertical ozone distribution at CC was similar to that at BJ, especially in the middle of the stratosphere. Larger ozone variation (as shown by the larger standard deviation) was observed in the upper layers of the troposphere, as compared to values in the planetary boundary layer and stratosphere. A large discrepancy was observed within the planetary boundary layer, in which the ozone partial pressure increased sharply from the surface to 1.1 km AGL at BJ (3.4 mPa km-1); however, it was 0.4 mPa km-1 at CC. Most of the ozone partial pressures were < 5 mPa between 10 and 20 km at BJ; however, they were generally > 5 mPa at CC.
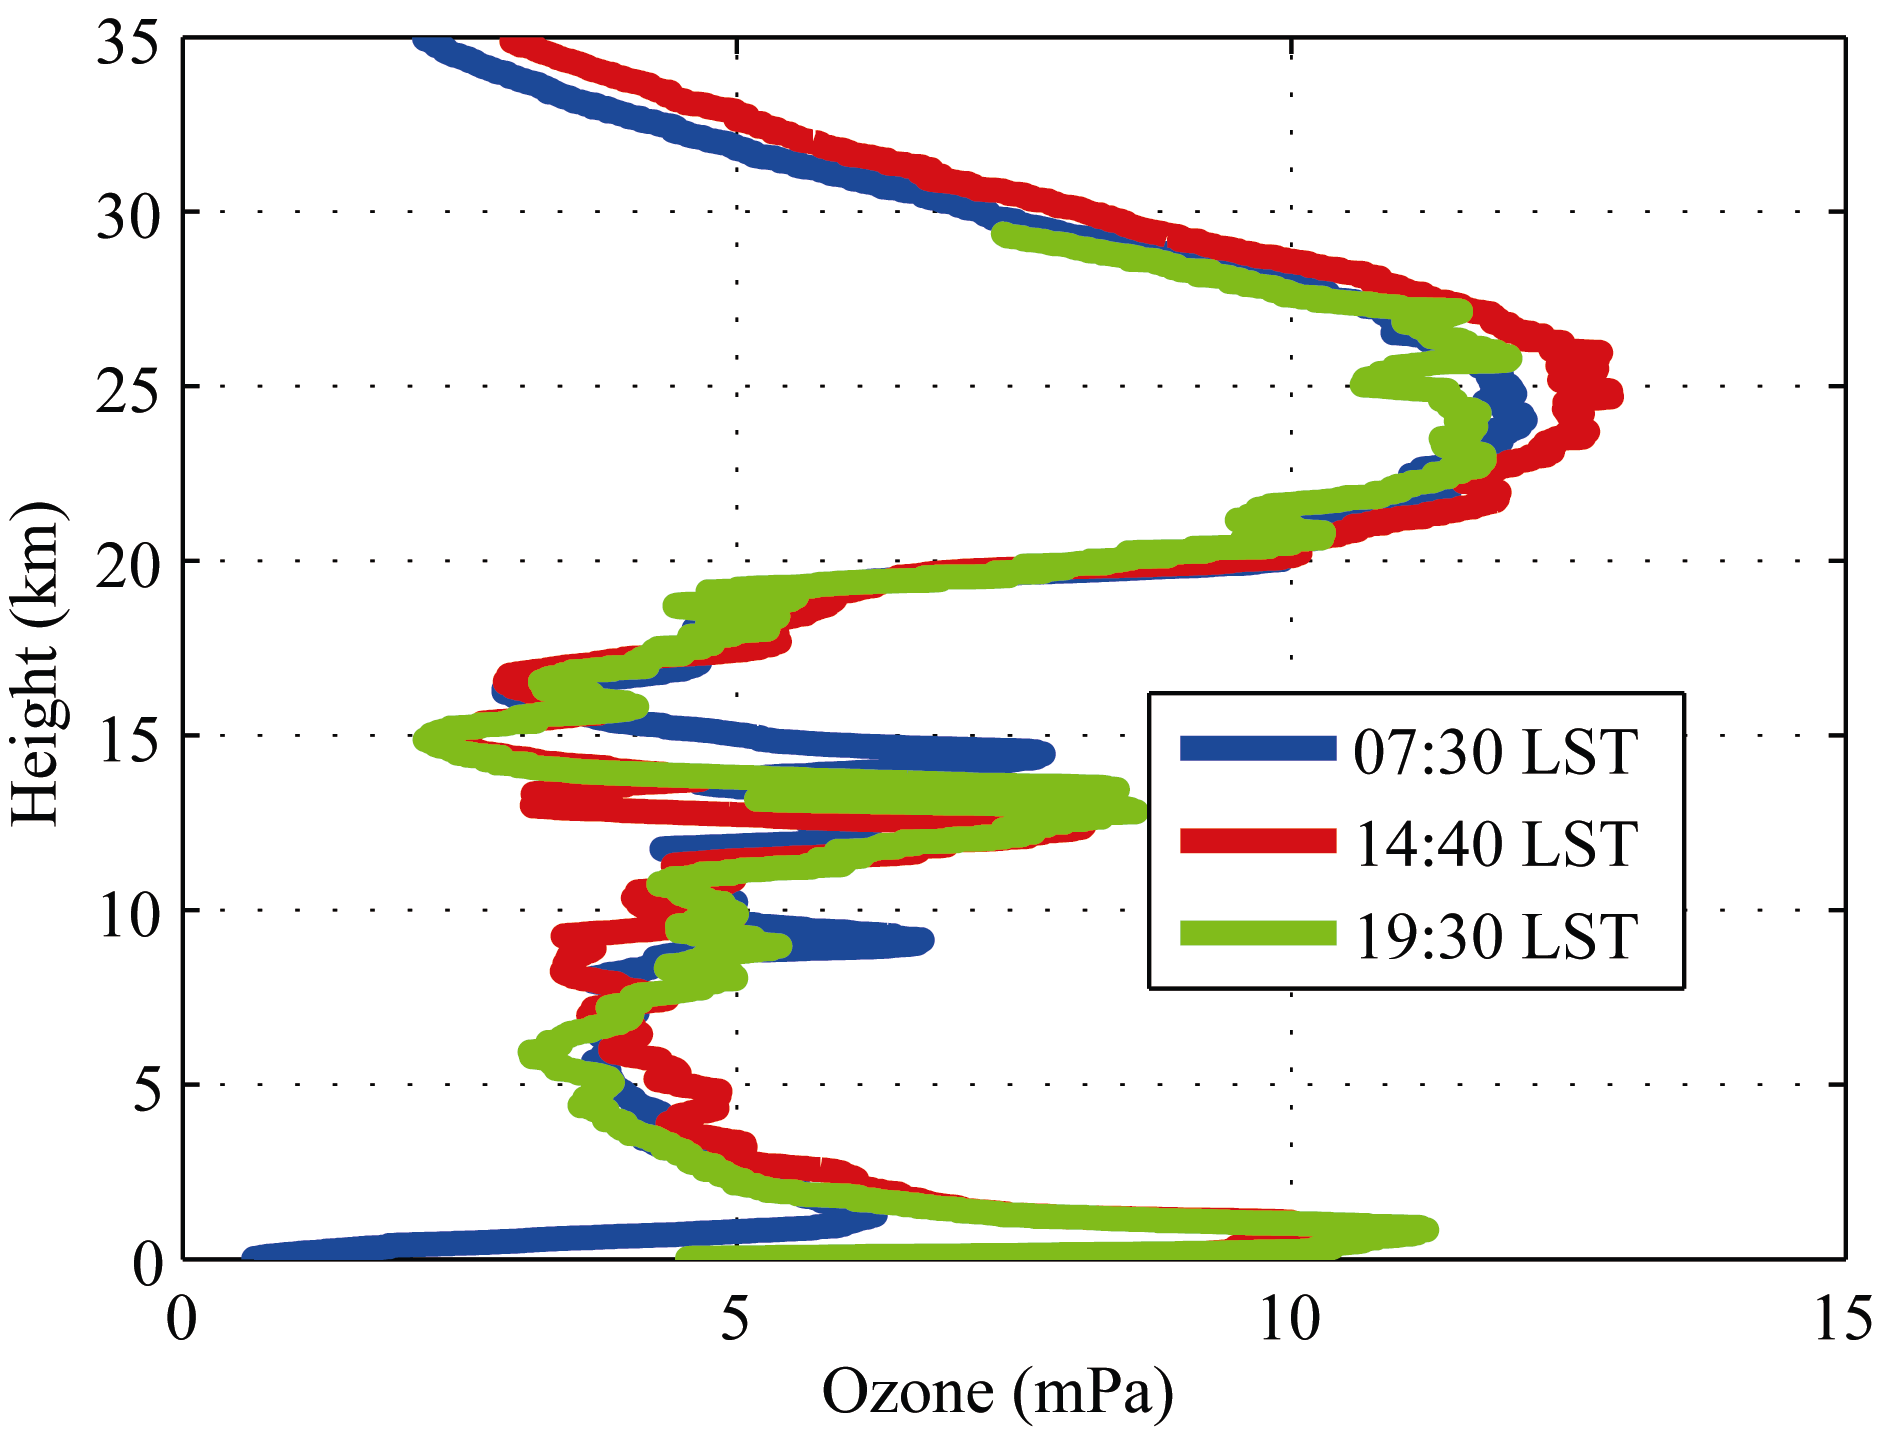
A comparison of the observed ozone distributions at 07:30, 14:30, and 19:30 LST on 26 June is shown in Fig. 4. In general, the patterns of vertical ozone distributions collected from three profiles were very close. However, large discrepancies existed in the lower atmosphere where the ozone partial pressure was larger in the afternoon (14:30 LST) and evening (19:30 LST) than that in the morning (07:30 LST); the maximum difference was about 5 mPa. This is indicative of strong ozone production in the boundary layer during daytime due to photochemical reactions ( Ma and Zhang, 2000).
Figure 3 Average profiles of ozone partial pressure (black line) and their standard deviations in (a) Beijing and (b) Changchun. The vertical resolution is 50 m; shaded grey areas represent the standard deviation.
Figure 4 Comparison of ozone partial pressure profiles collected from ozonesonde launches at 07:30 (blue line), 14:30 (red line), and 19:30 (green line) LST on 26 June in Beijing.
4 Conclusions
Ozonesondes are widely used to measure ozone profiles from the surface to the upper atmosphere. A double-cell ozonesonde has been successfully developed at the IAP, and a preliminary evaluation of the ozonesonde showed it is a vast improvement over the GPSO3, which has been the major ozonesonde deployed in China to date. To further test its performance, an intensive IAP ozonesonde launch experiment was held in Beijing and Changchun in June 2013. The background current and response time of the ozonesonde were checked in detail during the pre-flight preparation. In addition, the vertical ozone structures over the two sites were compared. The major conclusions from the study are as follows.
The average background current and response time were 0.04 μA and 29.1 s, and their standard deviations were 0.02 μA and 4.0 s. The atmospheric environment, such as the temperature and/or relative humidity, might have induced the slight difference in the response time (~ 2.6 s) at the two sites, which needs further investigation. The ozone partial pressure vertical distributions over the two sites were both bimodal, with a central peak in the middle of the stratosphere and a side peak in the planetary boundary layer. Large variation in ozone partial pressure was observed in the upper troposphere. A marked gradient of ozone partial pressure was also observed in the boundary layer at BJ (3.4 mPa km-1).
In previous work, we have preliminarily proven that the IAP ozonesonde is able to capture vertical ozone structures very well, and in good agreement with ECC ozonesonde measurements. The results presented here further demonstrate its high level of reliability and detection performance, which will surely accelerate the process of conventional observations of ozone profiles over China in the near future.
Reference
1
BrewerA. , J. Milford, 1960: The Oxford Kew ozonesonde, Proc. Roy. Soc. London, Ser. A, 256, 470-495.
2
DeshlerT. , J. Mercer, H. G. J. Smit, et al. , 2008: Atmospheric comparison of electrochemical cell ozonesondes from different manufacturers, and with different cathode solution strengths: The balloon experiment on stand ards for ozonesondes, J. Geophys. Res. , 113, D04307, doi: 10.1029/2007JD008975.
3
JohnsonB. J. , S. J. Oltmans, H. Vömel, et al. , 2002: Electrochemical concentration cell (ECC) ozonesonde pump efficiency measurements and tests on the sensitivity to ozone of buffered and unbuffered ECC sensor cathode solutions, J. Geophys. Res. , 107(D19), 4393, doi: 10.1029/2001JD000557.
4
KobayashiJ. , Y. Toyama, 1966: On various methods of measuring the vertical distribution of atmospheric ozone (III)—Carbon iodine type chemical ozonesonde, Pap. Meteor. Geophys. , 17, 113-126.
5
KomhyrW. D. , 1969: Electrochemical concentration cells for gas analysis, Ann. Geophys. , 25, 203-210.
6
KomhyrW. D. , R. A. Barnes, G. B. Brothers, et al. , 1995: Electrochemical concentration cell ozonesonde performance evaluation during STOIC 1989, J. Geophys. Res. , 100, 9231-9244.
7
MaY. , Y. Zhang, 2000: The study on pollution of atmospheric photochemical oxidants in Beijing, Res. Environ. Sci. (in Chinese), 13(1), 14-17.
8
NashJ. , T. Oakley, H. Vömel, et al. , 2011: WMO Intercomparison of High Quality Radiosonde Systems, WMO/TD-No. 1580, Yangjiang, 12 July-3 August 2010, 248pp.
9
SmitH. , H. DeBacker, J. Davies, et al. , 2013: Quality Assurance and Quality Control for Ozonesonde Measurements in GAW, WMO Global Atmosphere Watch Report 201, World Meteorological Organization, Geneva, 92pp.
10
SmitH. , D. Kley, 1998: The 1996 WMO International Intercomparison of Ozonesondes under Quasi Flight Conditions in the Environmental Simulation Chamber at Jülich, WMO Global Atmosphere Watch Report 130, World Meteorological Organization, Geneva, 108pp.
11
SmitH. , W. Straeter, B. J. Johnson, et al. , 2007: Assessment of the performance of ECC-ozonesondes under quasi-flight conditions in the environmental simulation chamber: Insights from the Juelich Ozone Sonde Intercomparison Experiment (JOSIE), J. Geophys. Res. , 112, D19306, doi: 10.1029/2006JD007308.
12
Smit, H. , W. Sträter, D. Kley, et al. , 1994: The evaluation of ECC-ozonesondes under quasi flight conditions in the environmental simulation chamber at Jülich, in: Proceedings of Eurotrac Symposium 1994, P. M. Borell et al. (Eds. ), SPB Academic Publishing, theHague, 349-353.
13
SteinbrechtW. , R. Schwartz, H. Claude, 1998: New pump correction for the Brewer Mast ozone sonde: Determination from experiment and instrument intercomparisons, J. Atmos. Oceanic Technol. , 15, 144-156.
14
StübiR. , G. Levrat, B. Hoegger, et al. , 2008: In-flight comparisonof Brewer-Mastand electrochemical concentration cell ozonesondes, J. Geophys. Res. , 113, D13302, doi: 10.1029/2007JD009091.
15
ThompsonA. M. , S. J. Oltmans, D. W. Tarasick, et al. , 2011: Strategic ozone sounding networks: Review of design and accomplishments, Atmos. Envion. , 45, 2145-2163.
16
ThorntonD. C. , N. Niazy, 1983: Effects of solution mass transport on the ECC ozonesonde background current, Geophys. Res. Lett. , 10, 148-151.
17
VömelH. , K. Diaz, 2010: Ozone sonde cell current measurements and implications for observations of near-zero ozone concentrations in the tropical upper troposphere, Atmos. Meas. Tech. , 3(2), 495-505, doi: 10.5194/amt-3-495-2010.
18
WangG. , Q. Kong, Y. Xuan, et al. , 2003: Development and application of ozonesonde system in China, Adv. Earth Sci. (in Chinese), 18(3), 471-475.
19
XuanY. , S. Ma, H. Chen, et al. , 2004: Intercomparisons of GPSO3 and vaisala ECC ozone sondes, Plateau Meteor. (in Chinese), 23(3), 394-399.
20
YangJ. , D. Lü, 2004: Simulation of stratosphere-troposphere exchange effecting on the distribution of ozone over Eastern Asia, Chinese J. Atmos. Sci. (in Chinese), 28(4), 579-588.
21
ZhangJ. , Y. Xuan, X. Yan, et al. , 2013: Development and preliminary evaluation of a double-cell ozonesonde, Adv. Atmos. Sci. , in press, doi: 10.1007/s00376-013-3104-1.
22
ZhengX. , W. Li, 2005: Analysis of the data quality observed by the Chinese-made ozone sonde system, Quart. J. Appl. Meteor. (in Chinese), 16(5), 608-618.
23
ZhouX. , C. Luo, 1994: Ozone valley over Tibetan Plateau, Acta Meteor. Sinica, 8(4), 505-506.
1
1960
0.0
0.0
... Three major types of ozonesonde have been developed and widely used: the Brewer-Mast (BM) (Brewer and Milford, 1960) ...
1
2008
3.174
0.0
... , 2007) and the Balloon Experiment on Standards for Ozonesondes (Deshler et al ...
1
2002
3.174
0.0
... Johnson et al ...
1
1966
0.0
0.0
... and the carbon iodine cell (KC) ozonesonde (Kobayashi and Toyama, 1966) ...
2
1969
1.518
0.0
... the electrochemical concentration cell (ECC) (Komhyr, 1969) ...
... 1 Ozonesonde descriptionSimilar to the ECC type developed by Komhyr (1969), the IAP ozonesonde is also based on an electrochemical method ...
1
1995
3.174
0.0
... however, one would expect a steady decrease in the pump flow rate with altitude higher than 300 hPa due to an increase in resistance from pumping against the cathode solution fluid head, dead space in the cylinder of the piston pump, and pump leakage (Komhyr et al ...
1
2000
0.0
0.0
... This is indicative of strong ozone production in the boundary layer during daytime due to photochemical reactions (Ma and Zhang, 2000) ...
1
2011
0.0
0.0
... The radiosonde used for the data transmission was provided by Changfeng Company, which participated in the Eighth World Meteorological Organization International Radiosonde Comparison held at Yangjiang, China in 2010 (Nash et al ...
2
2013
0.0
0.0
... The ECC ozonesonde has been used to replace KC96 in the Japanese ozone sounding network since 2011 (Smit et al ...
... A for the background current and 20-30 s for the response time) (Smit et al ...
1
1998
0.0
0.0
... The Juelich Ozonesonde Intercomparison Experiment (Smit and Kley, 1998 ...
1
2007
3.174
0.0
... Smit et al ...
1
1994
0.0
0.0
... Smit et al ...
1
1998
0.0
0.0
... Steinbrecht et al ...
1
2008
3.174
0.0
... , 2013), and the BM ozonesonde has also been replaced by the ECC ozonesonde at many European stations St& ...
Ozone soundings are used to integrate models, satellite, aircraft and ground-based measurements for better interpretation of ozone variability, including atmospheric losses (predominantly in the stratosphere) and pollution (troposphere). A well-designed network of ozonesonde stations gives information with high vertical and horizontal resolution on a number of dynamical and chemical processes, allowing us to answer questions not possible with aircraft campaigns or current satellite technology. Strategic ozonesonde networks are discussed for high, mid- and low latitude studies. The Match sounding network was designed specifically to follow ozone depletion within the polar vortex; the standard sites are at middle to high northern hemisphere latitudes and typically operate from December through mid-March. Three mid-latitude strategic networks (the IONS series) operated over North America in July–August 2004, March–May and August 2006, and April and June-July-2008. These were designed to address questions about tropospheric ozone budgets and sources, including stratosphere–troposphere transport, and to validate satellite instruments and models. A global network focusing on processes in the equatorial zone, SHADOZ (Southern Hemisphere Additional Ozonesondes), has operated since 1998 in partnership with NOAA, NASA and the Meteorological Services of host countries. Examples of important findings from these networks are described.
... Thompson et al ...
1
1983
3.982
0.0
... , Thornton and Niazy, 1983 ...
1
2010
3.205
0.0
... The global network of ozone sounding stations has provided the longest time series of vertical ozone distributions V& ...
1. Institute of Atmospheric Physics, CAS, Beijing 100029, China; 2. Atmospheric Observing Experimental Base, China Meteorological Administration, Beijing 100081, China
The atmospheric ozone is an object of meteorological study all along.The ozonesonde system is more effective technique for direct measurement of ozone vertical structure in the atmosphere. Ozone data are required in meteorology, atmospheric science, space science and in the solar-terrestrial science as well, at present those requirements are even urgent due to the ozone depletion in the stratosphere. For this reason, ozonesonde system has been developed in China since beginning of 90’s the last century. The developed ozonesonde is GPS ozonesonde and has been tested in laboratory, compared with other ozonesonde used at the world ozone monitoring network for main technical specifications. The GPS ozonesonde system has been used in Beijing district and in the Antarctic expedition,now the GPS ozonesonde system is being perfected for operational use in China in the near future. The structure, components, main technical specifications of the developed GPS ozonesonde system and some performance test results are presented and discussed in this paper, some results on ozone vertical profiles obtained by using the GPS ozonesonde system are given as well.ŞĄ
... This is indicative of a strong stratosphere-troposphere exchange due to the outbreak of a cold vortex over Northeast China in this season Yang and L& ...
... The performance of the IAP ozonesonde has been preliminarily evaluated by comparing its observations with measurements from the ECC ozonesonde and Brewer spectrophotometer (Zhang et al ...
... For a detailed description of the ozonesonde, readers are referred to Zhang et al ...
... A slight ozone deficiency in the IAP ozonesonde measurements, generally less than 10% compared to the ECC ozonesonde retrievals, was observed in the upper atmosphere, which was likely caused by a decrease in the pump flow rate of the IAP ozonesonde (Zhang et al ...
1
2005
0.0
0.0
1
1994
0.0
0.0
... 1 IntroductionAccurate ozone measurements are crucial to investigate local ozone distributions, long-term trends of change, ozone depletion, and associated climatic as well as environmental effects (Zhou and Luo, 1994) ...
Performance Evaluation of a Self-Developed Ozonesonde and Its Application in an Intensive Observational Campaign
[ZHANG Jin-Qiang1, XUAN Yue-Jian1, XIA Xiang-Ao1, LIU Ming-Yuan1, YAN Xiao-Lu2, PANG Li3, BAI Zhi-Xuan1, WAN Xiao-Wei1]


 , XUAN Yue-Jian