Projections of Global Mean Surface Temperature?Under Future Emissions Scenarios Using a New Predictive Technique
WANG Ge-Li , YANG Pei-Cai
, YANG Pei-Cai 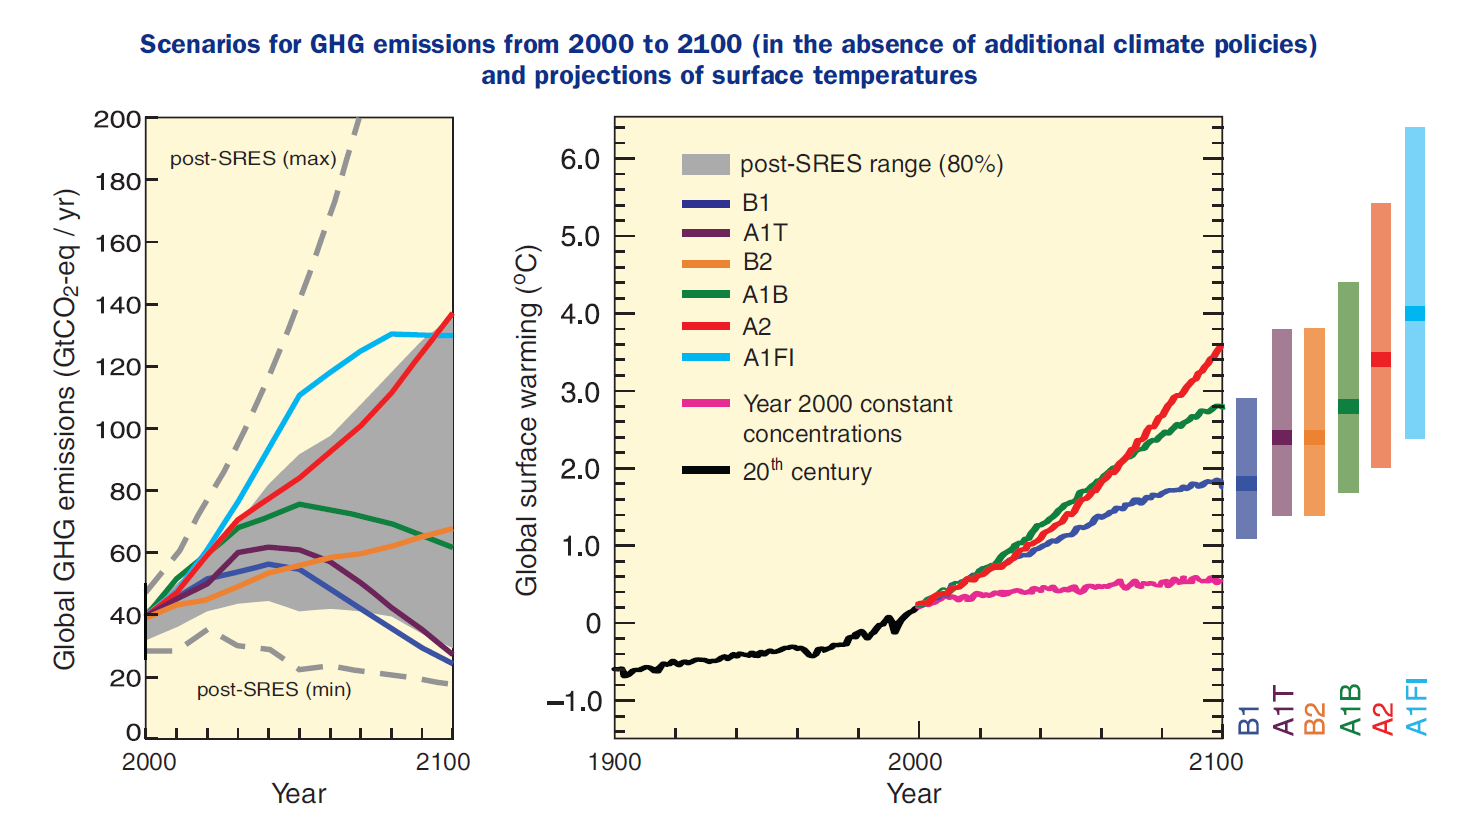
Projections of Global Mean Surface Temperature?Under Future Emissions Scenarios Using a New Predictive Technique |
|
WANG Ge-Li
, YANG Pei-Cai |
| Figure 1 Scenarios for Green House Gases GHG emissions from 2000 to 2100 in the absence of additional climate policies and projections of surface temperatures. Left panel: Global GHG emissions in GtCO 2 -eq in the absence of climate policies: six illustrative Special Report on Emissions Scenarios SRES marker scenarios colored lines and the 80th percentile range of recent scenarios published since SRES post-SRES gray shaded area. Dashed lines show the full range of post-SRES scenarios. The emissions include CO 2 , CH 4 , N 2 O, and F-gases. Right panel: Solid lines are multi-model global averages of surface warming for scenarios A2, A1B, and B1, shown as continuations of the 20th century simulations. These projections also take into account emissions of short-lived GHGs and aerosols. The pink line is not a scenario, but represents Atmosphere-Ocean General Circulation Model AOGCM simulations, where atmospheric concentrations are held constant at year-2000 values from IPCC 2007 . |
| |