


Observation and Simulation of Abnormal Transmittance over Yangbajing, Tibet
[WANG Lei-Di1, 2 , LÜ Da-Ren1  , HUO Juan
1 ]
, HUO Juan|
|


Defining abnormal transmittance as the case where the magnitude of the shortwave flux transmittance is greater than 1.0, the authors used surface solar irradiance and all-sky images obtained at the Yangbajing site in Tibet to analyze the reasons for the occurrence of abnormal shortwave flux transmittance. Based on the International Intercomparision of Three-Dimensional Radiation Code (I3RC) Monte Carlo community model of three-dimensional radiative transfer, the authors also performed simulations at a nonabsorbing wavelength and an absorbing wavelength through a stratocumulus and a cumulus field. The results showed the detection of abnormal transmittance on more than half the days, and the maximum transmittance was 1.34. The probability of the occurrence of abnormal transmittance appeared to be largest in summer, and on a daily basis was mainly at about noon local time. Abnormal transmittance mainly appeared when clear sky and clouds co-existed, especially at the edges of broken clouds and nearby regions with clear-sky conditions. The flux transmittance decreased as the solar zenith angle increased.
Solar radiation is a significant source of heat on the Earth's surface and in the atmosphere, and the effects of clouds on solar radiation are important for the radiative energy budget since clouds play a critical role in regulating surface shortwave irradiance. The Earth's average cloud fraction is about two-thirds ( Maddux et al., 2010). However, the impact of clouds on solar radiative transfer remains largely unknown.
Solar radiative flux is strongly affected by the macrophysical and microphysical properties of the cloud. In their study, Davis and Marshak (2010) encountered many challenging problems affecting solar radiation transport in the Earth's cloudy atmosphere stemming from the spatial complexity of real clouds and physical complexity of multiple-scattering processes. Many studies have shown that shortwave fluxes simulated by the independent column/pixel approximation (ICA/IPA) technique have obvious errors compared with those of three-dimensional radiation models, and the magnitude of the error is large relative to that of the cloud type and solar zenith angle ( Benner and Evans, 2001; Scheirer and Macke, 2003; Pincus et al., 2005; Gimeno et al., 2012). Therefore, it is crucial to understand the effects of cloud 3D structures on solar radiation.
Generally, the presence of clouds reduces the downward shortwave surface radiation, but clouds may also enhance radiation in specific sky conditions, and may even cause solar radiation at the surface to surpass the level of extraterrestrial global radiation Segal and Davis, 1992; Thiel et al., 1997; Pfister et al., 2003; Yang et al., 2010). However, few detailed studies have been performed on the temporal and spatial distribution of this phenomenon. In this study we investigated the shortwave flux transmittance, T (the ratio of the surface horizontal solar radiation to extraterrestrial radiation) ( Liou, 2002). Generally, the level of transmittance is between 0.0 and 1.0. First, we used one-year in situ data of highly temporal total solar radiation and all-sky images obtained from the Yangbajing site to obtain an intuitive understanding of the phenomenon of abnormal transmittance. Next, we simulated the shortwave radiation flux being transferred through a stratocumulus field and a cumulus field using a state-of-the-art International Intercomparision of Three-Dimensional Radiation Code (I3RC) Community Monte Carlo model. Finally, we attempted to better understand the cloud 3D effect on the shortwave flux.
The Yangbajing site ((30.088°N, 90.540°E); 4350 m), which is annexed to the Chinese Academy of Sciences, is located on the south side of Nyainqentanglha Mountain, which is in the center of the Tibetan Plateau. The radiation and automatic weather instruments were installed by scientists at the Institute of Atmospheric Physics, Chinese Academy of Sciences, with the radiative flux having a 1-min resolution and the all-sky images having a 3-min resolution. The values of surface shortwave irradiance were measured by a Chinese-made TBQ-2-B-I pyrano-meter with a sensitivity of 10.22 μV (W m-2)-1. This kind of solar pyranometer is comparable to other pyranometers, and is widely used in meteorological stations. The instrument associated with the solar pyranometer had also been tested on the rooftop of the No. 40 building at the Institute of Atmospheric Physics before installation at the Yangbajing site.
For the best data of solar radiation, daily quality assurance checks are essential. At the beginning, we used the method recommended by the World Meteorological Organization (WMO), which involves plotting the solar radiation data against solar time to determine the general quality of the global solar radiation data. Then, we adopted the following quality control procedures based on a suggestion from Geger et al. (2002): First, each observed daily (hourly) sum Gd ( Gh) should be less than the daily (hourly) extraterrestrial irradiation received by a horizontal plane located at the same geographical coordinates. Second, the daily (hourly) irradiation should only exceed by a small amount the daily (hourly) irradiation Gd ( Gh) likely to be observed under exceptionally clear skies with a high atmospheric transparency. And third, the daily (hourly) sum Gd ( Gh) should be greater than a minimum value expected in continuous overcast conditions. For quality control purposes, 349 observation days produced results that were suitable for our study.
Monte Carlo radiative transfer solves the radiative transfer equation by sampling the trajectories of a large number of photons. In this study we used the I3RC Monte Carlo community model of 3D radiative transfer (I3RC-community-monte-carlo), together with the March 2009 Cornish-Gilliflower release, which is available online at http://code.google.com/p/i3rc-monte-carlo-model. The I3RC-community-monte-carlo model, which studies the interaction of monochromatic radiation with cloudy atmospheres, can calculate radiative fluxes and radiances at the boundaries, column absorption, and flux divergence throughout the domain, while providing both scene average values and complete fields. The I3RC-community-monte-carlo model has been tested for all of the I3RC phase I cases (http://i3rc.gsfc. nasa.gov/ cases_new.html), and has been found to be somewhat superior for computing the downwelling flux, and is much more efficient at computing domain-average fluxes and flux divergence profiles than the Spherical Harmonic Discrete Ordinate Method (SHDOM) ( Cahalan et al., 2005; Pincus and Evans, 2009). In our study, the simulation used 109 photons to guarantee precision, based on a suggestion from Evans and Marshak (2005).
The I3RC Community Monte Carlo radiative transfer code contains a series of modules and several programs, and at the heart of the model is a monochromatic integrator Pincus and Evans, 2009). The simulations mainly included the following seven steps:
1) Define the single scattering phase function for one or more drop sizes and store this in an object representing the phase table;
2) Define the spatial domain of the problem to create a new object of type domain;
3) Define the cloud fields by storing the three-dimen-sionally varying extinction and single scattering albedo in the domain;,
4) Set up the radiative transfer problem by giving the 3D cloud fields to an object of type integrator;
5) Seed the random number generator;
6) Specify the solar illumination;
7) Compute the radiative transfer and record the results.
In this study we used a stratocumulus field ( Moeng et al., 1996) and a cumulus field ( Stevens and Lenschow, 2001), both of which were produced by large-eddy simulations as the input of the Monte Carlo model. The important parameters to parameterize the cloud optical properties are the liquid water content and effective particle radius. The two water clouds provided a complete 3D description of the liquid water content and an effective particle radius with high resolutions and good representativeness, which were just what the model inputs needed. The stratocumulus cloud field consisted of 64×64×16 ( x× y× z) cells with a grid size of 55×55×25 (units: m), while the cumulus cloud field consisted of 100×100×36 ( x× y× z) cells with a grid size of 66.7×66.7×40 (units: m).
We first analyzed the shortwave flux transmittance, T, between 1000 and 1900 (Beijing time) BT at every minute (for the Yangbajing site, BT is about two hours later than local solar time, which means that it was around 0800 local solar time in Yangbajing when it was 1000 in Beijing). Table 1 shows the numeric distribution of the abnormal transmittance, and n is the number of occurrences of abnormal transmittance between 1000 and 1900 BT in a single day (total of 540 samples). In order to avoid the random error introduced by calculations, and to ensure the viability of the analysis data, we omitted 43 days for which n was≤5. For 21.49% of the days (75 days), n was detected to be between 10 and 30, which accounted for the largest part of the whole year, followed by n being between 30 and 50 on 49 days. For six days, n was greater than 90; these days were 23 May, 28 May, 10 June, 24 June, 17 July, and 11 October 2009. For example, on 10 June, n was 151, which is a rare occurrence, and which may only happen in unique regions such as the Tibetan Plateau. The peculiar conditions of the Tibetan Plateau, such as high altitude, low aerosol concentration, and low atmospheric optical depth, lead to high values of downward shortwave radiation. In addition, the Tibetan Plateau has intense topography, which can induce convective orographic clouds ( Kurosaki and Kimura, 2002). Furthermore, clouds may enhance incoming solar radiation at the surface. Therefore, the phenomenon of abnormal transmittance is usually observed over the Tibetan Plateau but rarely observed at low altitude regions.
| Table 1 Number of days and the corresponding percentage of the year for which the phenomenon of abnormal transmittance T occurs in a one-year period. |
Figure 1 shows some cloud images at the moment of the appearance of abnormal transmittance. Figures 2a-d illustrate the daily variation of the shortwave flux transmittance per minute in the first four days of the six days when n surpassed 90. Three-dimensional clouds have a large influence on the transport of solar radiation, causing significant fluctuations in the flux transmittance over time. Clouds may make surface solar radiation levels exceed the expected extraterrestrial value, while they generally reduce the incoming solar radiation at the surface. Under both clear and overcast conditions, T conforms to the regulations, remaining below 1.0. However, T will be greater than 1.0 under some cloud conditions where clear sky and cloud coexist, especially under broken clouds when the direct solar radiation component is almost unaffected and the diffuse radiation increases. The peak value of T was around 1.34 during the observation.
 | Figure 1 Sky images taken during the phenomenon of abnormal transmittance. |
Figure 2e illustrates the seasonal distribution of the abnormal transmittance. The largest amount of abnormal transmittance occurs in summer, accounting for about 36%, which corresponds with the fact that cloud activities are exuberant and vibrational in summer. This is followed by spring, which accounts for 24%; autumn, which accounts for 20%; and winter, which accounts for 19%. Figure 2f shows the annual mean diurnal cycle of the hourly probability density distribution of T. On a daily timescale, the percentage substantially increases with time, and becomes a maximum of 15% at 1400-1459 BT, before decreasing gradually over time. The above research partly corresponds to the cloud amount statistics over Yangbajing ( Huo and Lu, 2012). For the Yangbajing site, cloud amounts are higher in summer than in winter, and cloud frequencies are the highest during the afternoons in summer. Cloud amounts gradually increase throughout the morning and reach a peak in the late afternoon, after which they decrease gradually ( Huo and Lu, 2012). We observed that the variation of T is not always consistent with that of the cloud amount. This is because the macrophysical and microphysical properties of clouds also have a large effect on solar radiation; however, these effects are not easily quantified.
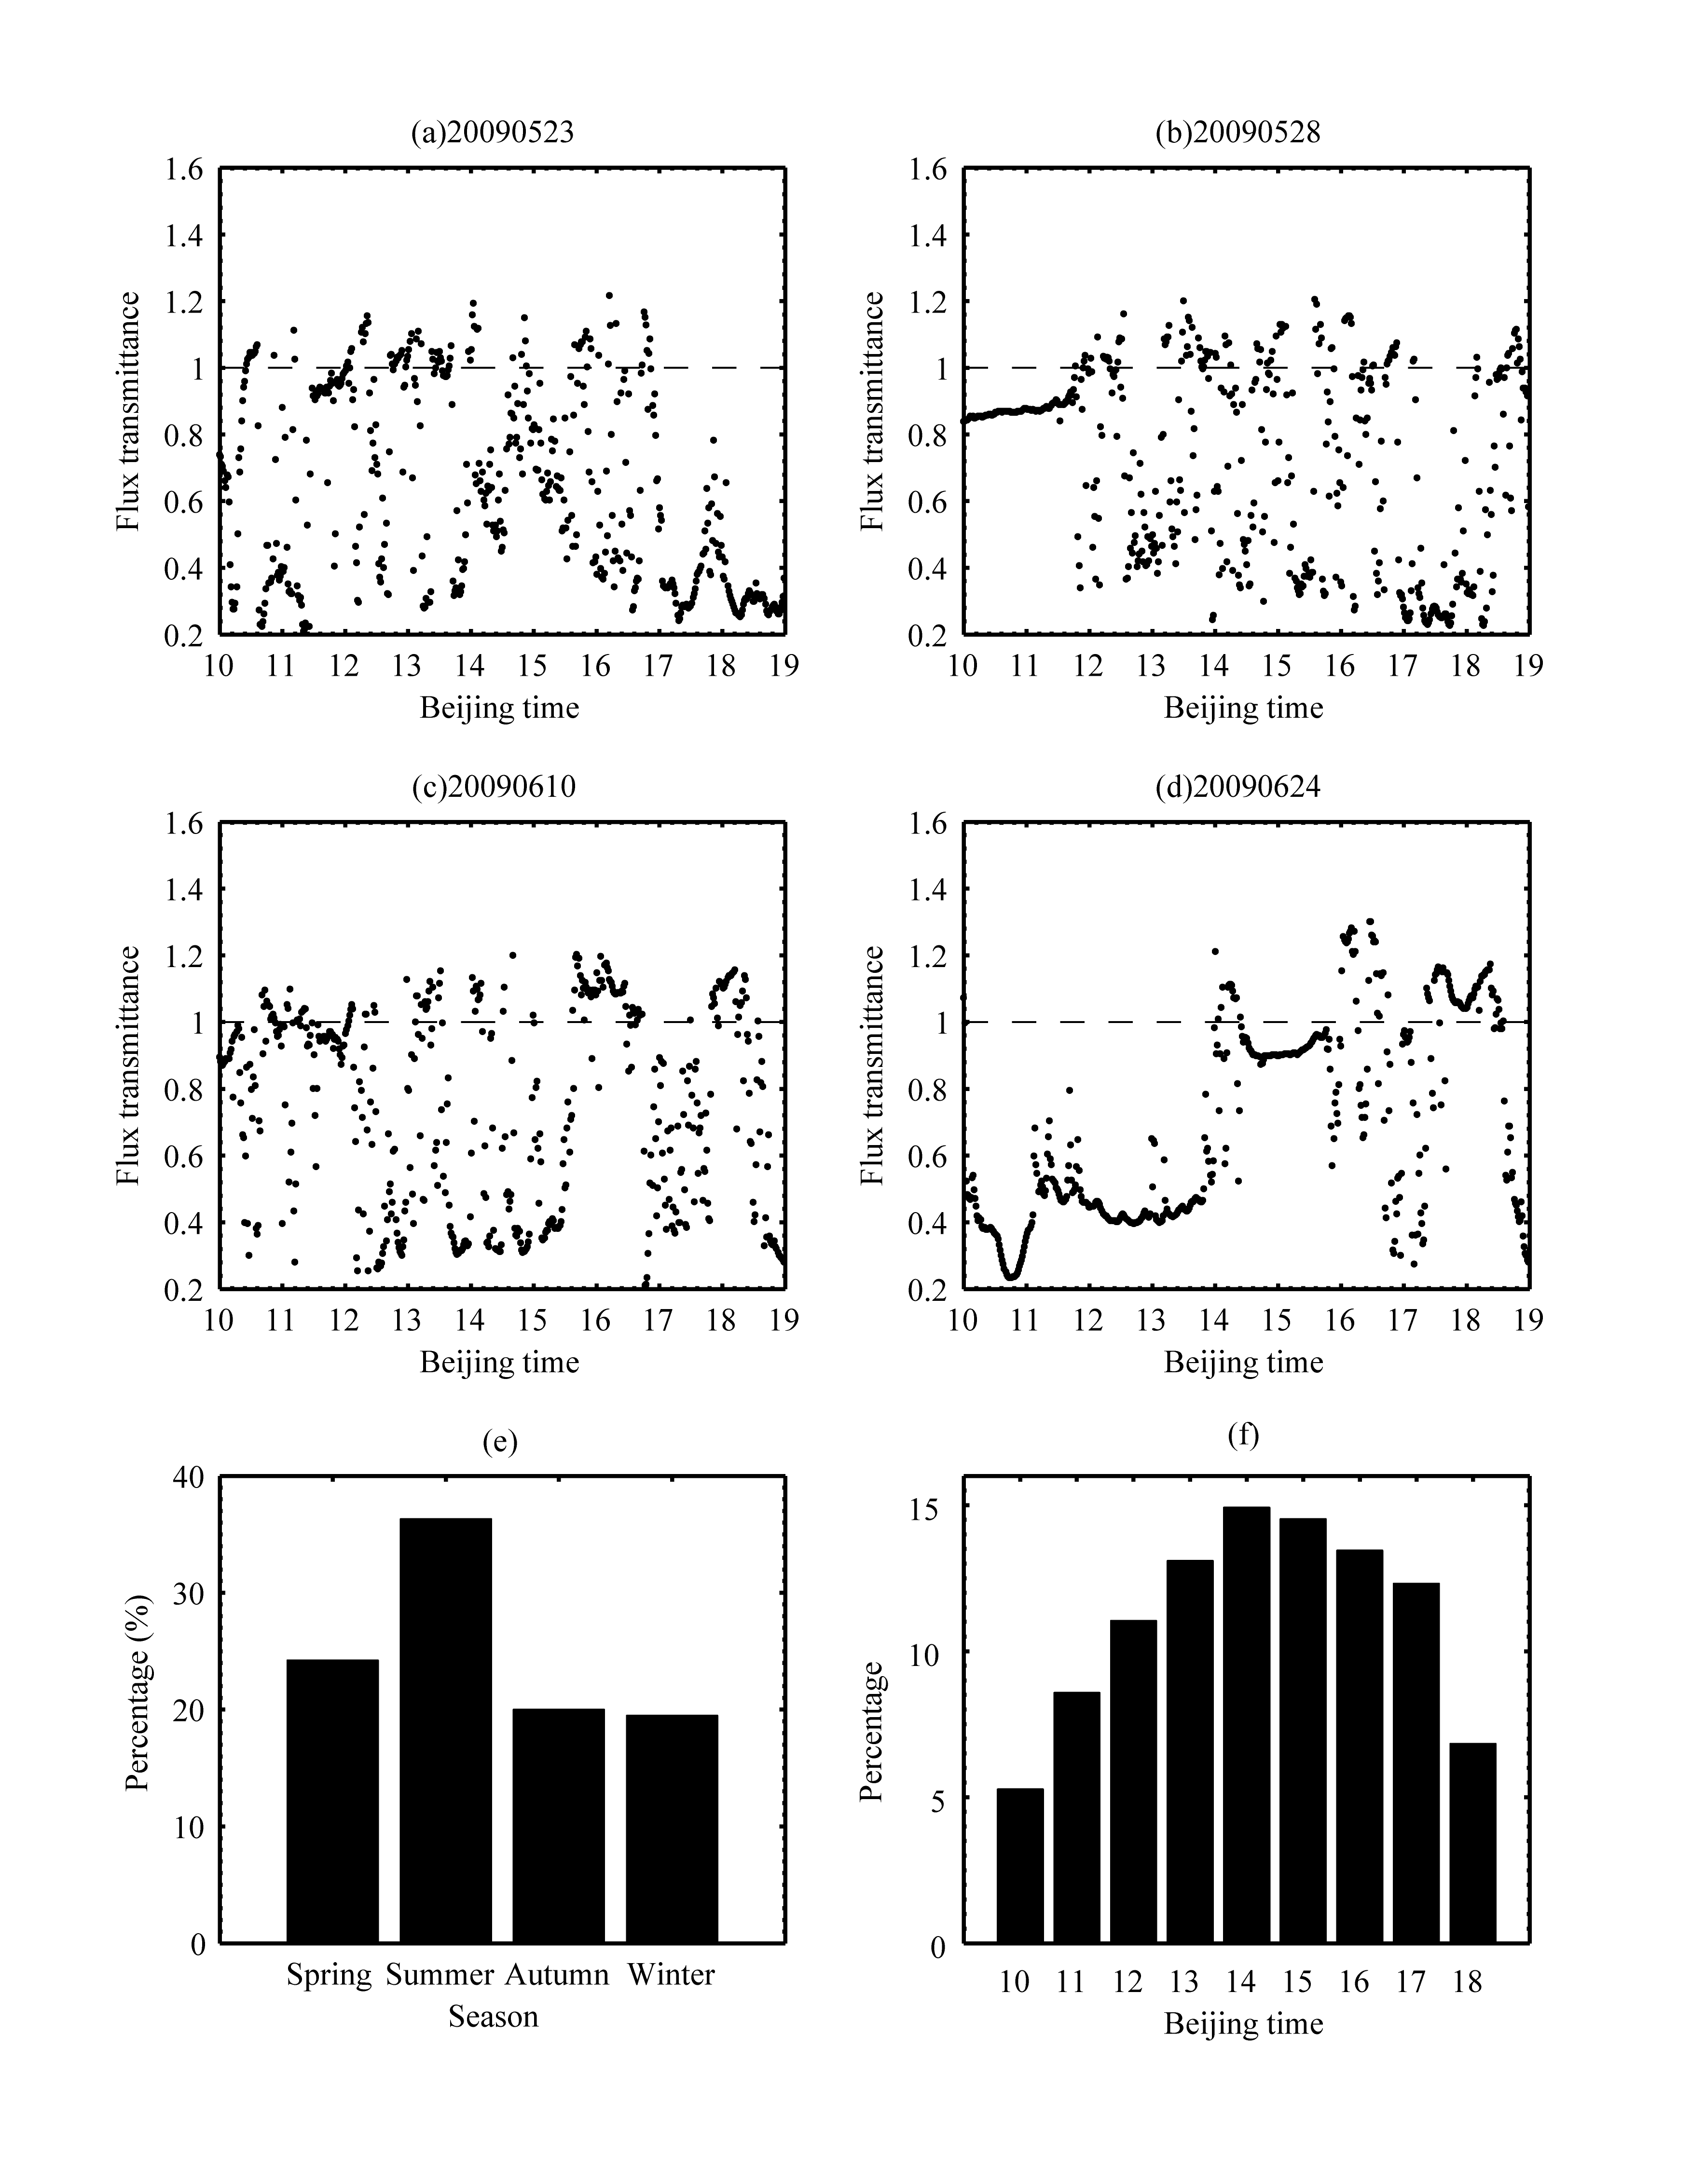 | Figure 2 Temporal distribution of the abnormal transmittance, T. |
In this study, to ensure better accuracy for examining the interplay of clouds and solar radiation, we performed simulations at a nonabsorbing wavelength in the visible spectrum (0.675 µm) and an absorbing wavelength in the near-infrared spectrum (2.13 µm) without considering the atmosphere. In order to convert the cloud water content to optical properties, we assumed that the cloud water was divided into droplets whose sizes follow a gamma droplet size distribution with an effective variance of 0.1. The Henyey-Greenstein scattering phase function with an asymmetry parameter of 0.85 was assumed throughout the cloud. For all calculations, the sun azimuth was set to 0° (in this study, 0° means that the sun's rays are directed from the direction of increasing x), and the surface albedo was set to zero. The flux was normalized to 1 on a horizontal plane.
Figure 3 shows two cloud fields. The largest value of the liquid water content was 4.26 g m-3 for stratocumulus and 1.82 g m-3 for cumulus clouds. With respect to the effective particle radius, the maximum was 24.18 µm for stratocumulus, and 14.44 µm for cumulus clouds. This paper only demonstrates the cloud optical depth at 0.67 µm, since the cloud optical depth in the visible and near- infrared spectrum shows little change.
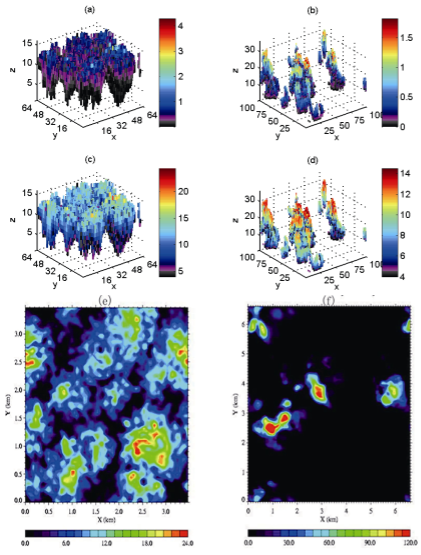 | Figure 3 (a, b) Liquid water content (g m-3), (c, d) effective particle radius (µm), and (e, f) optical depth at 0.67 µm of (a, c, e) stratocumulus and (b, d, f) cumulus. Note: the photographs corresponding to the cloud optical depth at 0.67 µm were adopted from I3RC: http://i3rc.gsfc. nasa.gov/cases_new.html. |
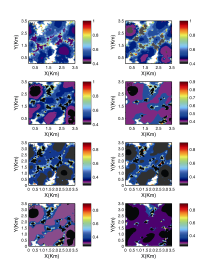
Figure 4 shows the distributions of the shortwave fluxtransmittance of stratocumulus clouds. Figures 4a-d are at 0.675 µm, and Figs. 4e-h are at 2.13 µm. For each simulation at a certain wavelength, the solar zenith angle was 0° for Figs. 4a and 4e, 30° for Figs. 4b and 4f, 45° for Figs. 4c and 4g, and 60° for Figs. 4d and 4h. For the regions with white color, the transmittance was greater than 1.0, which means that the enhancement of the radiation caused by cloud cover is more evident than the reduced effect. T at 0.675 µm was 0.727, 0.686, 0.631, and 0.543, respectively, and T at 2.13 µm was 0.556, 0.512, 0.457, and 0.375, respectively. It is obvious that Tdecreases as the solar zenith angle increases. At the same time, the cloud absorption strengthens with the increase of the solar zenith angle in the absorptive wavelength (not shown).
 | Figure 4 Shortwave flux transmittance of stratocumulus at (a-d) 0.675 µm and (e-h) 2.13 µm. Solar zenith angle: (a, e) 0°, (b, f) 30°, (c, g) 45°, and (d, h) 60°. |
When the solar zenith angle is 0°, the cloud field is in direct sunlight, and the I3RC-community-monte-carlo model is ideal for the simulation. The shortwave flux transmittance results agree well with the distribution pattern of the cloud optical depth. As the solar zenith angle increases, the shaded areas caused by the clouds become larger, and mutual influences internal to the clouds are more important, so the effects of the clouds' inhomogeneity on the solar radiation transfer become more obvious. As the solar zenith angle increases, the congruent relationship between T and the cloud optical depth becomes obscure, and the distribution of T becomes more uniform.
The abnormal transmittance mainly presents at the edges of broken clouds and nearby clear-sky regions because of enhancements in the diffused radiation. For the stratocumulus clouds, the maximum transmittance was about 1.67 at 0.675 µm and 1.55 at 2.13 µm. For the 0.675 µm case, when the solar zenith angle was 0°, about 15% of the grid cells presented the abnormal transmittance, followed by 12% for an angle of 30°, 10% for 45°, and 5% for 60°. However, for the absorbing wavelength (2.13 µm), about 11% of the grid cells presented the abnormal transmittance when the solar zenith angle was 0°, followed by 9% for an angle of 30°, 7% for 45°, and 3% for 60°.
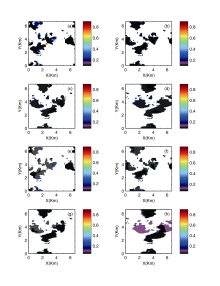
Figure 5 displays the distribution of the shortwave flux transmittance for cumulus clouds. Figures 5a-d are at 0.675 µm, and Figs. 5e-h are at 2.13 µm. The maximum transmittance was about 1.30 at 0.675 µm and 1.23 at 2.13 µm. More than 70% of the grid cells displayed abnormal transmittance when the sun was high. The fluctuations of the cloud tops are very obvious, so there is always multiple scattering of light among the different cloud tops. As the solar zenith angle increases, more photons may enter the cloud fields from their sides, and photons lower in the cloud need to change direction only slightly to begin traveling upward so that transmission is decreased.
Using in situ data obtained at Yangbajing, we analyzed the appearance of the phenomenon whereby the surface global solar irradiance surpasses the extraterrestrial irradiance. Abnormal transmittance was observed on more than 54% of the days, and the peak value of T was around 1.34 during the observation. The number of occurrences of the abnormal transmittance during daytime reached as high as 151 for a single day, which shows that the impact of cloud 3D structures on solar radiation transfer is very significant in the Tibetan Plateau. The probability that the abnormal transmittance will appear is largest in summer, followed by spring, autumn, and winter. On a daily time scale, the abnormal transmittance occurs mostly around noon, local time.
 | Figure 5 Shortwave flux transmittance of cumulus at (a-d) 0.675 µm and (e-h) 2.13 µm. Solar zenith angle: (a, e) 0°, (b, f) 30°, (c, g) 45°, and (d, h) 60°. |
In addition, the simulated results also showed that the abnormal transmittance commonly occurs in conditions where clear sky and clouds coexist, especially at the edges of broken clouds and near to regions with clear sky. The flux transmittance decreases as the solar zenith angle increases. For to the stratocumulus cloud, when the solar zenith angle was 0°, about 15% of the grid cells at 0.675 µm presented an abnormal transmittance, while about 11% did so at 2.13 µm. For the cumulus cloud, more than 70% of the grid cells displayed abnormal transmittance.
This study used only virtual clouds as the model input. In the future, we may try to build a true cloud field based on ground observation and satellite products, and then use them as the model inputs to perform additional studies.
| 1 |
|
| 2 |
|
| 3 |
|
| 4 |
|
| 5 |
|
| 6 |
|
| 7 |
|
| 8 |
|
| 9 |
|
| 10 |
|
| 11 |
|
| 12 |
|
| 13 |
|
| 14 |
|
| 15 |
|
| 16 |
|
| 17 |
|
| 18 |
|
| 19 |
|