Polarimetric Study of the Fine Aerosol Fraction in Beijing
[Mikhail A. SVIRIDENKOV1 , Alexander S. EMILENKO1 , WANG Pu-Cai2  , WANG Geng-Chen
2 ]
, WANG Geng-Chen|
|


Measurements of aerosol optical characteristics were carried out with a Photoelectric Aerosol Nephelometer (PhAN) in Beijing and at Xinglong Observatory, which is located 150 km northeast of Beijing. Aerosol size distributions were retrieved by means of the inverse problem solution. Mean volume size distributions of the fine aerosol fraction were unimodal with the maximum radius in the range 0.11-0.15 μm. Accumulation of aerosol matter in the air basin of Beijing takes place mainly due to the growth of particle size, but not their number. A simple optical method to detect aerosol nonsphericity is proposed.
Atmospheric aerosol is a product of a variety of natural and anthropogenic sources as well as different physical and chemical processes and meteorological parameters. The development of industry and growth in the number of vehicles may cause an increase in aerosol pollution in big cities and industrial regions. Studying the aerosol characteristics in megacities is important from a variety of view points, including climatological, ecological, and human health aspects. Atmospheric aerosol, covering several decimal orders on the size scale, is a superposition of several fractions with different origins and compositions. Aerosol optical properties in the visible spectral region are determined mainly by the fine fraction, except for extreme situations such as dust storms. The A.M. Obukhov Institute of Atmospheric Physics, Russian Academy of Sciences (RAS), and the Institute of Atmospheric Physics (IAP), Chinese Academy of Sciences (CAS), began collaborating in the 1990s on a joint study looking at the pollution in the Beijing air basin. Optical properties of the fine aerosol fraction have been investigated using a Photoelectric Aerosol Nephelometer (PhAN). In the present paper, the results of measurements taken in the period 2003-2010 except 2008), and some results obtained in 2002, are considered. Measurements from Mountain Observatory Xinglong are also used as a comparison with the Beijing observations.
The PhAN with enclosed scattering volume is capable of measuring seven parameters of aerosol light scattering: the angular scattering coefficient, D, at a scattering angle of 45° and effective wavelengths of 410, 510, and 630 nm, and the polarized constituent at a scattering angle of 90° and wavelengths of 450 and 520 nm. The light source is a filament halogen lamp. The spectral bands are selected by filters composed of colored glass. The air flow is pumped continuously through the instrument chamber by means of a compressor. The nephelometer was calibrated in absolute units (km-1sr-1) by comparing with an analogous instrument at the V.E. Zuev Institute of Atmospheric Physics (Tomsk, Russia). The latter was precalibrated by gases with known scattering coefficients Panchenko at al., 2008). Measurements were carried out in fall, usually November, with the exception of 2005, in which they were carried out in August. The nephelometer was installed at a building of the IAP, CAS, located in northern Beijing. Observations were conducted in two modes: continuous automatic recording of single characteristics (aerosol scattering at an angle of 45° and wavelength of 510 nm), and periodic measurement of the aforementioned seven parameters. In 2003, 2004, 2005, and 2007, observations were also made with the same instrument at Mountain Observatory Xinglong, located 150 km to the northeast of Beijing, and 960 m MSL. Due to the heating of the air when passing through the nephelometer, the measured optical parameters are close to those of dry aerosol matter.
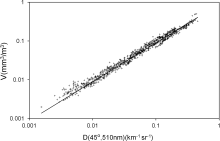
Retrieval of the aerosol size distribution from light scattering measurements is an ill-posed inverse problem with a priori unknown kernel function of the Fredholm's integral equation of the first kind. The chosen strategy of solution consists of two steps. First, the problem is solved for a set of refractive indices; and second, the optimal solution is found using certain criteria. Kernel functions were calculated with an assumption of homogeneous spherical particles using Mie theory. Our method of the inverse problem solution Panchenko at al., 2008) is based on a modification of the iterative technique proposed by Twitty (1975). The value of the particle's refractive index was chosen by the criterion of the minimal norm of the second derivative of the differential particle concentration. According to a series of numerical experiments with model size distributions, the real ( n) and the imaginary ( k) parts of the refractive index can not be determined separately from the information contained in the PhAN measurement data. Only their difference could be firmly retrieved. Such an ambiguity does not affect the result of the solution Panchenko at al., 2008). A narrow spectral interval and scattering angles far from the aureole region limit the interval of the size distribution reliably retrieved to 0.05-0.6 μm, i.e., to the fine aerosol fraction. One of the main characteristics of aerosol pollution is the aerosol volume concentration. Analysis of the results of measurements in different regions (Moscow, Beijing, Xinglong, and Zvenigorod Scientific Station of the IAP/RAS, 50 km to the west of Moscow) and under different conditions and aerosol loadings, varying by several orders of magnitude, showed that the volume aerosol concentration of the fine fraction ( r = 0.05-0.6 μm) is closely related to Dat a scattering angle of 45° and wavelength of 510 nm by a simple relation:
V (mm3 m-3) = D (km-1 sr-1) .
The scatter plot illustrating this relation is presented in Fig. 1.
 | Figure 1 Correlation between angular scattering coefficients ( D(45°, 510 nm)) and volume concentration ( V) of fine aerosols with radius 0.05-0.6 μm. |
Therefore, for the purposes of monitoring the fine fraction content, it is sufficient to measure just the one parameter, i.e., the scattering intensity at an angle of 45°.
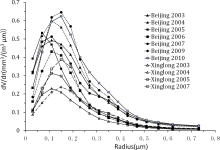
The geometric mean aerosol size distribution for all cycles of observations are shown in Fig. 2. As can be seen, aerosol loading in Beijing is much greater than at Xinglong Observatory. However, the positions of the maximum of the volume size distributions do not differ significantly. All are located in the range 0.11-0.15 μm. The only exceptions are the data obtained in 2005. As mentioned above, the 2005 measurements were carried out in summer, while in other years they were carried out in fall. It is possible that such a distinction is a consequence of the seasonal variability of the aerosol qualitative composition. Maximal mean volume concentration was observed in 2004, 2009, and 2010; while minimal mean volume concentration was in 2006. The typical temporal behavior of the aerosol loading is characterized by periods of gradual growth of the aerosol pollution with duration of several days, interrupted by a change in air mass, usually accompanied by rains. At the maximal stage of the aerosol pollution, visibility decreases to several hundred meters.
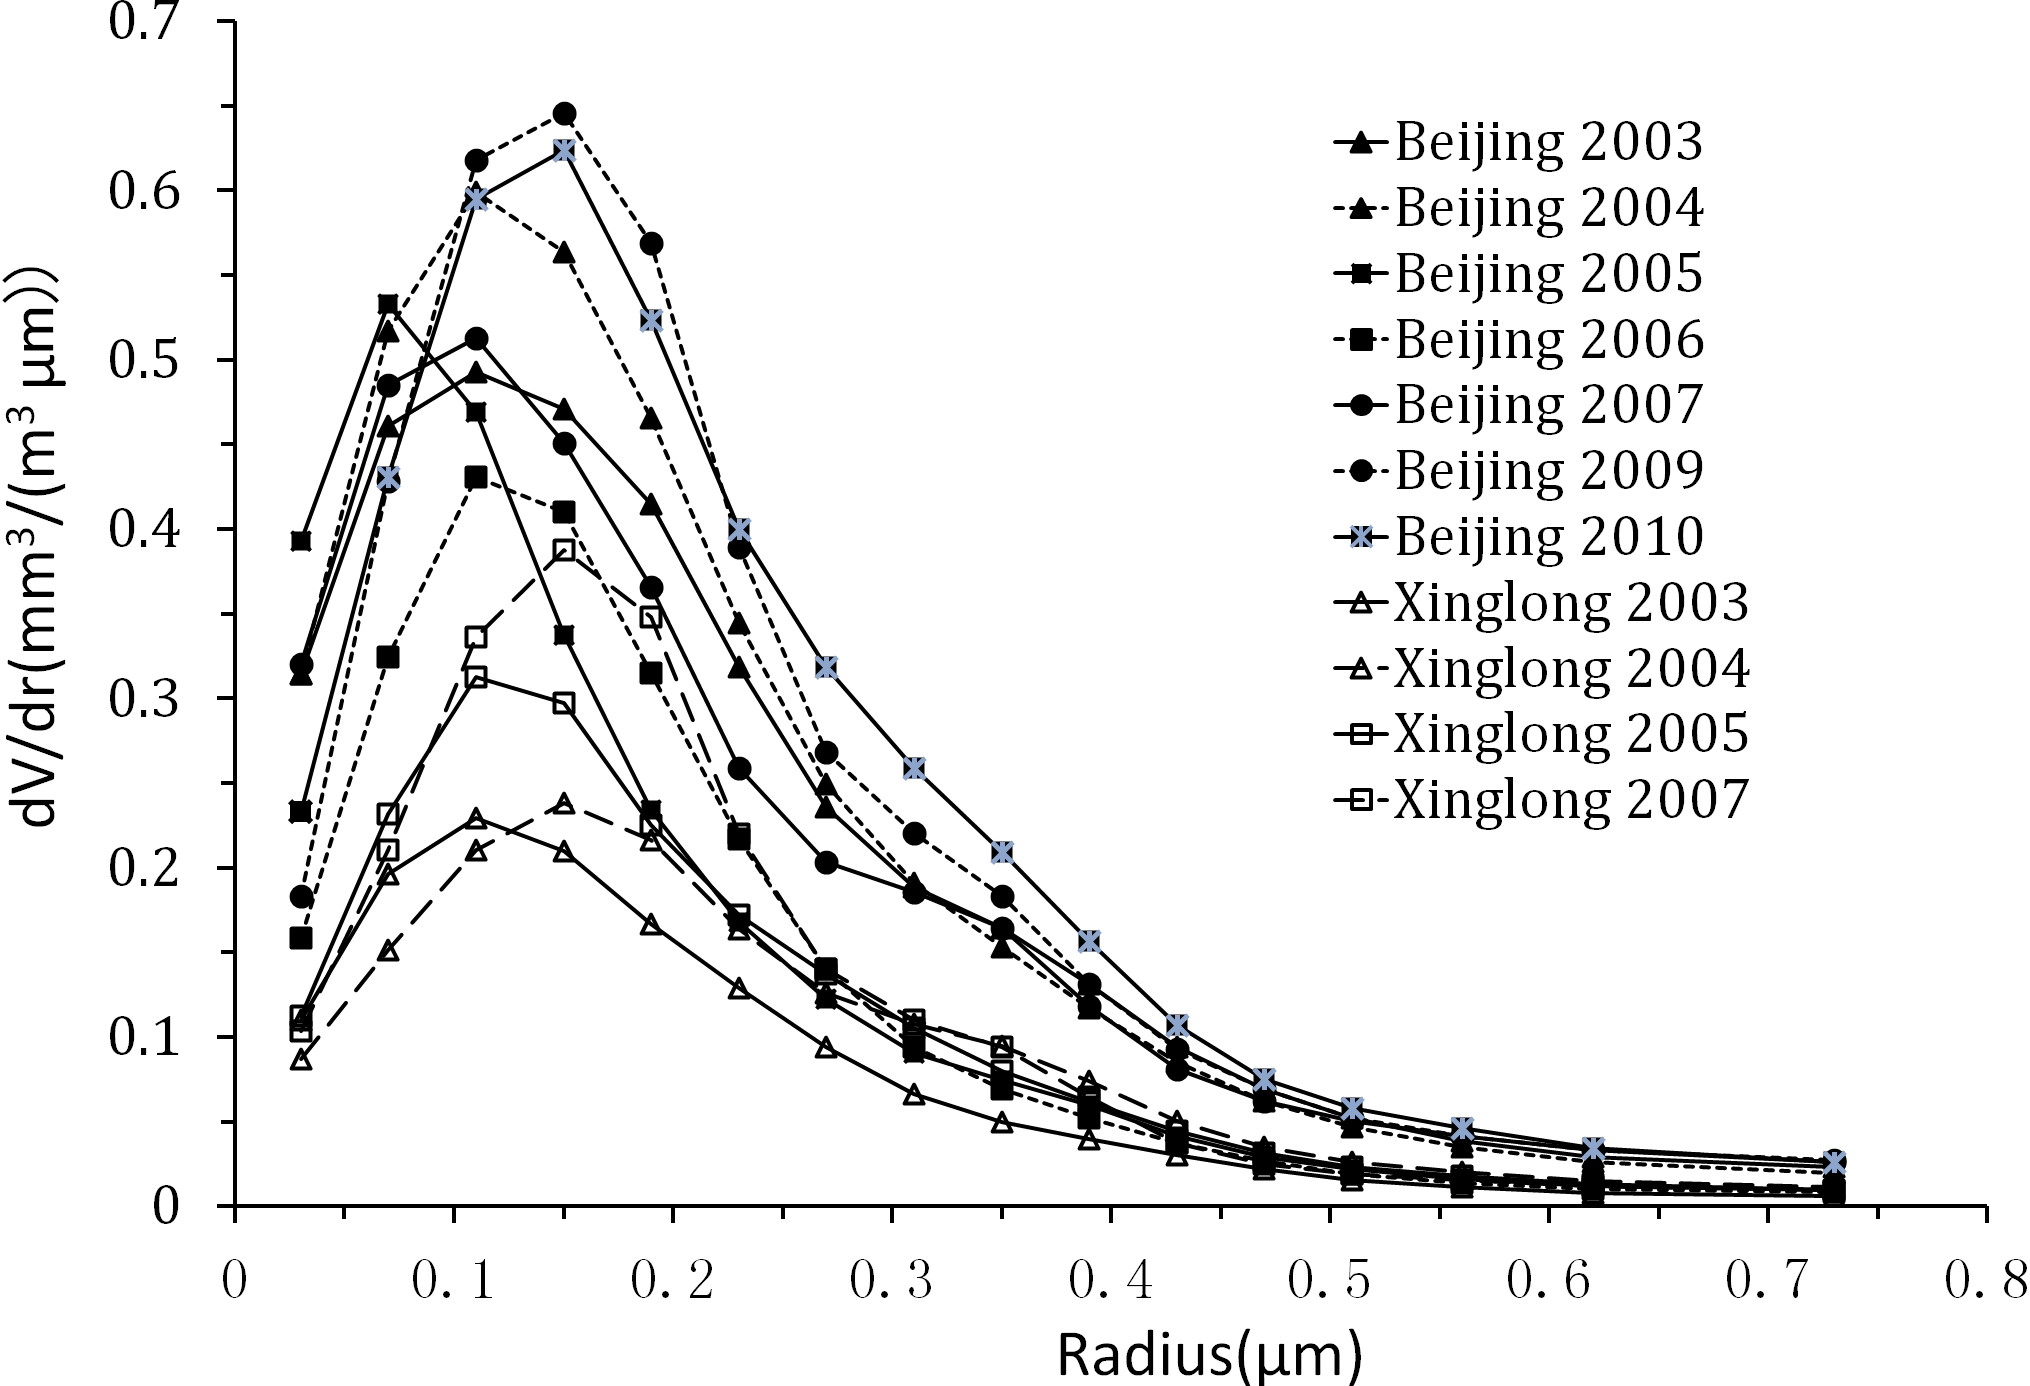 | Figure 2 Seasonal mean volume size distributions. All measurements were taken in fall (November), except for 2005, which were taken in summer (August). |
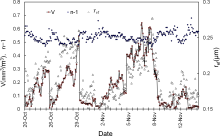
One of the episodes of extreme aerosol pollution in 2003 was analyzed in detail Sviridenkov at al., 2006). The prominent peculiarities of the aerosol transformation during episodes of high aerosol loading are growth of the effective radius, rather than the number concentration, and decrease of the refractive index and black carbon fraction. This was further confirmed by the following observations. A series of several consecutive periods of strong aerosol accumulation were recorded in 2009. Figure 3 illustrates the temporal behavior of the volume concentration of the fine fraction ( V); the effective radius ( ref), which is defined as 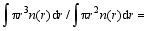

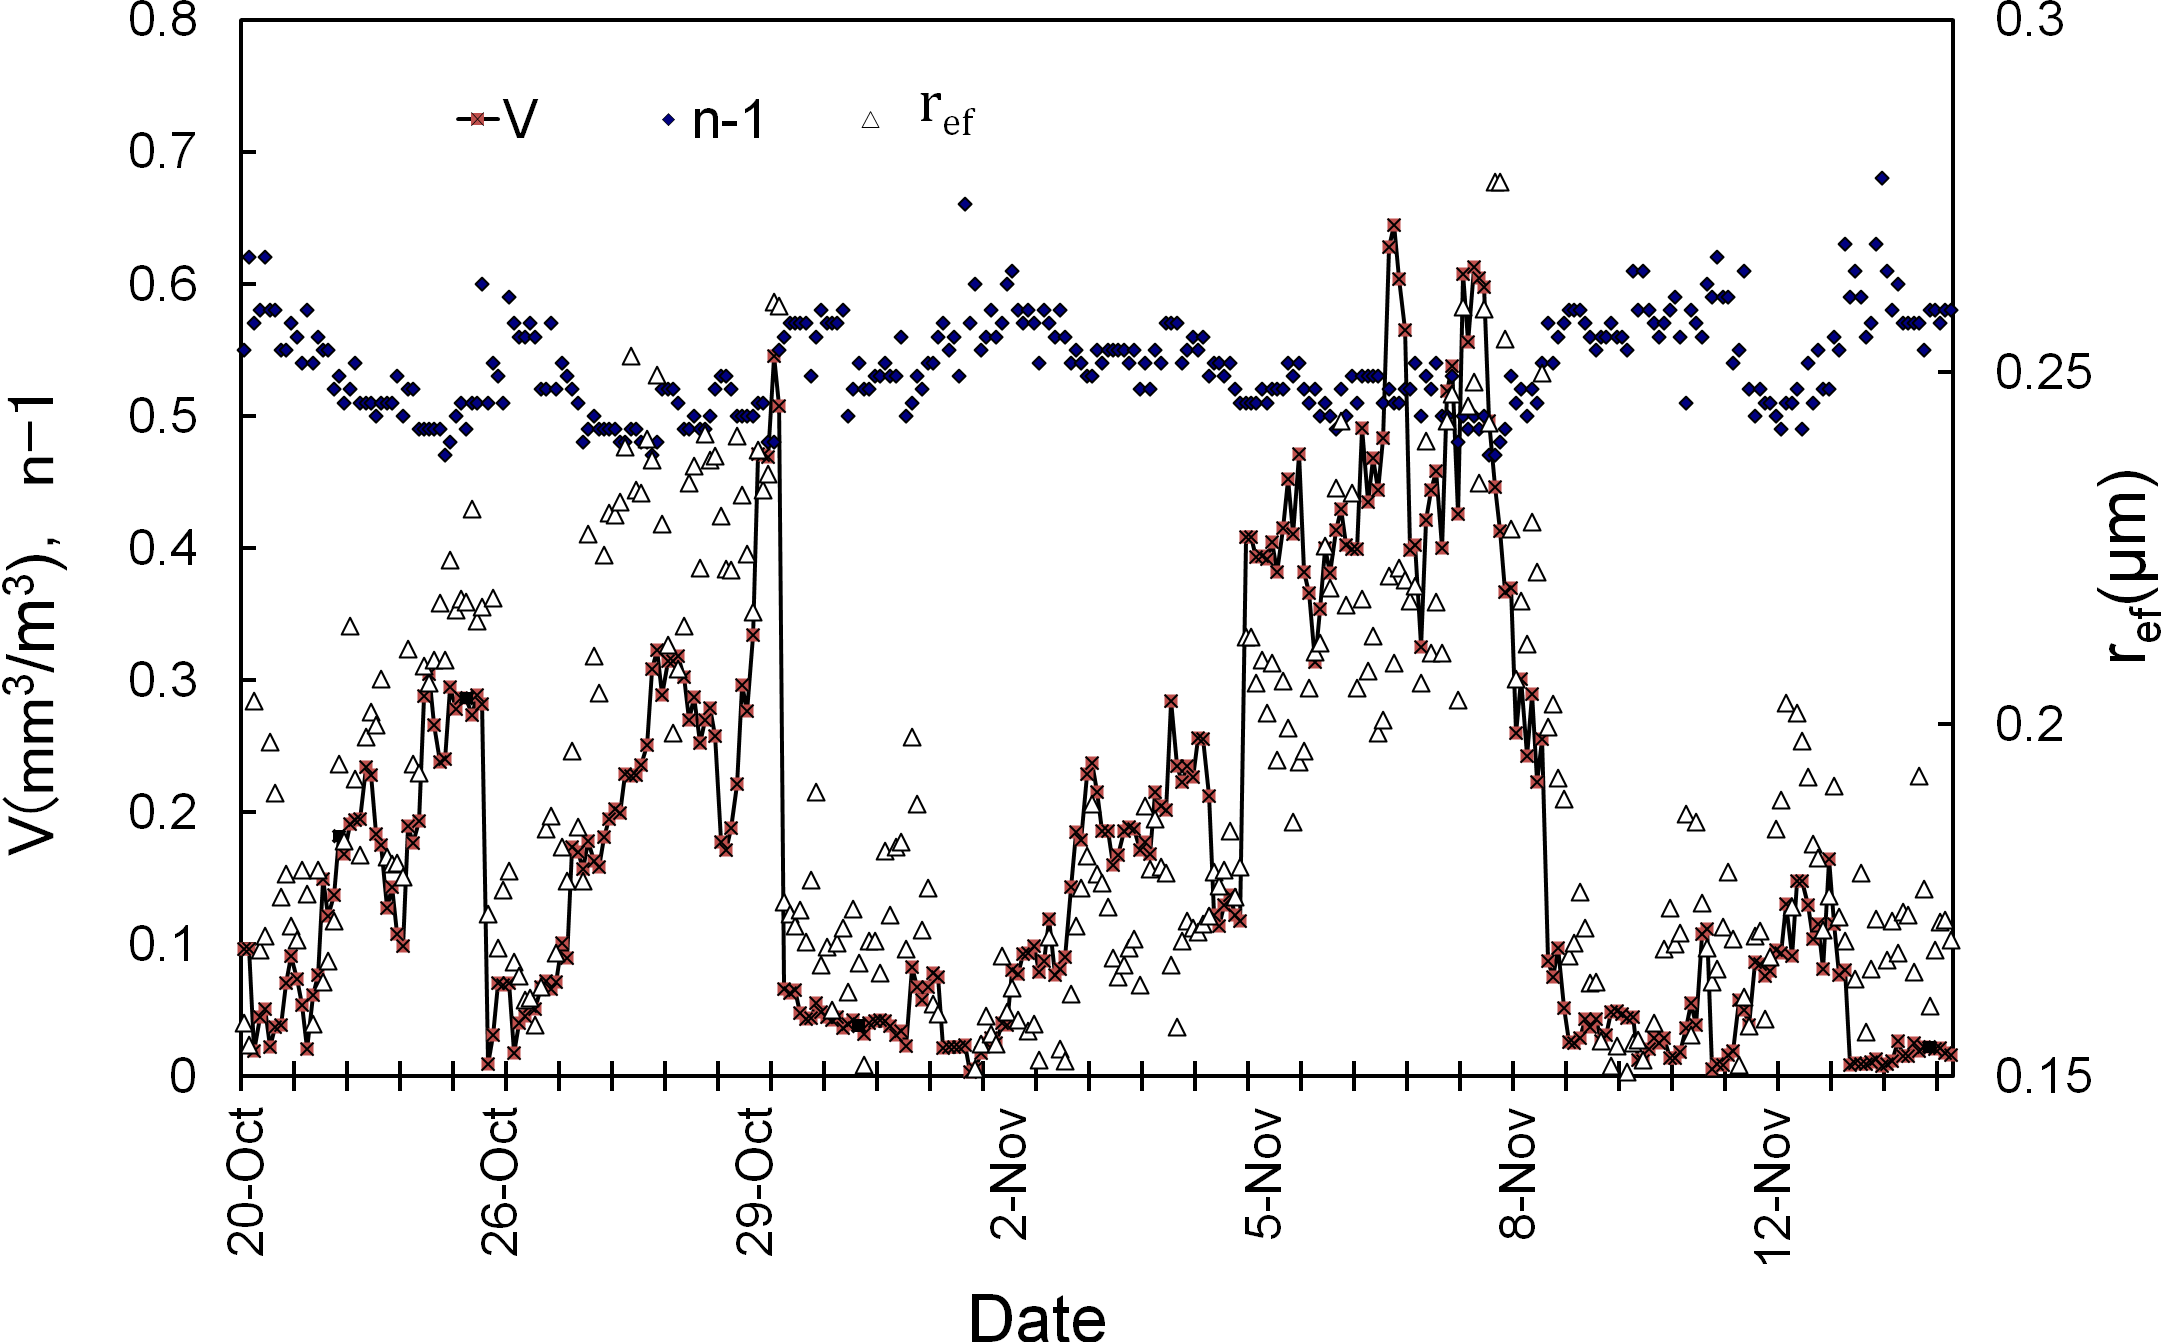 | Figure 3 Time series of volume concentration ( V), effective radius ( ref), and refractive index ( n) during fall 2009 in Beijing. Note, for refractive index, n-1 is presented in order to use a common scale. |
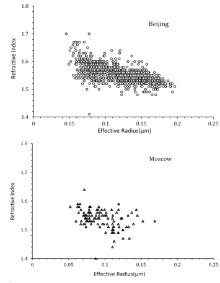
Such an anticorrelation between ref and n is a common feature among all our observations from all the stations mentioned above. This could be explained by processes of condensation of the vapors of volatile species and coagulation of microdispersed particles on the fine fraction in aerosol transformation ( Sviridenkov et al., 2006). Scatter plots are shown in Fig. 4 for Beijing and Moscow (plots for Xinglong and Zvenigirod are omitted because of their similarity). It should be noted that, according to Fig. 4, the intervals of effective radius variations are similar at the three locations, and the distinctions in mean volume concentration are caused by the difference in mean number concentration.
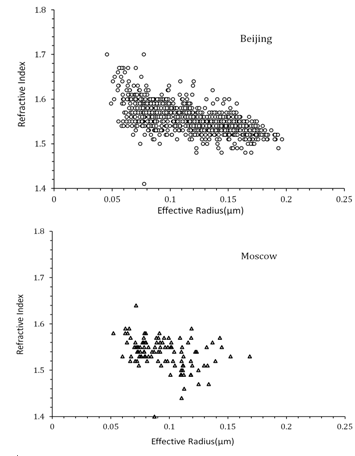 | Figure 4 Correlation between effective radius and refractive index of the fine aerosols for Beijing and Moscow stations. |
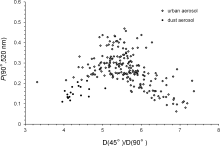
During the measurement periods, several situations involving intrusions of dust aerosol were recorded. Although in dust aerosol the coarse fraction prevails Dubovik at al., 2002), fine-fraction particles are also present. Dust particles are nonspherical. Therefore, the inverse problem in the Mie approximation cannot be solved. However, a set of measured optical parameters allows the diagnosis of the nonsphericity of particles. Relations between three parameters (degree of linear polarization at 90° ( P), Angström exponent ( A), and the ratio R= D(45°) / D(90°)) are quite different from those possible for spherical particles. For a given R, the measured P and A in dust conditions are much less than for spherical particles. In turn, P is greater than it should be to match A. An example for the pair R-P is shown in Fig. 5.
 | Figure 5 Degree of linear polarization ( P (90°, 520 nm)) vs. ratio of angular scattering coefficient ( D (45°, 510 nm)) to ( D (90°, 520 nm)) in dust and typical conditions for Beijing in 2002. |
Analysis of measurements with a PhAN in Beijing showed the appropriateness of the instrument and method used for the optical study of the fine aerosol fraction. Microphysical parameters retrieved by means of the inverse problem solution change consistently in processes of aerosol accumulation in the surface layer of the urban atmosphere. Mean distinctions in volume concentration between different observation sites are caused mainly by differences in number concentration. A simple method for the optical detection of nonspherical dust particles is proposed.
| 1 |
|
| 2 |
|
| 3 |
|
| 4 |
|