

Surface Trace Gases at a Rural Site between the Megacities of Beijing and Tianjin
[RAN Liang1 , LIN Wei-Li2  , WANG Pu-Cai
1 , DENG Zhao-Ze1 ]
, WANG Pu-Cai|
|


The North China Plain (NCP) has recently faced serious air quality problems as a result of enhanced gas pollutant emissions due to the process of urbanization and rapid economic growth. To explore regional air pollution in the NCP, measurements of surface ozone (O3), nitrogen oxides (NO
Trace gases such as sulfur dioxide (SO2) and nitrogen oxides (NO x = NO + NO2) primarily come from anthropogenic emissions in populated regions. SO2 is largely emitted from coal combustion in power plants and domestic heating facilities, thus it serves as a reliable anthropogenic pollution indicator. SO2 could play an important role in aerosol formation and acid precipitation, which have also long been environmental concerns Seinfeld and Pandis, 1998). NO x is short-lived and mainly released from motor vehicles, power generation, and industrial processes. In addition, NO x is a critical precursor of the secondary gas pollutant ozone (O3). In the presence of sunlight, O3 is produced via a chain of photochemical reactions involving NO x and volatile organic compounds ( Haagen-Smit et al., 1953). A high concentration of O3 is detrimental to human health and vegetation National Research Council, 1991; Chameides et al., 1994). The ozone problem has become a prevalent and complex environmental issue in the world (e.g., Chan and Yao, 2008; Stephens et al., 2008; Ran et al., 2009; Mao et al., 2010).
In the past decades, economic growth and urbanization has fostered the development of a cluster of cities including two megacities, Beijing and Tianjin, in the North China Plain (NCP). Due to the significant increase in the anthropogenic emissions of primary gaseous pollutants ( Streets and Waldhoff, 2000; Van der A et al., 2008), the NCP has become one of the most polluted regions in the world (e.g., Shao et al., 2006; Lin et al., 2011). To better understand the impacts of city clusters and megacities on regional air pollution in the NCP, observations of gas pollutants at rural sites sitting in the city cluster would be insightful. The fingerprints of regional pollution and regional transport have been observed at a few rural and suburban sites ( Wang et al., 2006; Ma et al., 2007; Lin et al., 2009; Xu et al., 2011a, b; Ge et al., 2012; Ran et al., 2012). High concentrations of gas pollutants were found to be usually associated with winds from the southwest-south sector. In this paper, we describe the characteristics of surface trace gases, including SO2, NO x, and O3, measured during May and November 2013 at a rural site, Xianghe, between the megacities of Beijing and Tianjin. Possible factors contributing to the observed seasonal and diurnal variations of these trace gases are analyzed and discussed.
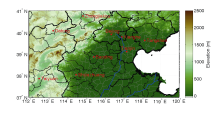
The Xianghe station (39.80°N, 116.96°E) is a rural site located in a small town in Hebei Province and operated by the Institute of Atmospheric Physics, Chinese Academy of Sciences. As shown in Fig. 1, the site lies about 45 km east-southeast of the megacity of Beijing and 70 km north-northwest of the megacity of Tianjin. To the southwest of the site there is a cluster of cities and towns, among which is a large city and industrial center with a population of over four million, Langfang, which is only about 30 km away. The site is in a well-vegetated and sparsely populated area, approximately 4 km to the west of the town center. The town of Xianghe is a transportation hub in the NCP, with an indigenous population of 330000 and more than 300000 migrants, with four railways, six highways, and four national roads surrounding or passing across the area. The mainstay industry in Xianghe is furniture manufacturing.
 | Figure 1 The topography of the Xianghe site and its surroundings. |
O3 and NO x were measured from May to November 2013. The lack of O3 data in August and November was due to the malfunction of the instrument. SO2 was measured during September and November. All the instruments were set up in an air-conditioned room using one inlet about 5 m above the ground. Ambient concentrations of O3 were measured by a non-dispersive ultraviolet (UV) photometer (EC9810B, ECOTECH, Australia), meeting the technical requirements of the USA Environmental Protection Agency (USEPA). The oxides of nitrogen analyzer (EC9841B, ECOTECH) was used to simultaneously quantify NO and NO x using a heated molybdenum NO2 to NO converter and the chemiluminescence technique. Surface SO2 was monitored by a pulsed UV fluorescence analyzer (EC9850B, ECOTECH). Multipoint calibrations were performed every two months using a dynamic gas calibrator (Gascal 1100, ECOTECH) and the standard reference gas mixture (NO/CO/SO2 in N2), following USEPA recommendations on quality assurance and quality control USEPA, 2008). The ozone analyzer was calibrated using the TE 49CPS calibrator. All trace gases were recorded as one-minute averages (mixing ratios by volume, ppbv). Meteorological parameters such as wind speed and wind direction were obtained from the automatic weather station installed at the site.
Nitrogen oxides are relevant not only as primary gas pollutants, but also as an important ozone precursor. During the observational period, hourly NO x averages ranged from several ppbv to nearly 180 ppbv in the summer and over 400 ppbv in the fall. Figures 2a and 2b display the average diurnal variation of NO/NO x ratios and NO x concentrations for each month. Generally, there was a valley in the NO x concentrations and NO/NO x ratios in the day and higher values were observed at night. NO x concentrations averaged about 20 ppbv during the day and 30 ppbv at night in the summer, with a NO/NO x ratio between 10% and 30%. In the fall, NO x concentrations and NO/NO x ratios greatly increased, especially when the heating season began in November. Average NO x concentrations during the day were 30, 45, and 50 ppbv in September, October, and November, respectively. NO was found to account for about 20%, 26%, and 28% of the observed NO x concentrations in September, October, and November, respectively. At night, the average NO x concentrations increased to 50 ppbv in September, 90 ppbv in October, and 120 ppbv in November, with a NO/NO x ratio of around 50%.
The analysis of NO x and winds followed the methodology in Xu et al. (2011b) and revealed no apparent wind direction dependence of NO x concentrations (Fig. 3a). Generally, NO x concentrations decreased with increased wind speed. High levels of NO x were mainly observed when the wind speed was below 2 m s-1. This indicated that local emissions from the busy traffic and heating in the cold season should be the major contributor to observed NO x concentrations. The only exception was high NO x concentrations observed under easterly winds when wind speed rose in the heating season, suggesting the influence of emission sources in the town center. In Xianghe, wind speed usually experienced a diurnal variation of high wind speed during the day and low values at night. Thereby, local emissions and the diurnal variations of advection dilution and the planetary boundary layer were thought to be mainly responsible for shaping the diurnal cycle of NO x concentrations and NO/NO x ratios. The stronger removal of NO x through photochemical reactions during the day may also have played a role in the day/night differences. In the day, active photochemical reactions quickly oxidized freshly emitted NO, leading to a low level of NO/NO x ratios, especially in the summer when the temperature and solar radiation favored the photochemical process. After the decreasing of the planetary boundary layer height in the late afternoon, accumulation of NO x accelerated and NO x concentrations rose dramatically before sunrise on the next day. The sharp increase in night-time NO x concentrations found in the cold season was due to significant emissions from heating. The fraction of NO in NO x also increased, as a result of less efficient chemical removal and enhanced emissions in the cold season.
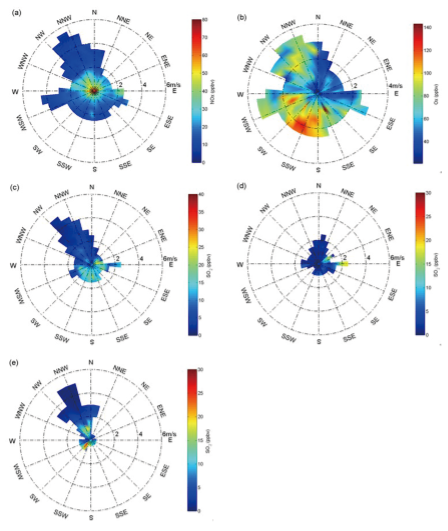 | Figure 3 The dependence of trace gases on wind speed and wind direction: (a) NO x during the whole observational period; (b) O x in summer; (c) SO2 in the daytime (0900-1800 LST) in the fall; (d) SO2at night in the non-heating months of September and October; (e) SO2at night in the heating month of November. The criterion used to examine wind consistency was 0.9 based on 2-h moving averaged wind data. |
The seasonal variation of the secondary gas pollutant, O3, was opposite to that of NO x (Fig. 2c). The generation of O3 was effective during the period when the weather was warm and sunlight was plentiful. In contrast, O3 photochemical production was slowed down in cold weather and O3 was largely consumed by emitted NO. Thus, the average O3 concentrations during May and July were almost twice as much as that during September and October. The highest hourly O3 average was found in May and was close to 240 ppbv, followed by around 160 ppbv in June and July. Compared to the observation in 2005 ( Ma et al., 2007), high ozone events were more notable in Xianghe in 2013. The average ozone daily maximum was about 100 ppbv in May, 76 ppbv in June, and 72 ppbv in July. It was found that the days on which the 8-h ozone averages exceeded 80 ppbv accounted for about 55% of the observational days in May and around 30% in June and July, while in September and October, the observed averages did not exceed 80 ppbv. The diurnal cycle of surface O3 peaked in the afternoon and fell to a low level at night until it reached a minimum in the early morning. At night, the accumulation of primary gas pollutants such as NO aggravated the depletion of O3. In particular, the night-time NO x concentrations in the fall were extremely high, which led to O3 being almost completely depleted. After sunrise, the buildup of O3 concentrations was attributed to the photochemical production and the down-mixing of ozone-rich air.
During the observational period, an O3 episode was observed during 5 and 7 May, when a stagnant high pressure system stayed on the Huanghai Sea to the east of the site. Under the control of the high pressure ridge, southwesterly and southerly surface winds prevailed over the site (Fig. 4b), bringing the air mass from the city cluster in the hinterland of the NCP region and the megacity of Tianjin. As shown in Fig. 4a, the daily maximum O3 concentrations on each day of the episode were 165, 193, and 239 ppbv, respectively, which contributed to about 94% of the observed total oxidant (O x = O3 + NO2) concentrations. The O3levels that exceeded 150 ppbv lasted for 3, 7, and 10 hours on 5, 6, and 7 May, respectively. The high O3 concentrations under the influence of southwesterly and southerly winds accompanied by the low level of NO/NO x ratios, indicated an aged air mass and suggested that regional transport was the major contributor to the observed high O3 level.
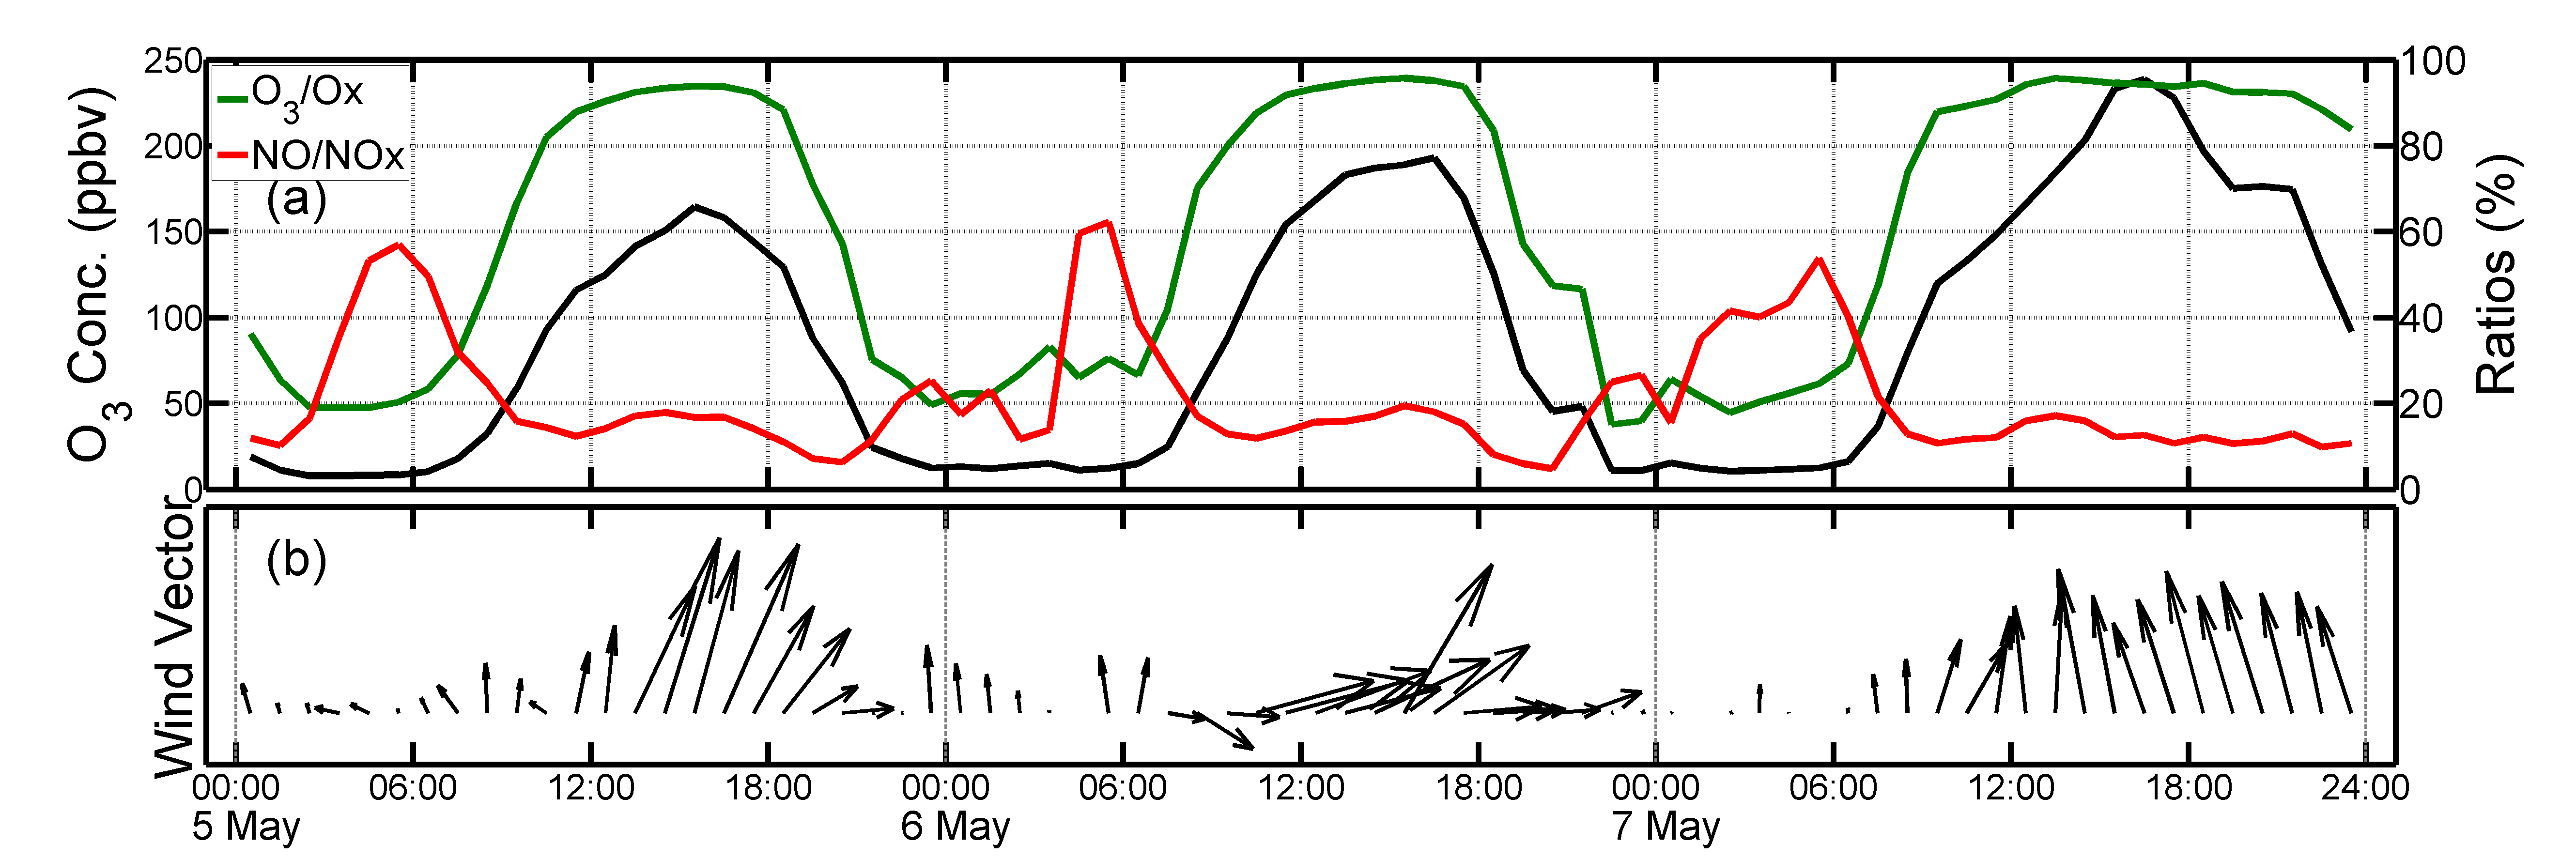 | Figure 4 (a) Hourly averages of O3 concentrations (black), O3/O x ratios (green), and NO/NO x ratios (red) for a high O3 episode during 5 and 7 May 2013; and (b) hourly average wind vector. |
Since the total oxidant O x is more conservative for analyzing regional transport compared to O3, a further investigation of O x and winds was performed. A clear dependence of O x concentrations on wind speed and wind direction is shown in Fig. 3b. High concentrations of O x were mainly observed under west-south wind directions, especially from the south-southwest-southwest sector. The polluted air mass could thereby be brought from the hinterland of the NCP region in the southwest direction, where a cluster of cities and towns are located. Under southwesterly winds, consecutive O x pollution events could sometimes last for several days. Analysis of the high O x events (defined here as daily maximum hourly average O x concentrations exceeding 120 ppbv and lasting for more than three hours) showed that O3 contributed 86%-92% to the observed O x concentrations for ten events during May and July, and 75% for one event in September. The NO/NO2 ratios during these pollution events were exclusively less than 0.2, suggesting that the air mass was aged and transported from the source areas of the pollutants ( Chaloulakou et al., 2008). In contrast, it was relatively quite clean when winds came from the north-east direction. In general, surface O x concentrations rose with increased wind speed, indicating the influence of pollution transport.
Increased surface SO2 concentrations were observed from September to November, probably as a result of enhanced emissions and slowed removal processes. The maximum SO2 hourly averages were about 35, 42, and 50 ppbv in September, October, and November, respectively. The average diurnal cycle of SO2 concentrations exhibited a pronounced peak of about 10 ppbv around noon (Fig. 2d). A daytime peak of SO2 concentrations has previously been observed at a few sites in the NCP ( Lin et al., 2012). The diurnal pattern of a single peak appearing at midday instead of double peaks during the morning and evening rush hours could be attributed to the advection transport of an SO2-rich air mass due to a change in wind direction (e.g., Lin et al., 2008, 2009) or the downward mixing from an SO2-rich layer above (e.g., Meng et al., 2008; Chen et al., 2009). The daytime peak of SO2 concentrations observed in Xianghe was usually associated with low winds (Fig. 3c). The buildup and drop of the SO2 daytime peak generally followed the development of the planetary boundary layer during the day, suggesting that the process of downward mixing might be the major contributor to the daytime peak. During the non-heating period, night-time SO2 concentrations were, on average, below 5 ppbv and showed a strong increase in night-time SO2 concentrations with increased wind speed under easterly winds (Fig. 3d). During the heating period, high concentrations of SO2could continue from midday to the early morning on the next day, with night-time concentrations close to 10 ppbv. In addition, a second peak, comparable with or even higher than the daytime peak, sometimes occurred around midnight. The SO2-polluted air mass from the southwest and northeast wind sector (Fig. 3e) were thought to be mainly responsible for the observed night-time high concentrations and implied possible emission sources in those directions after the heating began. The influence of transported SO2 from emission sources on SO2 concentrations in the heating month of November was also supported by a large variability in SO2 concentrations throughout the day. Moreover, the daytime peak was found to be less frequent in November than in the other two months, with a few double-peak diurnal patterns.
Measurements and analysis of surface O3, NO x, and SO2 were carried out from May to November 2013 at a rural site, Xianghe, between the twin megacities of Beijing and Tianjin in the polluted NCP region. During the observational period, NO x concentrations ranged from several ppbv to nearly 180 ppbv in the summer and over 400 ppbv in the fall. High NO x concentrations mostly occurred under calm conditions, revealing local emissions to be dominant in Xianghe. High ozone episodes were found to be more notable compared with the situation eight years ago, with the highest hourly average close to 240 ppbv in May. The dependence of O x concentrations on winds suggested regional pollution in the NCP. O x concentrations rose with increased wind speed and exhibited high levels mainly in the south-west wind sector, which could bring a polluted air mass from the city cluster in the hinterland of the NCP region in the southwest direction. An average SO2diurnal cycle of a pronounced peak around midday instead of double peaks during the morning and evening rush hours was noted and mainly attributed to the downward mixing from an SO2-rich layer above. A second peak occurred around midnight after the heating began. Emission sources that had an impact on observed night-time high concentrations also differed between the non-heating and the heating months.
| 1 |
|
| 2 |
|
| 3 |
|
| 4 |
|
| 5 |
|
| 6 |
|
| 7 |
|
| 8 |
|
| 9 |
|
| 10 |
|
| 11 |
|
| 12 |
|
| 13 |
|
| 14 |
|
| 15 |
|
| 16 |
|
| 17 |
|
| 18 |
|
| 19 |
|
| 20 |
|
| 21 |
|
| 22 |
|
| 23 |
|
| 24 |
|
| 25 |
|
| 26 |
|