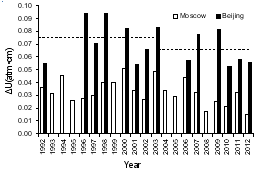
Variation Trend and Characteristics of Anthropogenic CO Column Content in the Atmosphere over Beijing and Moscow
WANG Pu-Cai1 , Georgy S. GOLITSYN2 , WANG Geng-Chen1  , Evgeny I. GRECHKO
2 , Vadim S. RAKITIN2 , Ekaterina V. FOKEEVA2 , Anatoly V. DZHOLA2
, Evgeny I. GRECHKO