The Soil Moisture and Net Primary Production Affected by CO2 and Climate Change Using a Coupled Model
Cite this Article
PENG Jing, DAN Li. The Soil Moisture and Net Primary Production Affected by CO2 and Climate Change Using a Coupled Model . Atmospheric and Oceanic Science Letters, 2014, 7(4): 269-274 
Permissions
Copyright?2014, Editorial office of Atmospheric and Oceanic Science Letters
This is an Open Access article under the terms of CCAL.
The Soil Moisture and Net Primary Production Affected by CO2 and Climate Change Using a Coupled Model
*Corresponding author: DAN Li, danli@tea.ac.cn
Citation: Peng, J., and L. Dan, 2014: The soil moisture and net primary production affected by CO2 and climate change using a coupled model, Atmos. Oceanic Sci. Lett., 7, 269-274
Abstract
In this paper, a coupled model was used to estimate the responses of soil moisture and net primary production of vegetation (NPP) to increasing atmospheric CO2 concentration and climate change. The analysis uses three experiments simulated by the second-generation Earth System Model (CanESM2) of the Canadian Centre for Climate Modelling and Analysis (CCCma), which are part of the phase 5 of the Coupled Model Intercomparison Project (CMIP5). The authors focus on the magnitude and evolution of responses in soil moisture and NPP using simulations modeled by CanESM, in which the individual effects of increasing CO2 concentration and climate change and their combined effect are separately accounted for. When considering only the single effect of climate change, the soil moisture and NPP have a linear trend of 0.03 kg m-2 yr-1 and -0.14 gC m-2 yr-2, respectively. However, such a reduction in the global NPP results from the decrease of NPP at lower latitudes and in the Southern Hemisphere, although increased NPP has been shown in high northern latitudes. The largest negative trend is located in the Amazon basin at -1.79 gC m-2 yr-2. For the individual effect of increasing CO2 concentration, both soil moisture and NPP show increases, with an elevated linear trend of 0.02 kg m-2yr-1 and 0.84 gC m-2 yr-2, respectively. Most regions show an increasing NPP, except Alaska. For the combined effect of increasing atmospheric CO2 and climate change, the increased soil moisture and NPP exhibit a linear trend of 0.04 kg m-2 yr-1 and 0.83 gC m-2 yr-2 at a global scale. In the Amazon basin, the higher reduction in soil moisture is illustrated by the model, with a linear trend of -0.39 kg m-2 yr-1, for the combined effect. Such a change in soil moisture is caused by a weakened Walker circulation simulated by this coupled model, compared with the single effect of increasing CO2 concentration (experiment M2), and a consequence of the reduction in NPP is also shown in this area, with a linear trend of -0.16 gC m-2 yr-2.
Keyword:
increasing atmospheric CO2; climate change; soil moisture; net primary production; coupled model
1 Introduction
The increase in atmospheric carbon dioxide (CO2) has been accompanied by the stimulation of photosynthesis, and the consequences of this on productivity have been illustrated ( Reddy et al., 2010; Smith and Dukes, 2013). Such a stimulation gives an increase in net primary production (NPP) per 100 ppmv of CO2 of about 16% (5%-20%) higher than that simulated by models ( Piao et al ., 2013). Specifically, the elevated CO2 can enhance vegetation productivity, leading to higher litterfall on the soil and increased underground productivity for roots ( Drake et al., 2011). Consequently, the soil carbon is elevated, which can enhance the soil respiration. On the other hand, it has been found that increases in atmospheric CO2 decrease the leaf stomatal conductance, leading to a reduction in transpiration ( Lammertsma et al., 2011; Steinthorsdottir et al., 2012). Thus, these reductions can contribute to an increase in continental scale run-off and in turn affect soil moisture availability. Gedney et al. (2006) suggested that, during the 20th century, continental runoff has increased because of a transpiration reduction due to CO2-induced stomatal closure.
During the past decades, the dramatically increasing temperature has been accompanied by changes in precipitation; the amount, intensity, frequency, and type have all been affected. It has been found that, from 1987 to 2006, the observed global precipitation increased by about 13 mm yr-1 (10 yr)-1 ( Liepert and Previdi, 2009). From 1982 to 2009, global land evapotranspiration (ET) was found to have increased at a rate of 1.10 mm yr-2, with the Amazon regions and Southeast Asia showing the strongest increasing trend ( Zeng et al., 2012). During 1957-2008, the positive trend of runoff in Greenland followed atmospheric warming by 2.6 ± 0.5 Gt yr-2 ( Ettema et al., 2009). Using a soil moisture-based drought index across the globe, Sheffield and Wood (2008) suggested that there is evidence of changes in the spatial distribution of drought, with a global decreasing trend of between -0.021% and -0.035% yr-1.
NPP, the primary driver of global carbon cycling, has also been strongly influenced by climatic variables ( Xu et al., 2013). Temperature and precipitation affect vegetation photosynthesis, function, and structure, so they can also make a direct contribution to land-atmosphere carbon exchanges and carbon fluxes ( Luo et al., 2008; Girardin et al., 2010; Liu et al., 2013). From 1980 to 2002, NPP increased globally, with an increase trend of 0.07 PgC yr-1 in response to changes in precipitation; while in response to increasing temperature, there has been a decrease in NPP of -0.02 PgC yr-1( Piao et al., 2009). Besides temperature and precipitation, soil moisture is another important limiting factor for the changes in carbon fluxes across terrestrial ecosystems ( Falloon et al., 2011). It has also been suggested that soil moisture is a limiting factor controlling NPP ( Tiemann and Billings, 2011). Based on multiple regression analysis, variations of ecosystem productivity, including above-and below-ground wood production (ANPP, BNPP) and NPP, are dominantly regulated by soil moisture across the years (the level of significance test P < 0.001) ( Xu et al., 2013). A strong soil moisture deficit over the Southern Hemisphere has led to a global terrestrial NPP reduction during 2000-2009 ( Zhao and Running, 2010). Qian et al. (2010) suggested that soil moisture plays an important role for constraining rates of decomposition and soil respiration, as soil moisture is a limiting factor controlling both NPP and the microbial processing of large pools of soil organic matter ( Tiemann and Billings, 2011).
During the past two decades, there has been agreement that variations in NPP have been due to dramatically rising atmospheric CO2 concentration and temperature ( Hemming et al., 2013; Reyer et al., 2013; Piao et al., 2013). However, there is still large uncertainty about the variations of NPP in the magnitude and spatial pattern of responses to climate change and increasing atmospheric CO2 concentration ( Friedlingstein et al., 2006; Huntingford et al., 2009). Simulated results have suggested that the magnitude of the response of NPP varies markedly among models ( Friedlingstein et al., 2006). One of the uncertainties is thought to be derived from uncertainty in the relationship between soil moisture and NPP ( Friedlingstein et al., 2006; Zhao and Running, 2010; Falloon et al., 2011). As a result, in typical regions, the relative role of soil moisture on NPP at a regional scale has been evaluated. In this study, we investigated the evolution of the soil moisture and NPP under atmospheric CO2 concentration and climate change using a fully coupled carbon cycle-climate model from phase 5 of the Coupled Model Intercomparison Project (CMIP5).
2 Data and method
In this analysis, a coupled model was used from CMIP5 (http://cmip100pcmdi.llnl.gov/cmip5/forcing.html); namely, the second-generation Earth System Model (CanESM2) of the Canadian Centre for Climate Modelling and Analysis (CCCma) ( Taylor et al., 2012), which includes the carbon cycle component being developed by the CCCma. Its land component, the Canadian Terrestrial Ecosystem Model (CTEM), has been coupled into CanESM and used to calculate the land-atmosphere exchange of CO2 in terrestrial ecosystem processes ( Arora et al., 2009). The simulated results of CTEM have been evaluated at the global scale ( Arora et al., 2009). It includes three live vegetation pools (leaves, stem, and root) and two dead carbon pools (litter and soil organic carbon) described by Christian et al. (2010). It describes vegetation as plant functional types (PFTs) including needleleaf evergreen, needleleaf deciduous, broadleaf evergreen, broadleaf cold deciduous, broadleaf dry deciduous, C3 crop, C4 crop, C3 grass, and C3 grass ( Lawrence et al., 2012). For each PFT, Lawrence et al. (2012) reported that variables are separately computed for the canopy, near-surface, and leaf surface. On account of the vapor pressure deficit, the photosynthesis in CTEM uses a single-leaf approach, which links photosynthesis and canopy conductance ( Christian et al., 2010).
In order to isolate feedbacks, additional radiatively and biogeochemically-coupled versions of "1% increasing CO2" experiments were performed. Peng et al. (2013a, b) described the details of three experiments: the combined effect of CO2-radiative forcing and CO2-biogeochemical forcing on the evolution of soil moisture and NPP (experiment M1); considering only the effect of CO2-biogeo-chemical forcing without the effect of CO2-radiative forcing contribution (experiment M2); and considering only the effect of CO2-radiative forcing without introducing the effect of CO2-biogeochemical forcing (experiment M3). In the radiatively-coupled simulation (experiment M3) CO2 radiation was calculated by increasing atmospheric CO2 concentration with an increased rate of 1% per year, while the biogeochemistry was fixed to the pre- industrial CO2 level. The coupled radiation in this simulation means that only the effect of increasing atmospheric CO2 on the climate but not the biogeochemistry was considered ( Arora et al., 2013). In experiment M2, the increasing CO2 concentration influenced the biogeochemistry but not the climate, which only responds to the pre-indu-strial value of atmospheric CO2 concentration.
3 Results
Figures 1 and 2 show that warming and the increasing atmospheric CO2 concentration have triggered significant changes in terrestrial soil moisture. In experiment M3 (the single effect of climate change), the averaged global soil moisture showed a significantly increased trend with a rate of 0.03 kg m-2 yr-1 ( P < 0.05). In eastern Asia, the increase was at a higher rate of 0.07 kg m-2 yr-1. The largest increased trends were located in western North America, eastern Africa, central North America, and southeastern Asia (over 0.16 kg m-2 yr-1). In contrast, the Amazon basin and Central America experienced the strongest decreases of -0.15 and -0.28 kg m-2 yr-1 ( P < 0.05). When considering only the single atmospheric increasing CO2 effect, the coupled model simulation also showed a general increased trend by 0.02 kg m-2 yr-1 at the global scale. The positive response to increasing CO2 was more sensitive than its response to global warming. The strongest decrease also appeared in the Amazon basin with a linear trend of -0.27 kg m-2 yr-1. Central America and the Tibetan Plateau also showed a negative trend. The largest increases were found in northern Europe, eastern North America, central North America, western Africa, and southeastern Asia, with linear trends of over 0.14 kg m-2 yr-1. In eastern Asia, the model simulated an increased soil moisture of 0.02 kg m-2 yr-1( P < 0.05) alongside the increasing CO2. For experiment M1 (the combined effect of both atmospheric increasing CO2 and climate change), it was shown that the soil moisture of all terrestrial ecosystems consistently increased by 0.04 kg m-2 yr-1. Across the globe, such an increase seems to be primarily attributed to an increase in precipitation with a rate of 51.9 mm yr-1 (figures not shown here). We note that the increase caused by the combined effect is not equal to the sum of increases caused by the single effect of increasing CO2 concentration and the single effect of climate change. In this analysis, each experiment was carried out separately by CanESM2. These differ from the experiments reported by Friedlingstein et al. (2006). In their paper, two experiments were produced: one in which both climate change and increasing CO2 concentration effects were considered, and the other in which the single effect of increasing CO2 concentration only was considered. Thus, the difference between the two runs was defined as the effect of climate change. However, the difference between the combined effects and the sum of the single effect of climate change and the single effect of rising CO2 concentration seems to partly testify to the nonlinearity among them. The simulation exhibited a significantly increased trend in the high northern latitudes, where it had quadrupled from the pre-industrial atmospheric CO2levels, except for the Amazon basin. However, the largest decreasing trend was also shown in the Amazon basin, with -0.39 kg m-2 yr-1 (95% confidence level using the Student's t-test) for the combined effect of increasing CO2 and climate change.
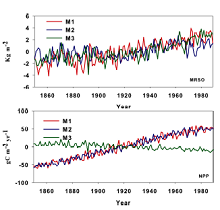
 | Figure 1 Changes in the anomalies of soil moisture (Mrso) and net primary production (NPP) during 1850-1989 responding to the single effect of rising atmospheric CO2 concentration (experiment M2), the single effect of climate change (experiment M3), and their combined effect (experiment M1). |
The simulations predicted that global soil moisture increased from 0.02 to 0.04 kg m-2 yr-1 in all terrestrial ecosystems. Such increases in soil moisture seem to be attributed to the increase in atmospheric CO2 concentration and global warming. Conversely, consistently decreased soil moisture has been modeled in the Amazon basin with significantly negative linear trends of -0.27 to -0.15 kg m-2 yr-1 ( P < 0.05) (Figs. 2 and 3). To better understand such different responses of soil moisture in the Amazon basin, we examined changes in the precipitation and atmospheric circulation separately. Due to the barrier of the Andes Mountains, the moisture input mainly comes from the Atlantic Ocean, which suggested that the Walker circulation is one of the most important drivers through the trade winds pushing the surface seawater to move westward and bring precipitation and moisture for the Amazon basin ( Zeng et al., 1996). Patterns of the trends of vertical wind along the equator show that the trend of the western and upward wind is separately weakened in this region (near 40-80°W) (Figs. 3a and 3b). A weakened Walker circulation is illustrated. As a result, the transport of water vapor from the Atlantic Ocean is suppressed and precipitation is clearly reduced in this region (Figs. 3c-h) and the consequence for decreased soil moisture has also been captured.
During the same period of 1850-1989, the terrestrial ecosystem showed an increase in NPP of 0.84 gC m-2 yr-2, for the single increasing atmospheric CO2 concentration (Figs. 1 and 2) simulated by CanESM. This model simulated an increase in NPP from 0.03 gC m-2 yr-2 in Alaska to 6.8 gC m-2 yr-2 in southeastern Asia in most regions, except Alaska. In the Amazon basin, an increased linear trend was observed with a rate of 2.2 gC m-2 yr-2. For the single effect of climate change, spatial variations were shown, which is consistent with the results of Piao et al. (2009) and Zeng et al. (2004). In the high northern latitudes, increased NPP was presented. In contrast, the decreases of NPP were found mainly in low latitudes and in the Southern Hemisphere. The strongest negative trend of NPP was located in the Amazon basin, with a linear trend of -1.8 gC m-2 yr-2 ( P < 0.05). In western Africa and Southeast Asia, a negative trend was found (< -1.3 gC m-2 yr-2). For the combined effect of increasing atmospheric CO2 concentration and climate change, the model predicted an increase over the whole terrestrial ecosystem, with a linear trend of 0.83 gC m-2 yr-2( P < 0.05). With the exception of the Amazon basin and Central America, simulated NPP was enhanced, with a linear trend of from 0.01 gC m-2 yr-2 in the Sahara to 0.65 gC m-2 yr-2 in southeastern Asia. The most dramatically decreased NPP was located in the Amazon basin, with a markedly negative trend of -0.16 gC m-2 yr-2.
The simulations showed a robust decrease in NPP for the Amazon basin in both experiments M1 and M3. This robust decrease of NPP was primarily driven by the climate change effect, which cannot compensate for the increase of NPP caused by the single effect of increasing atmospheric CO2 concentration. As mentioned in a previous study ( Zeng et al., 1996), Walker circulation is one of the most important paths for transporting moisture from the ocean to the Amazon basin. However, a weakened Walker circulation was observed from considering only the single effect of climate change in this paper. This change can result in a decrease in precipitation and soil moisture with a linear trend of -1.7 mm yr-2 and -0.15 kg m-2 yr-1, respectively. This dramatic decrease in precipitation and soil moisture puts more stress on the water availability and is likely responsible for the reduced vegetation productivity and biomass in this region. Further evidence of the 2003 summer drought demonstrates the negative impact on vegetation NPP. Zhao and Running (2010) suggested that water availability is a key limiting factor controlling vegetation NPP in tropical forests. It has also been shown that current soil moisture change and drought are also important factors responsible for changing vegetation productivity ( Reichstein et al., 2003; Metcalfe et al.,2010; Berdanier and Klein, 2011). In this region, the decrease in soil moisture during the 2005 drought directly generated a dramatic decrease in NPP ( Zhao and Running, 2010). The 2010 Amazon drought also showed how soil moisture deficit caused a decline in NPP ( Potter et al., 2011), because the enhanced soil moisture deficit reduced vegetation growth and productivity ( da Costa et al., 2013).
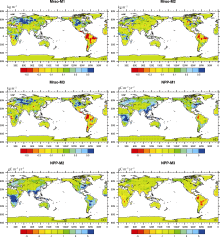
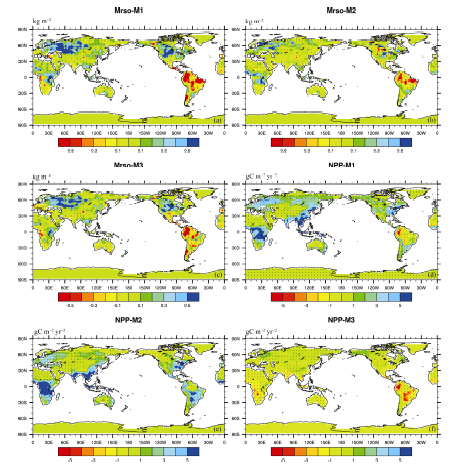 | Figure 2 (a-c) Spatial distribution of the trend in Mrso and (d-f) NPP responding to the single effect of rising atmospheric CO2 concentration (experiment M2), the single effect of climate change (experiment M3), and their combined effect (experiment M1). Dotted areas are regions where changes are statistically at the 95% confidence level using the Student's t-test (units: kg m-2 yr-1for Mrso and gC m-2 yr-2for NPP). |
4 Conclusion
This study used a fully coupled model to estimate the response of soil moisture and NPP to the single effect of increasing atmospheric CO2 concentration and climate change, respectively. The results showed divergences of responses of the two variables. Both rising atmospheric CO2 concentration and climate change contribute to the
enhanced soil moisture and NPP, with a linear trend of 0.04 kg m-2 yr-1 and 0.83 gC m-2 yr-2, respectively. While only responding to the single effect of elevating atmospheric CO2 concentration, both soil moisture and NPP consistently show upward trends at the global scale, whereas the simulation illustrates that an increase in soil moisture and reduction in NPP are conversely presented due to the single effect of climate change. Such a decrease of NPP in the total terrestrial ecosystem can be attributed to the reduction in low latitudes and in the Southern Hemisphere. The strongest negative trend was in the Amazon basin, with a linear trend of -1.8 gC m-2 yr-2 ( P < 0.05) caused by the single effect of climate change. In this region, such a response of NPP could be derived from the weakened Walker circulation, which can lead to a reduction in precipitation and soil moisture. To more accurately estimate and compare the effects of the rising atmospheric CO2 concentration and climate change, it is necessary to use multimodel simulations in the future.
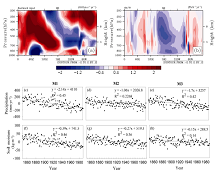
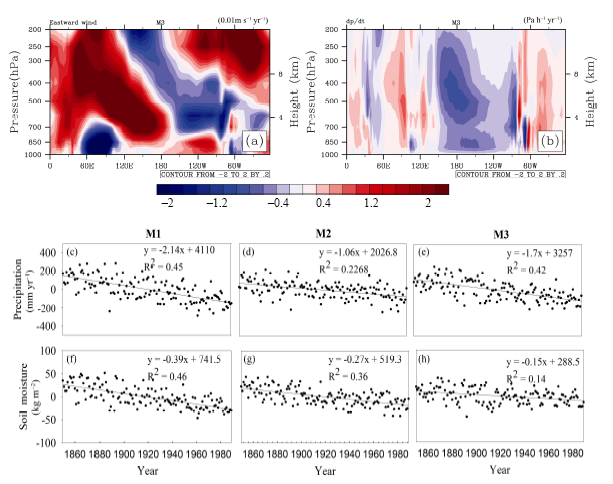 | Figure 3 The modeled trend along the equator: (a) eastward wind (units: m s-1yr-1); (b) vertical wind (units: Pa h-1 yr-1), considering only the single effect of climate change (experiment M3); changes in the anomalies of ((c)-(e)) precipitation and ((f)-(h)) soil moisture in the Amazon basin responding to the single effect of rising atmospheric CO2 concentration (experiment M2), the single effect of climate change (experiment M3), and their combined effect (experiment M1) during 1850-1989 (units: mm yr-1 and gC m-2 yr-1, respectively). |
Acknowledgements. This study was supported by the project of the National Natural Science Foundation of China (Grant Nos. 41275082 and 41305070), the Strategic Priority Research Program of the Chinese Academy of Sciences (Grant No. XDA05110103), and the Knowledge Innovation Program of the Chinese Academy of Sciences (Grant Nos. KZCX2-EW-QN208 and 7-122158).
Reference
| 1 |
|
| 2 |
|
| 3 |
|
| 4 |
|
| 5 |
|
| 6 |
|
| 7 |
|
| 8 |
|
| 9 |
|
| 10 |
|
| 11 |
|
| 12 |
|
| 13 |
|
| 14 |
|
| 15 |
|
| 16 |
|
| 17 |
|
| 18 |
|
| 19 |
|
| 20 |
|
| 21 |
|
| 22 |
|
| 23 |
|
| 24 |
|
| 25 |
|
| 26 |
|
| 27 |
|
| 28 |
|
| 29 |
|
| 30 |
|
| 31 |
|
| 32 |
|
| 33 |
|
| 34 |
|
| 35 |
|
| 36 |
|
| 37 |
|
| 38 |
|