Revisiting Asymmetry for the Decaying Phases of El Niño and La Niña
Revisiting Asymmetry for the Decaying Phases of El Niño and La Niña |
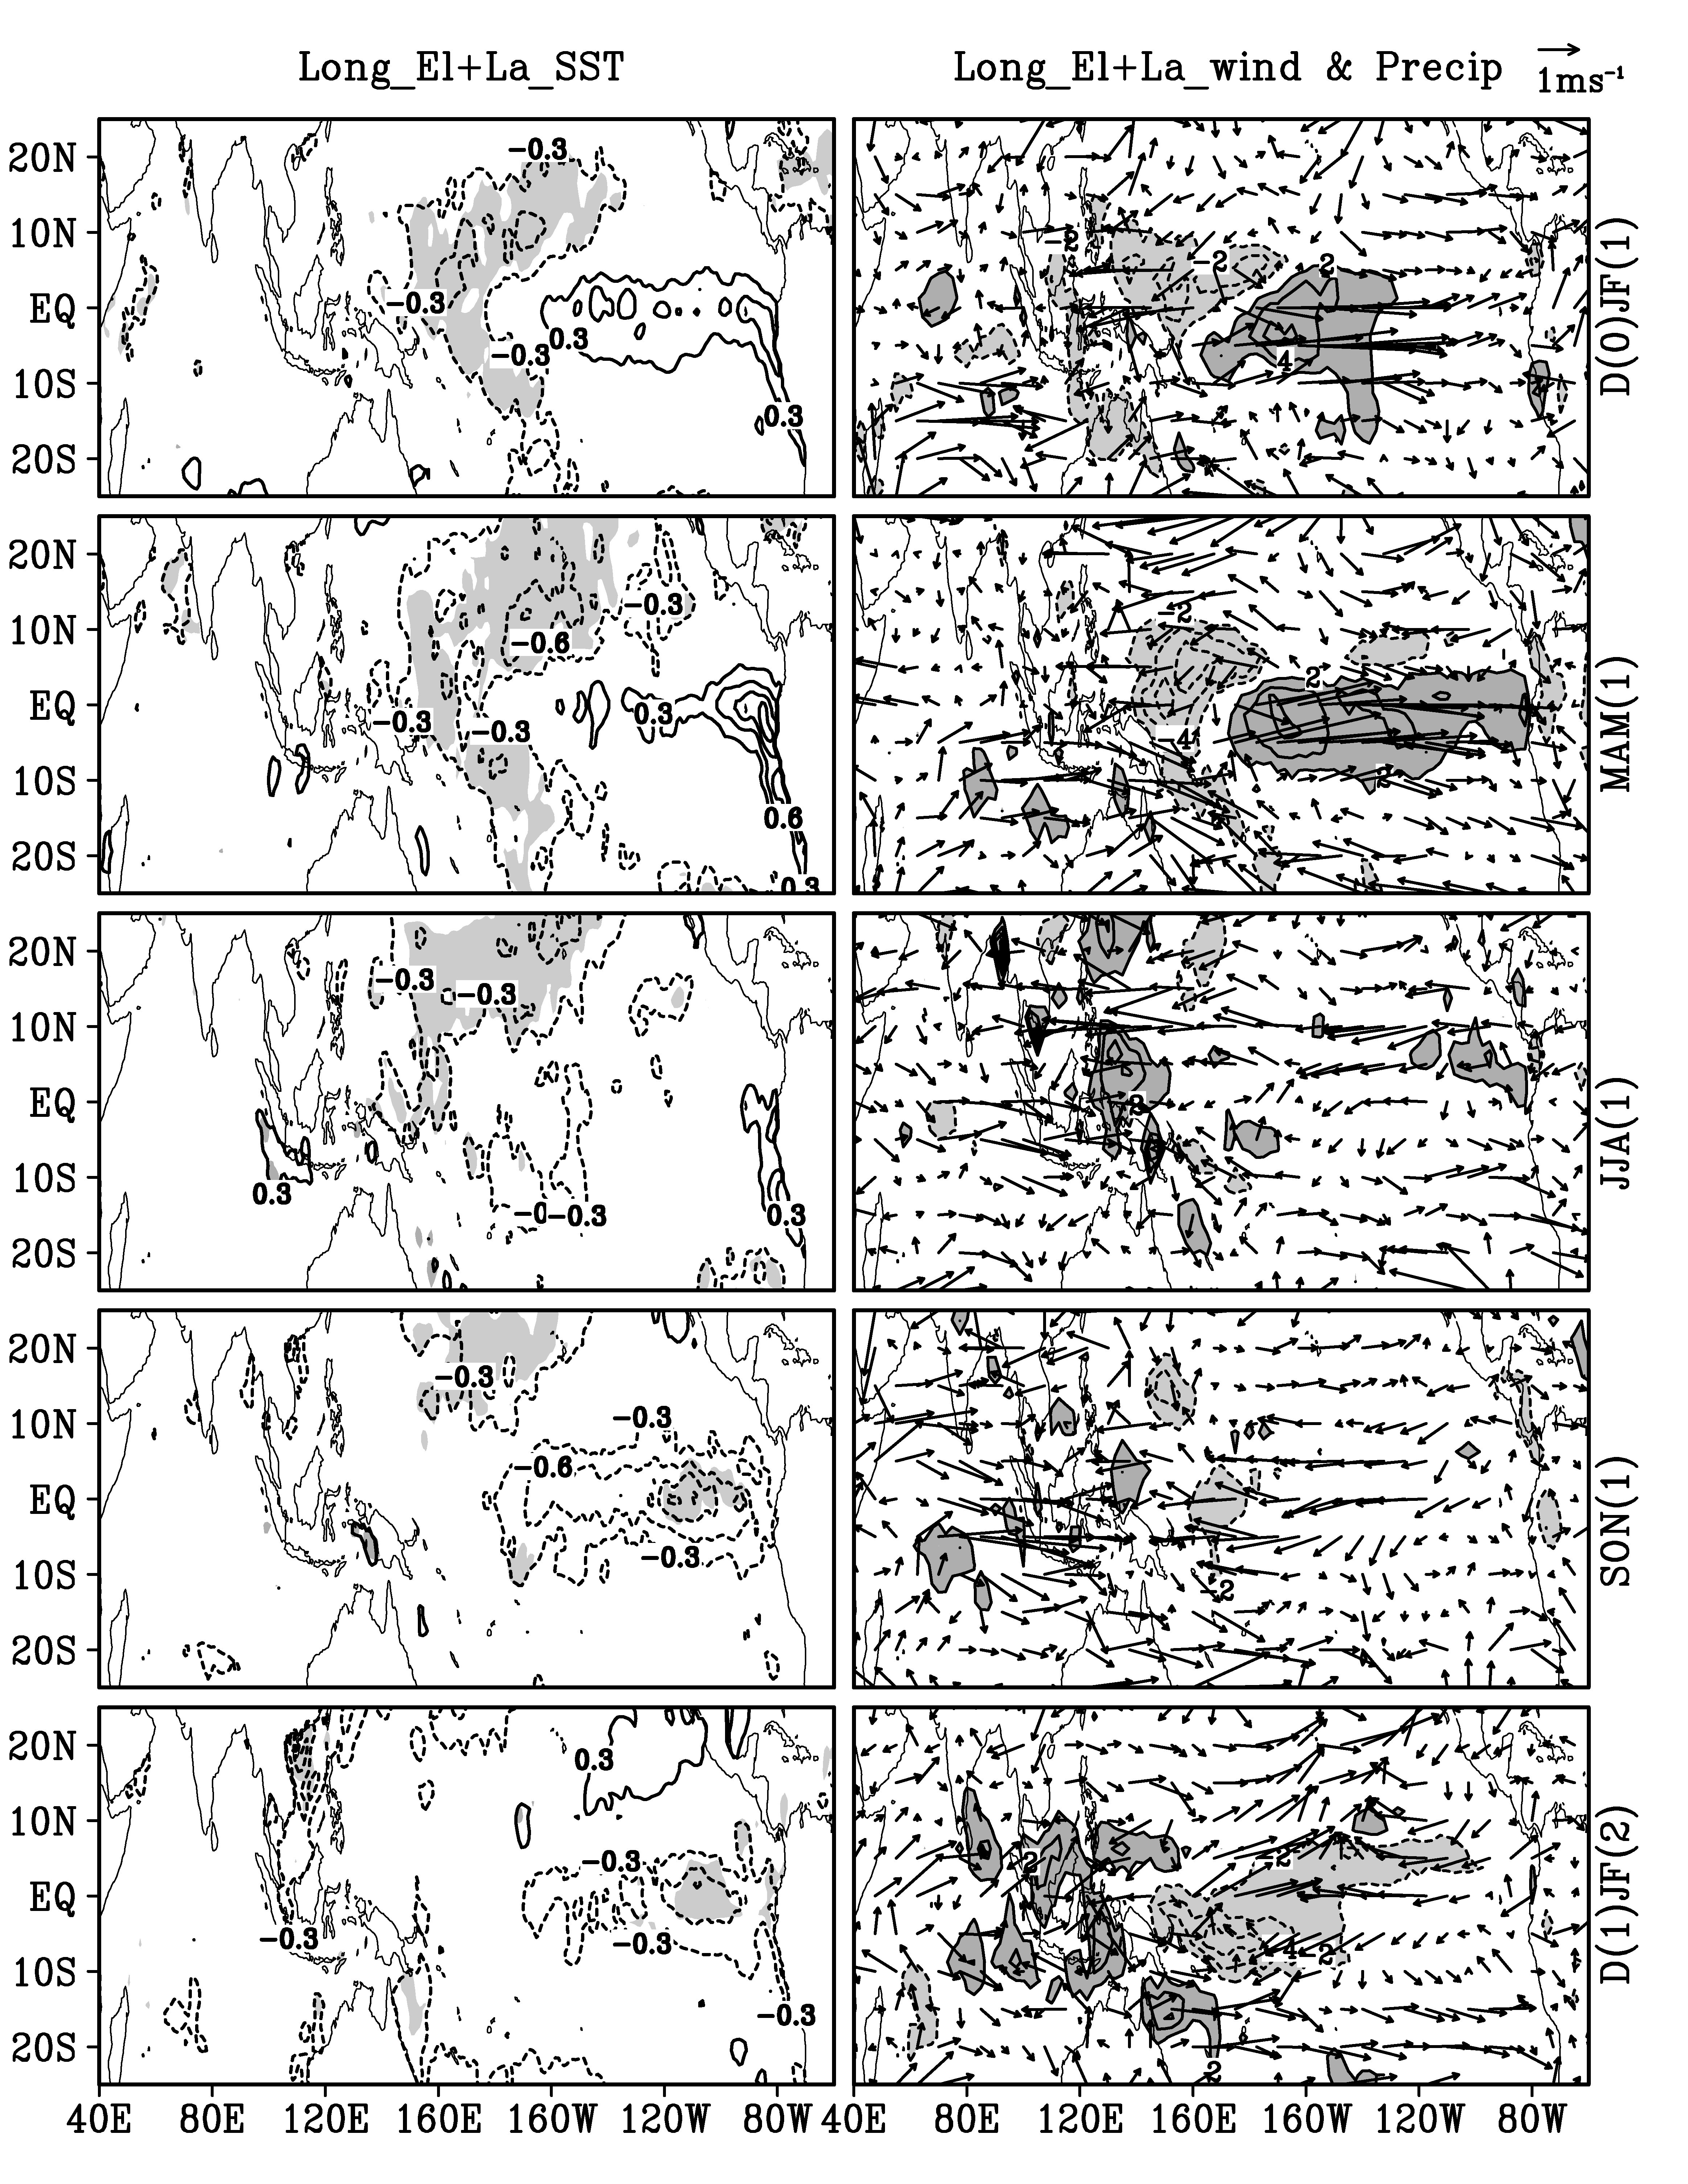
| Figure 4 Spatial distributions for the composite evolution of SST #cod#x000b0;C, left panel, 850-hPa wind m s -1 , vectors in right panel, and precipitation mm d -1 , contour in right panel anomalies for the long decaying cases. Shading in the left panel represents the differences significant at the 95% confidence level according to the t -test. Shading in the right panel represents the composite precipitation anomalies above 2 mm d -1 dark shading or below -2 mm d -1 light shading. |
| |