An Investigation of the Formation of the Heat Wave in Southern China in Summer 2013 and the Relevant Abnormal Subtropical High Activities
An Investigation of the Formation of the Heat Wave in Southern China in Summer 2013 and the Relevant Abnormal Subtropical High Activities |
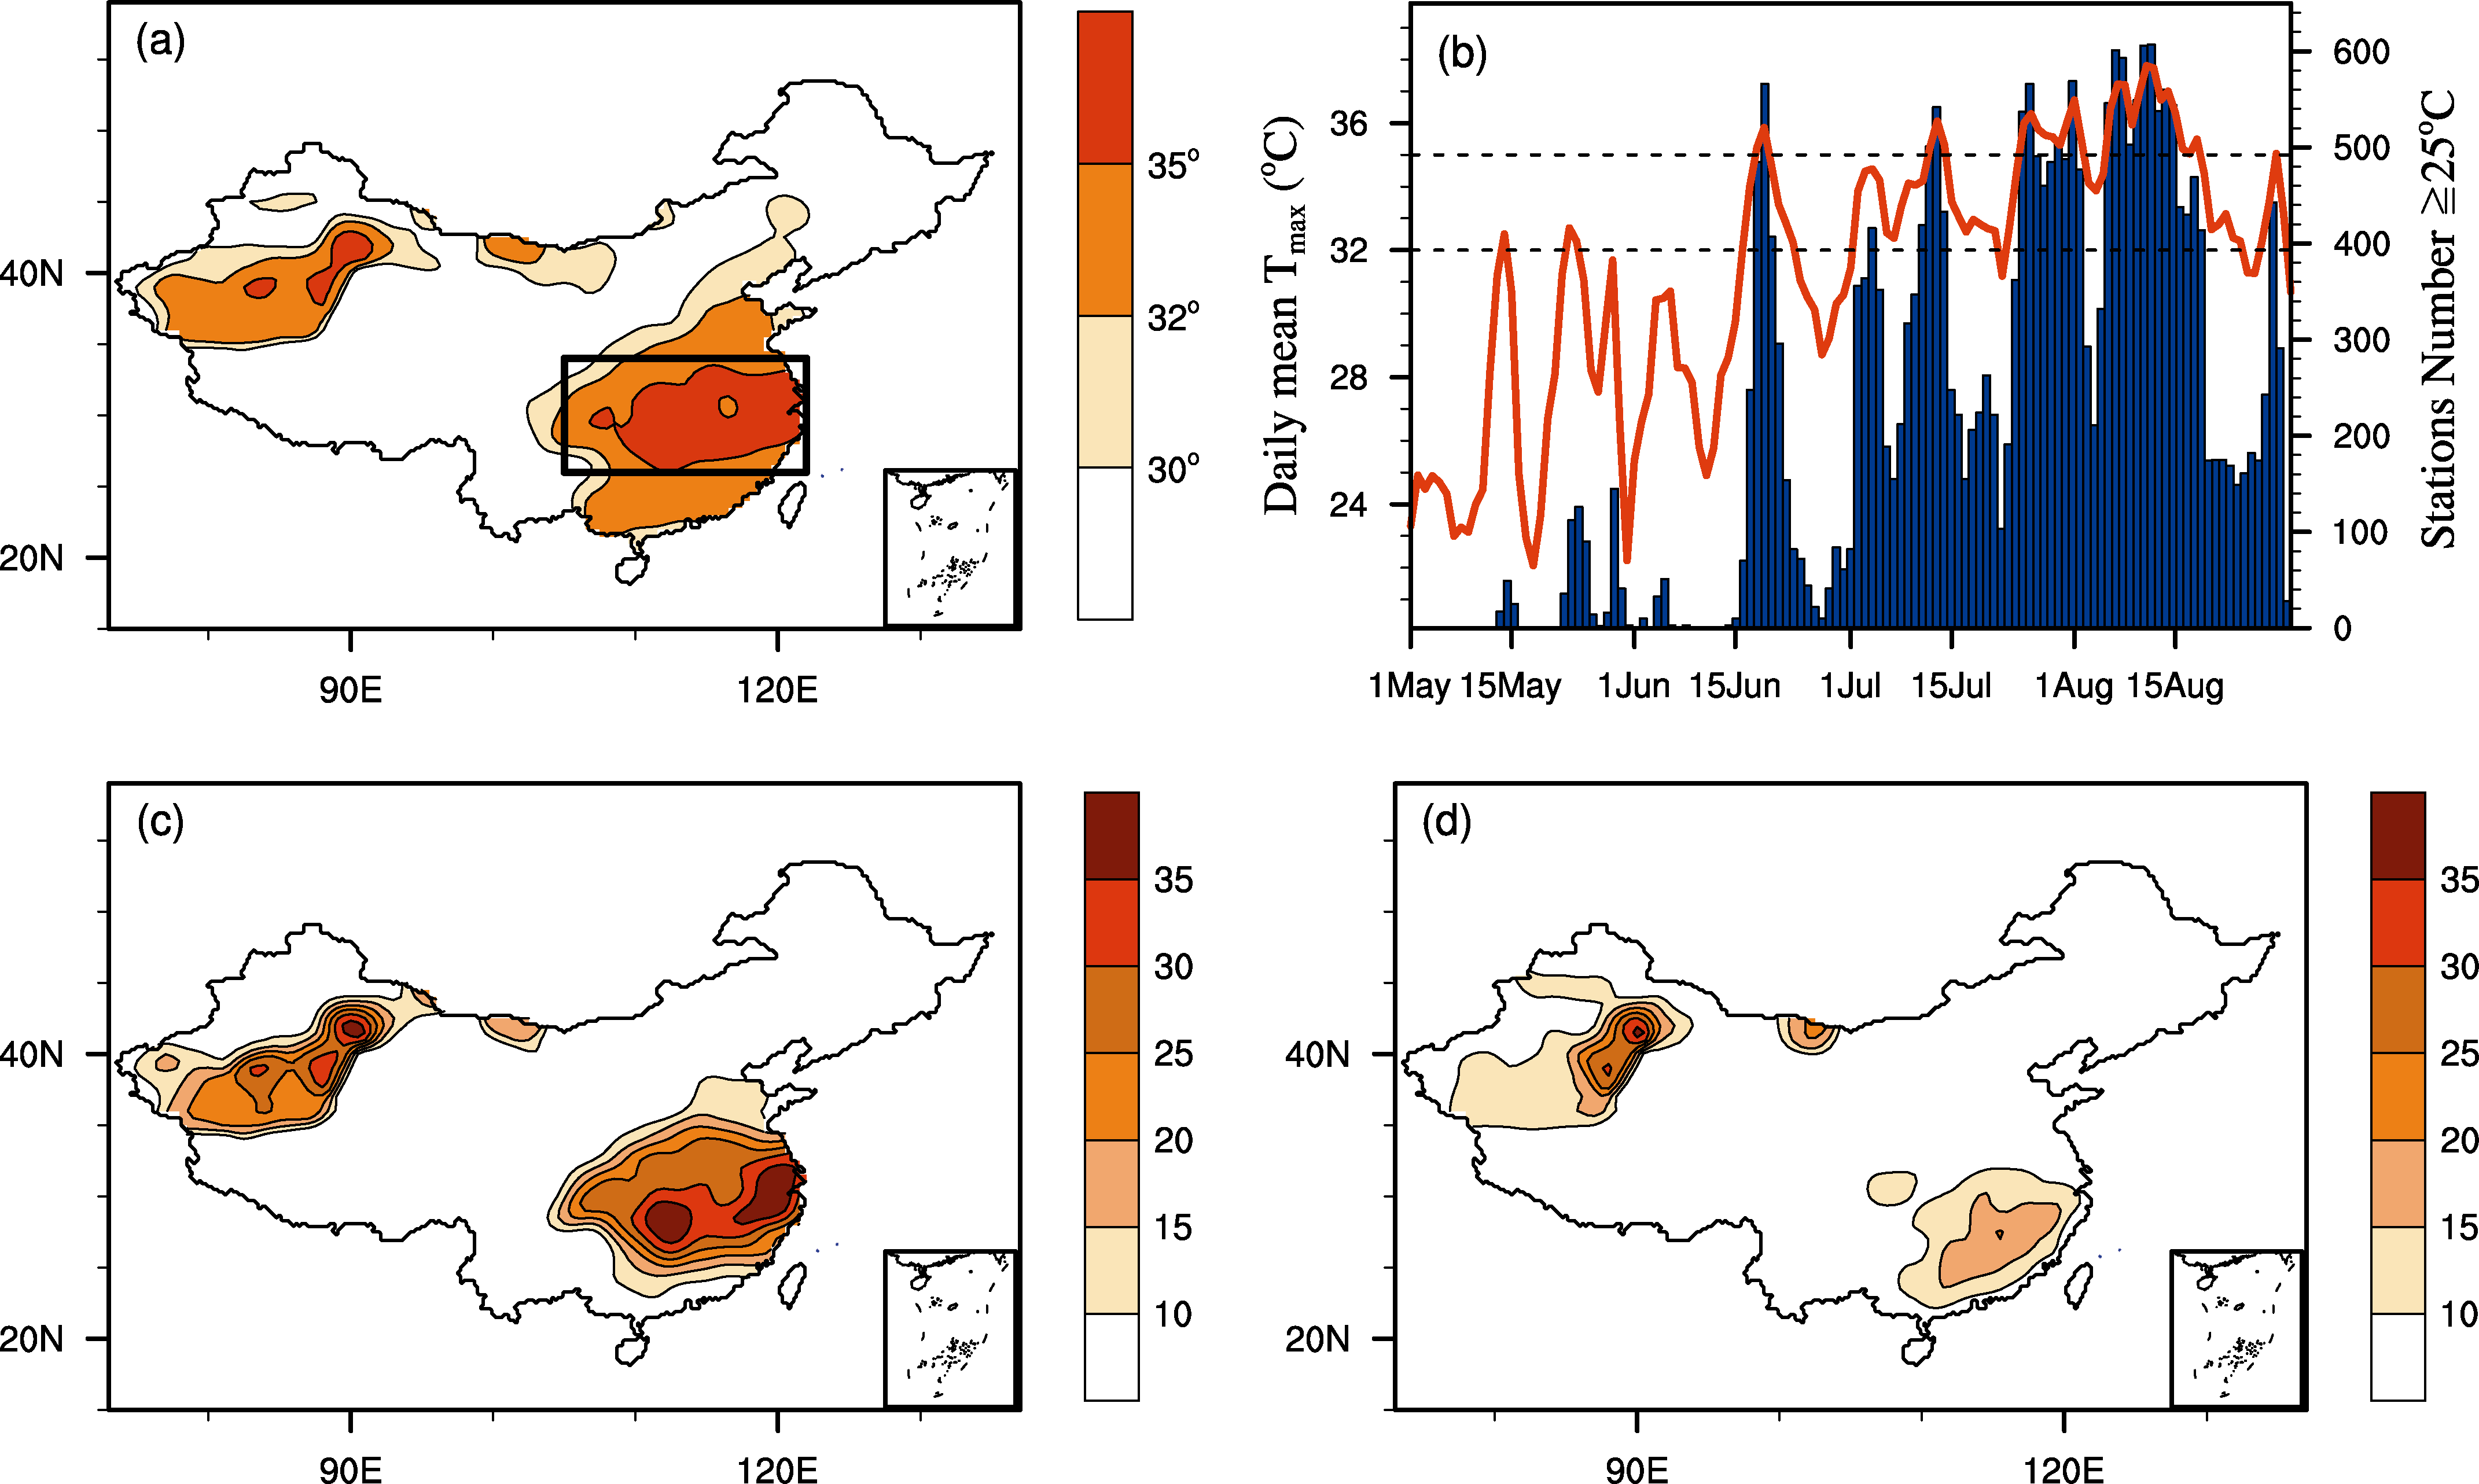
| Figure 1 a Distribution of T max #cod#x000b0;C average for 2 July to 19 August 2013. The thick black outline indicates the Southern Hot Region. b Time series of the daily number of stations with hot weather blue bars and the areal mean daily maximum temperature red line; units: #cod#x000b0;C in the Southern Hot Region. c Distribution of hot days for 2 July to 19 August 2013. d Distribution of the climate mean 1980-2009 hot days T max #cod#x02265; 35#cod#x000b0;C for 2 July to 19 August. |
| |