An Investigation of the Formation of the Heat Wave in Southern China in Summer 2013 and the Relevant Abnormal Subtropical High Activities
An Investigation of the Formation of the Heat Wave in Southern China in Summer 2013 and the Relevant Abnormal Subtropical High Activities |
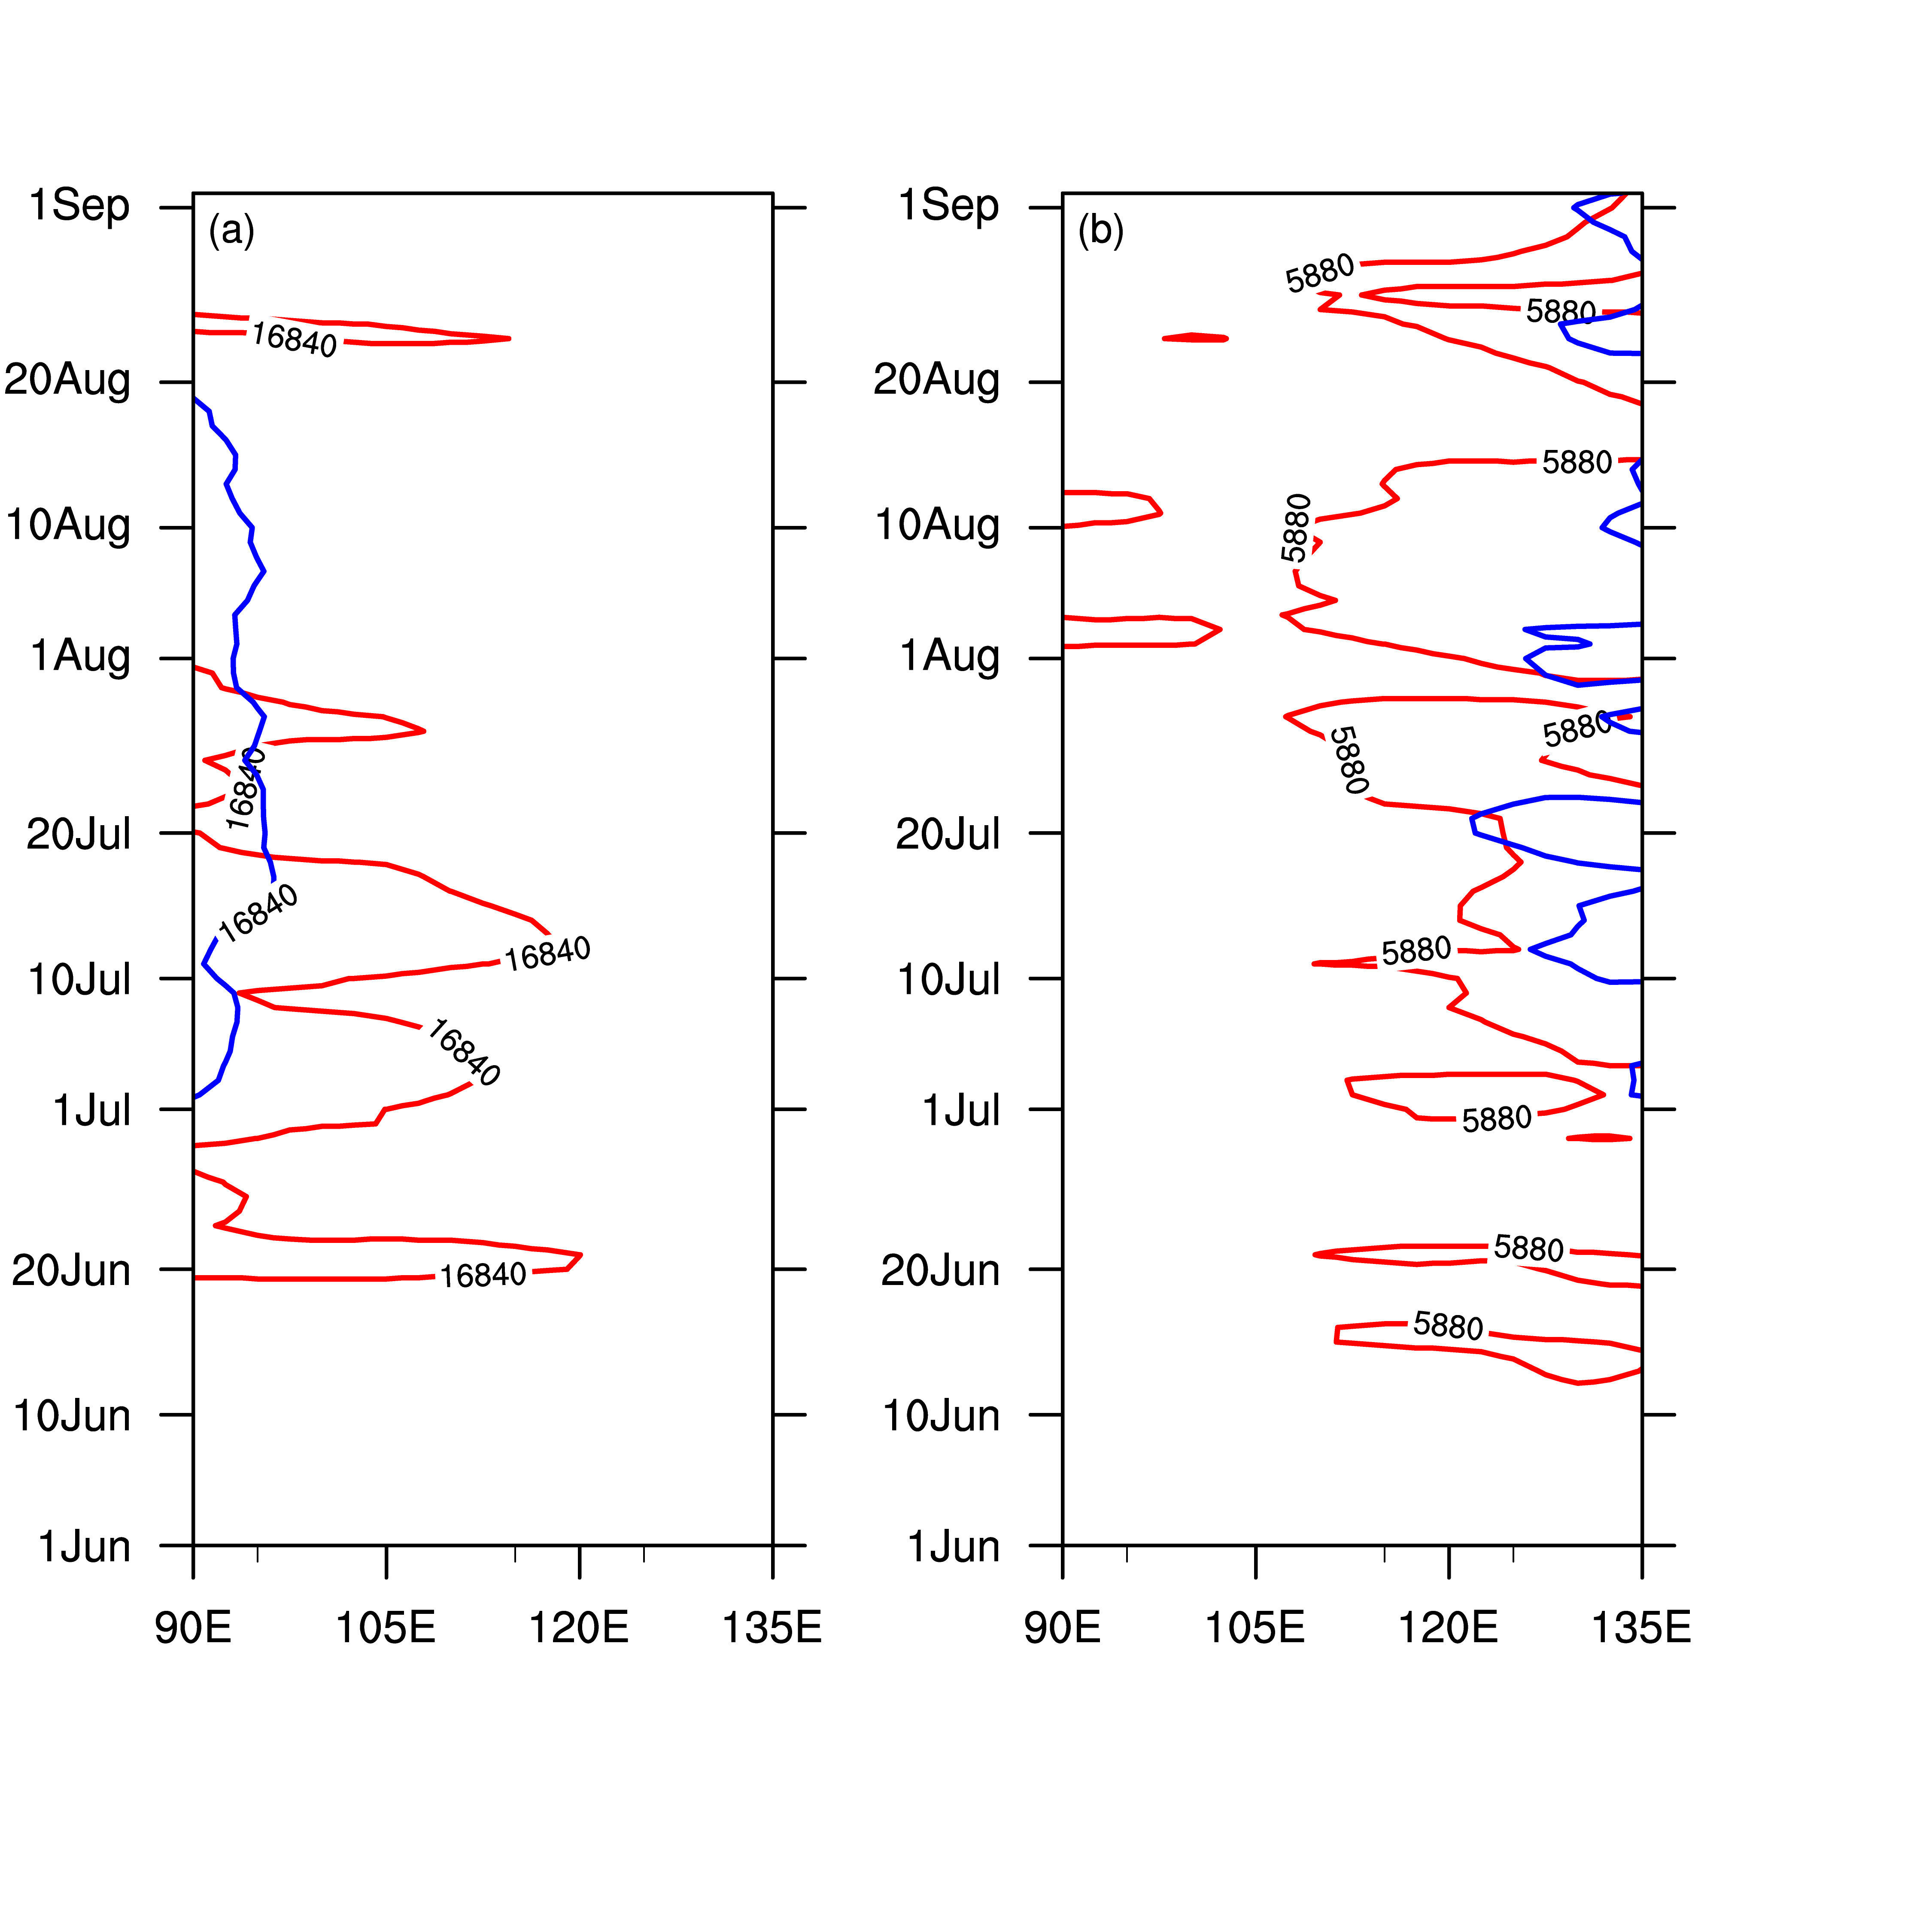
| Figure 3 Time-longitude evolution of 27.5-32.5#cod#x000b0;N mean 5880-gpm and 16840-gpm contours from 1 June to 4 September 2013. Red lines represent the 16840 gpm left and 5880 gpm right contours in 2013 and the blue lines represent the long-term mean. |
| |