Characterization of Stratospheric Aerosol Distributions during the Volcanically Quiescent Period of 1998-2004
Characterization of Stratospheric Aerosol Distributions during the Volcanically Quiescent Period of 1998-2004 |
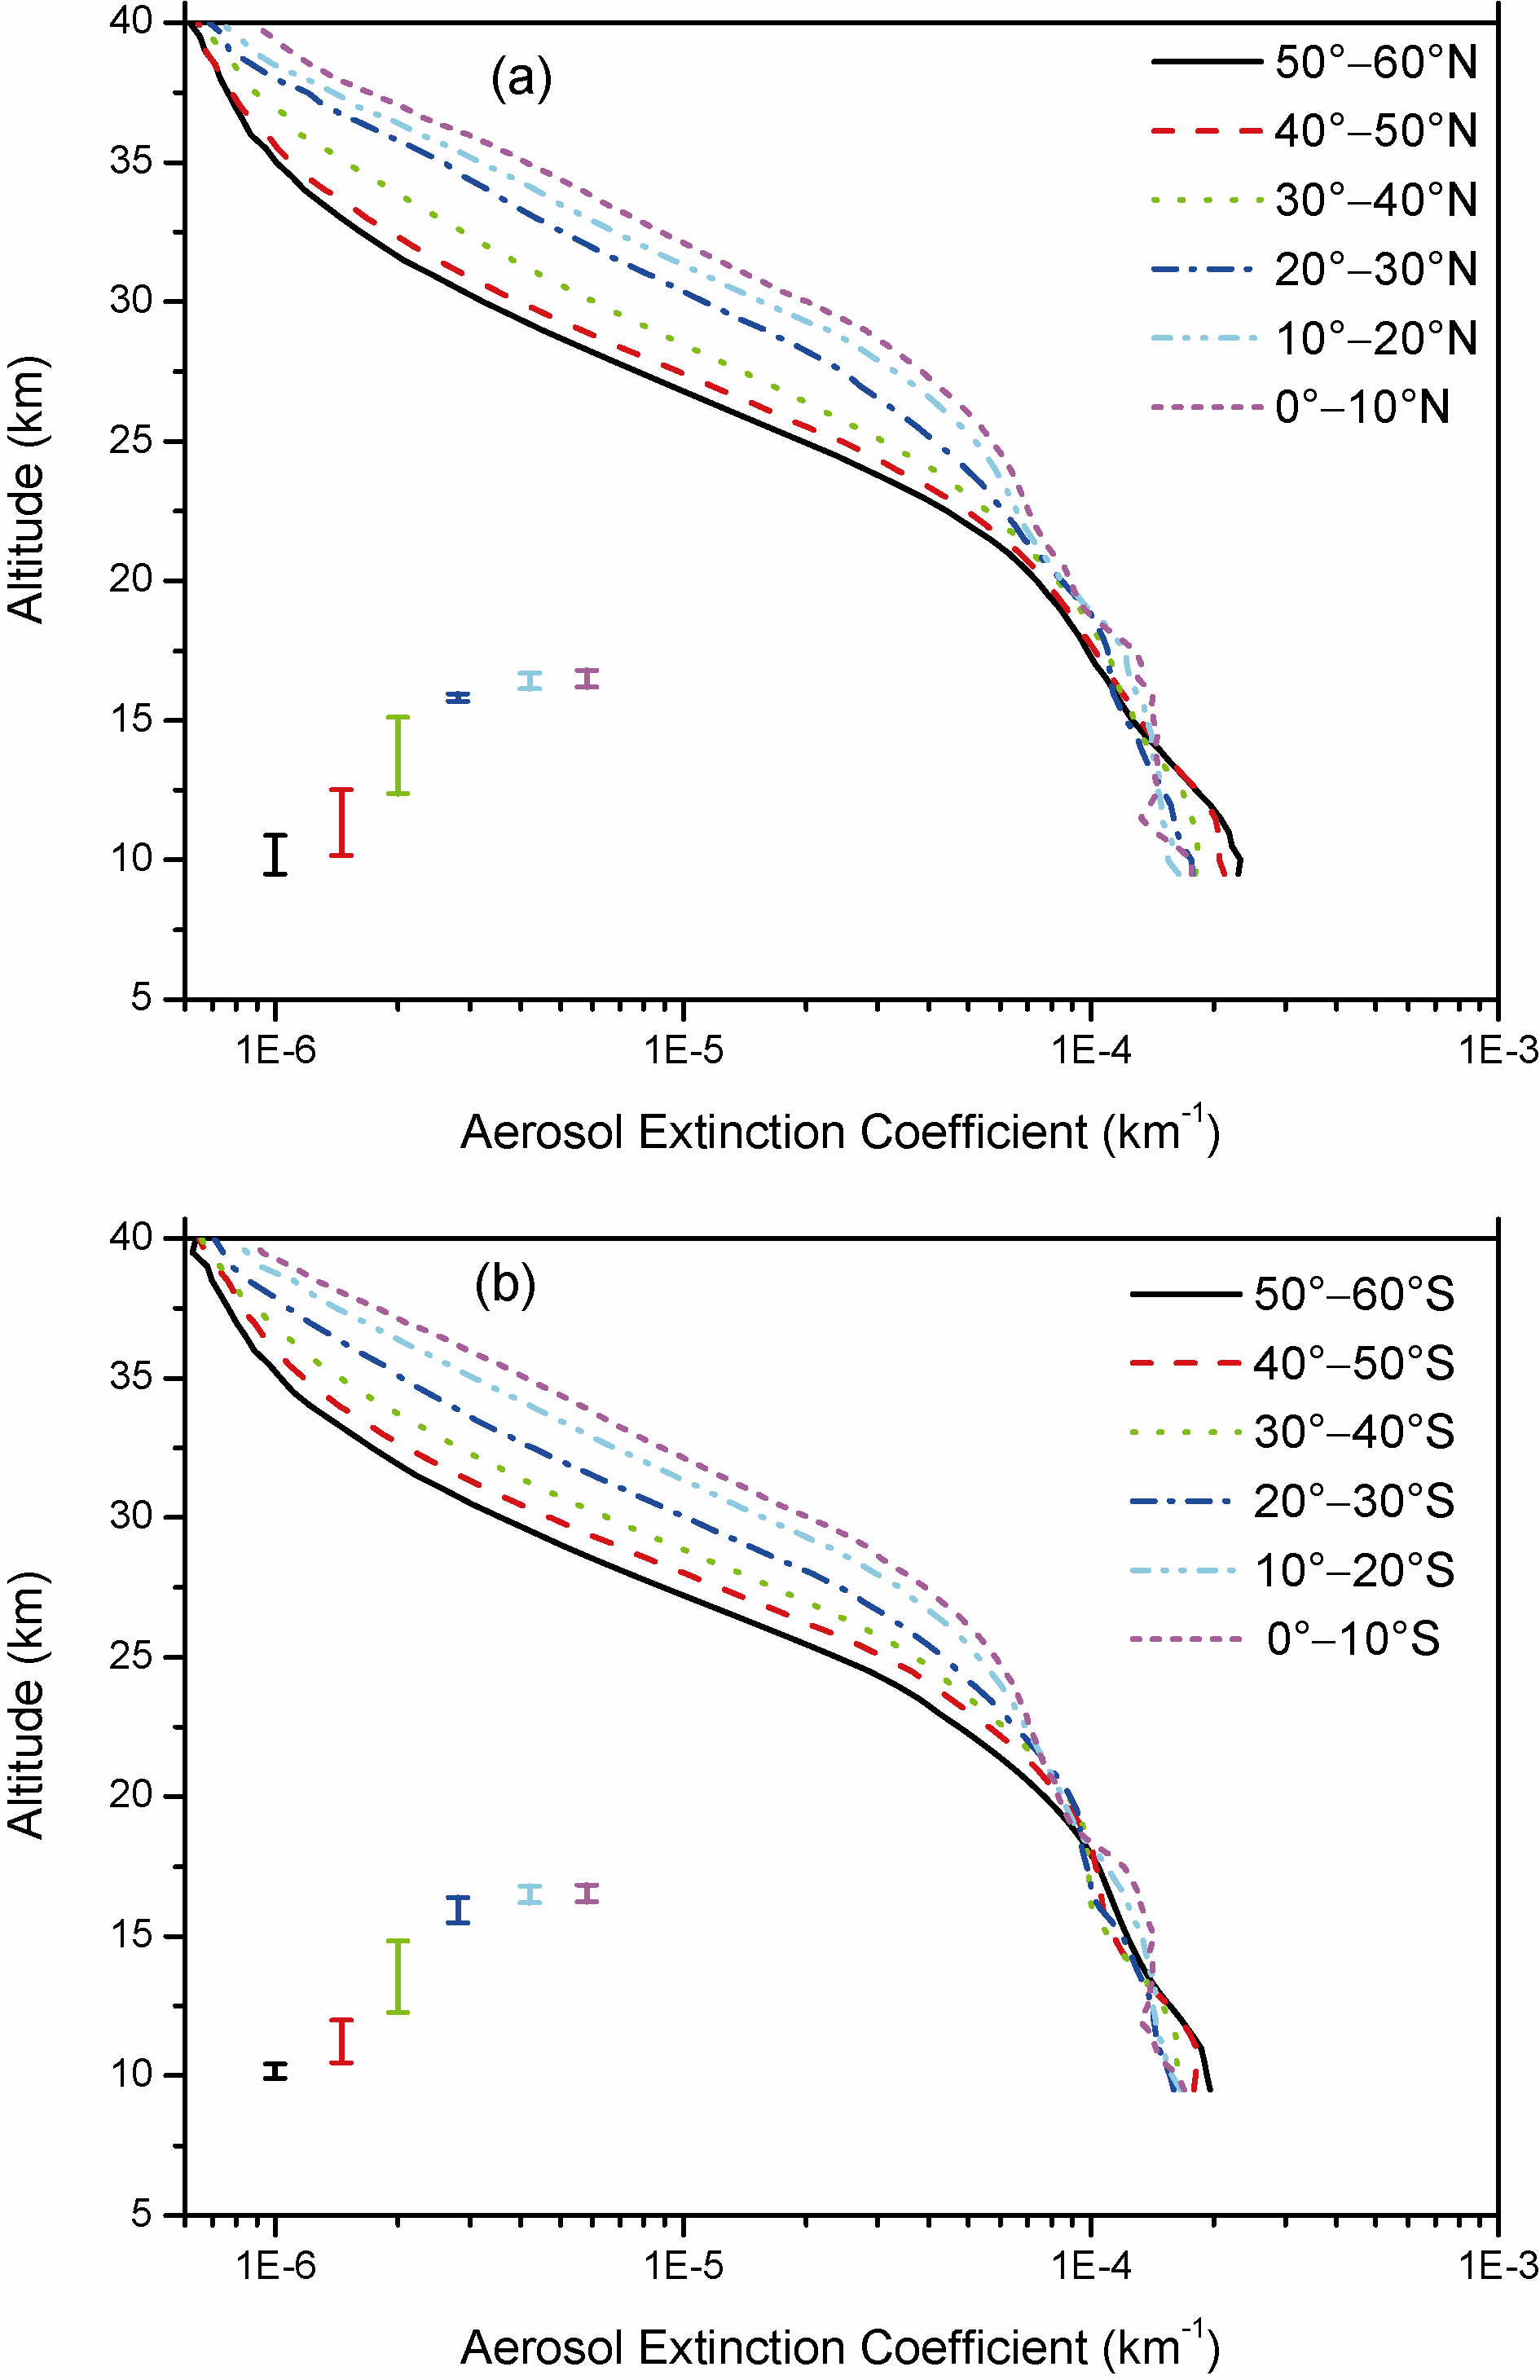
| Figure 1 Zonal-averaged annual mean SAGE II 1020-nm aerosol extinction profiles for each 10#cod#x000b0; latitude band from a 0-60#cod#x000b0;N and b 0- 60#cod#x000b0;S for 1998-2004. The observed heights of the tropopause are indicated by the vertical bars one standard deviation using the same color as the corresponding extinction profiles. |
| |