Optimal Precursor Perturbations of El Niño in the Zebiak-Cane Model for Different Cost Functions
Optimal Precursor Perturbations of El Niño in the Zebiak-Cane Model for Different Cost Functions |
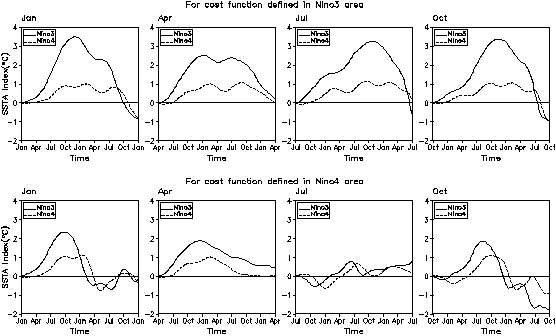
| Figure 3 The time series of the Ni#cod#x000f1;o3 and Ni#cod#x000f1;o4 index. The top bottom panels corresponds to the cost function defined as the SSTA in the Ni#cod#x000f1;o3 Nino4 area. The solid line is the Ni#cod#x000f1;o3 index and the dashed line is the Ni#cod#x000f1;o4 index. |
| |