Quantile Trends in Temperature Extremes in China
Quantile Trends in Temperature Extremes in China |
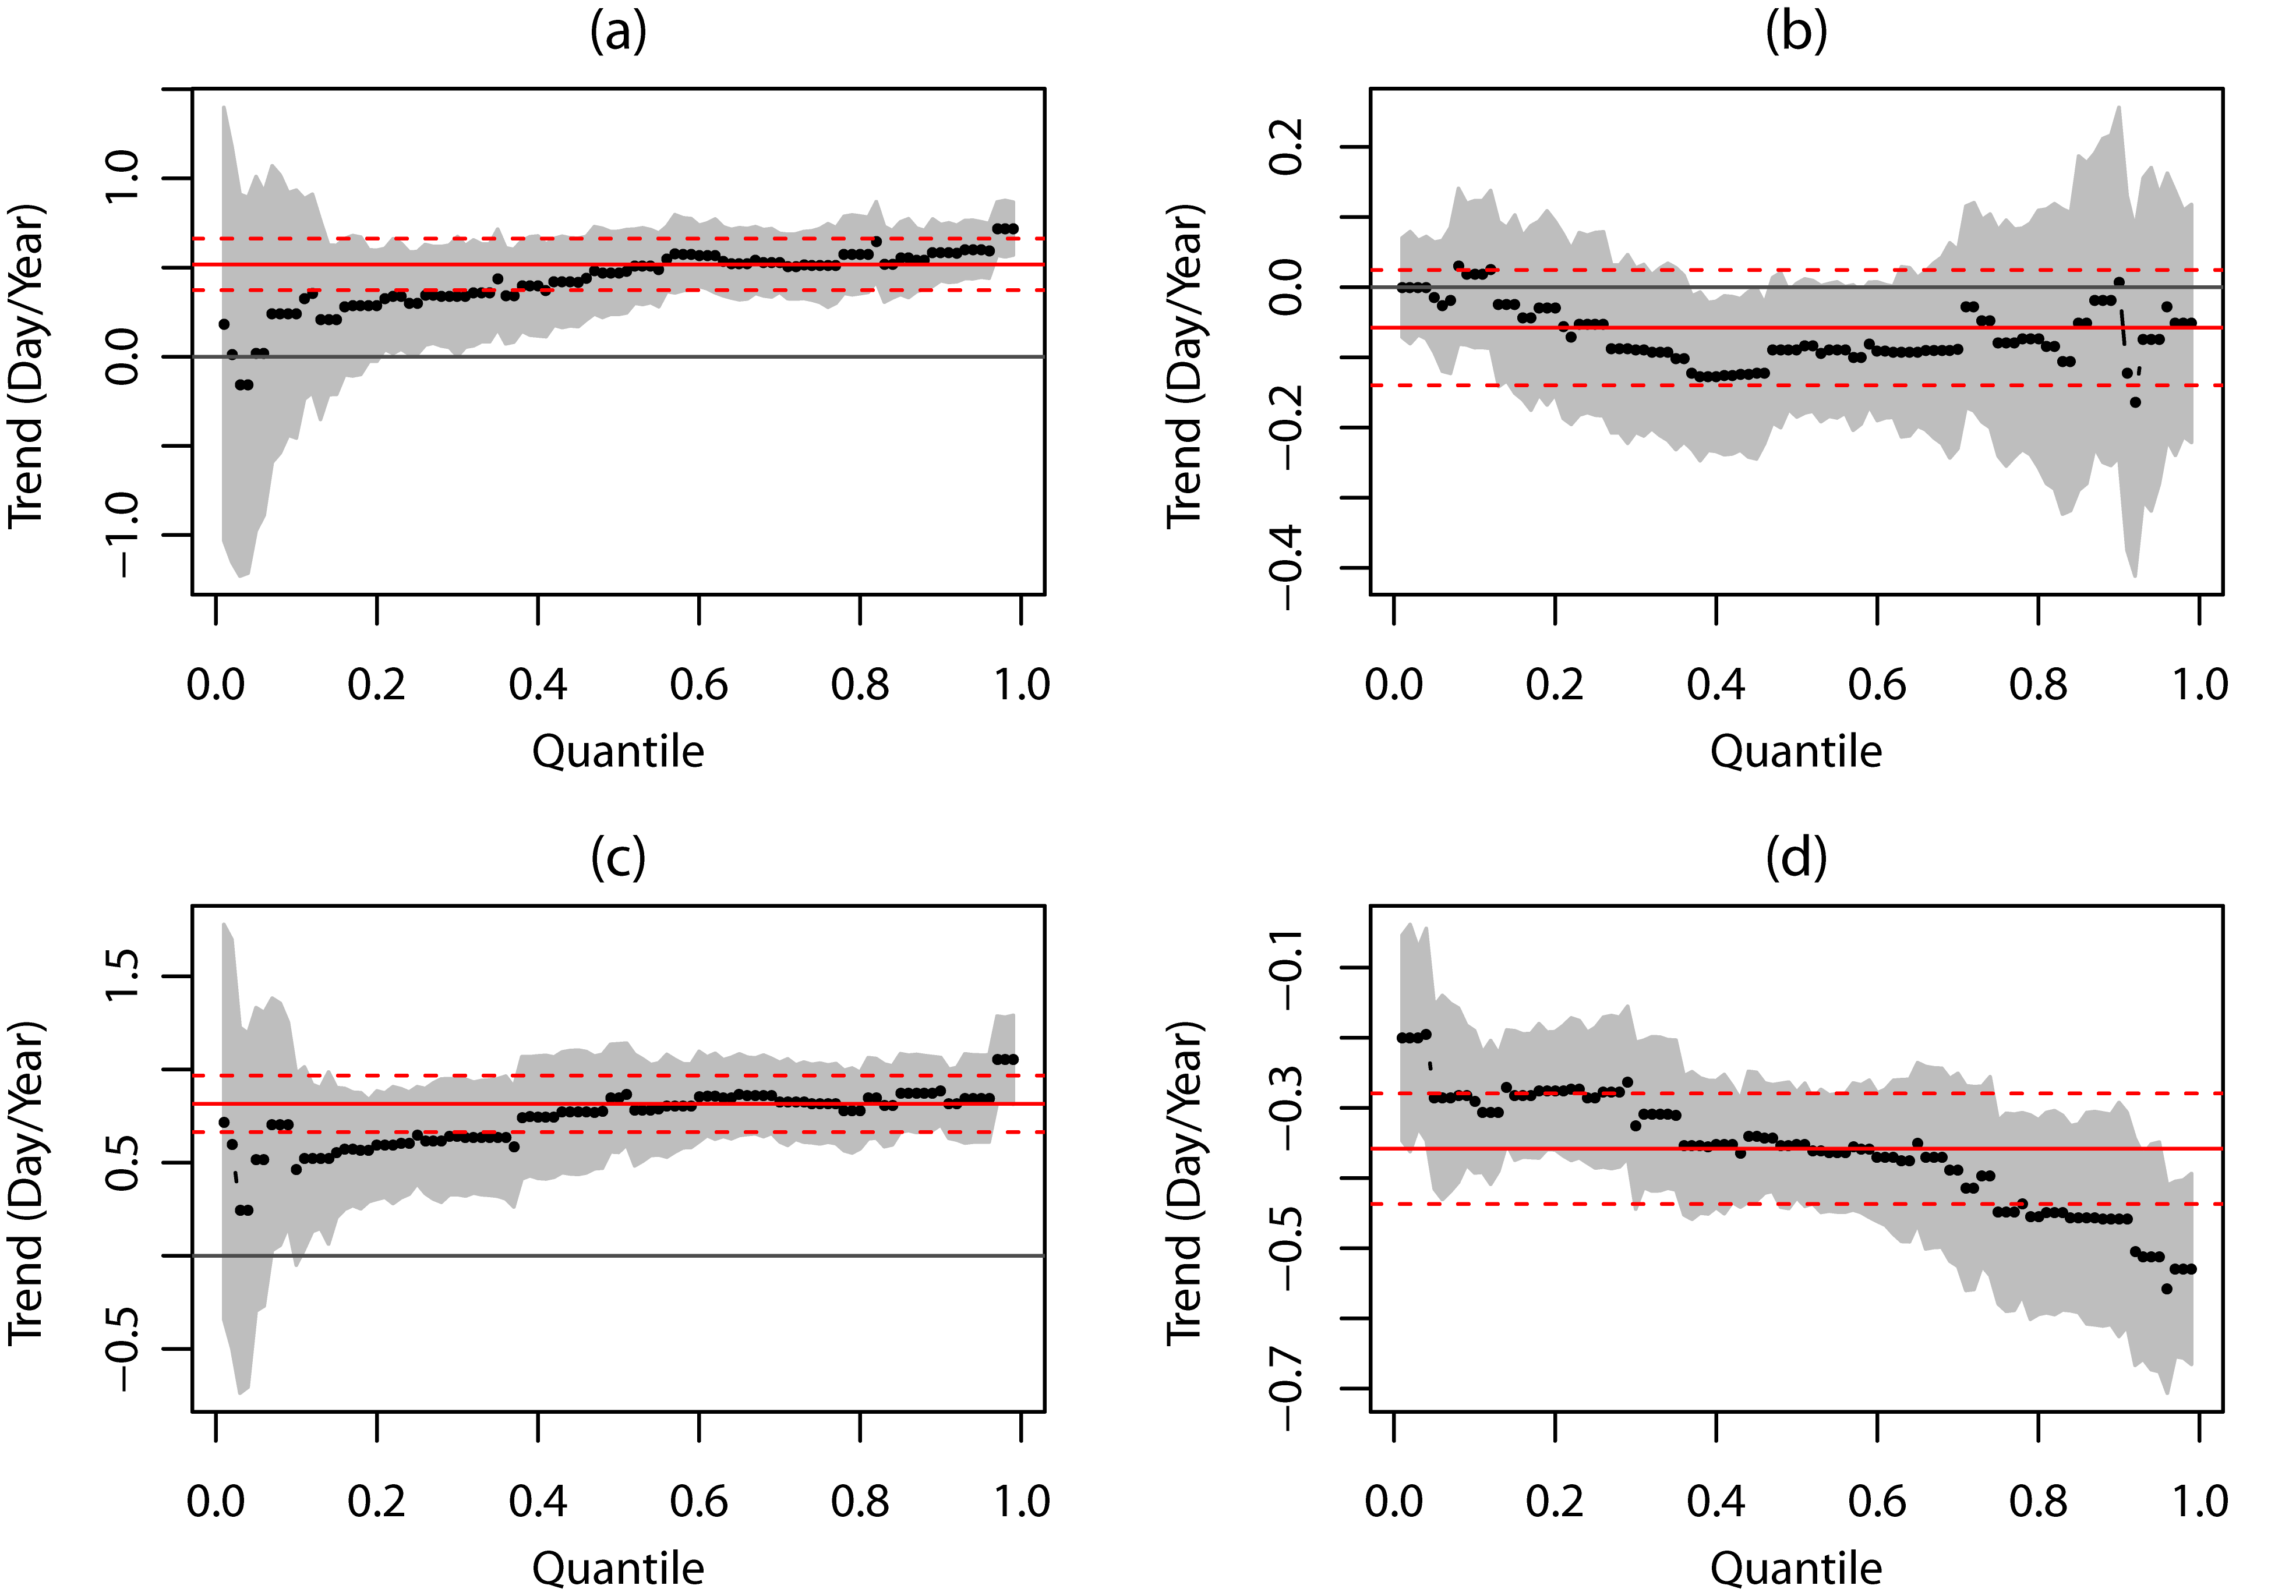
| Figure 2 The quantile regression coefficients black dots for the quantiles from 0.01 to 0.99 in increments of 0.01 and their 95% confidence levels shaded in grey for the four indices: a warm days; b cool days; c warm nights; and d cool nights. The solid red line is the mean trend estimated by LSM and dashed red lines indicate the 95% confidence levels. |
| |