
The Anomalous European Climates Linked to Different Euro-Atlantic
Blocking
Blocking
|
|


The impact on temperature and precipitation anomalies over the European continent of the different action centers of blocking events in the Euro-Atlantic sector was investigated. It was found that the position of the blocking action center in the Euro-Atlantic region seems to dominate European climates. When the center of the blocking action is in the Greenland region, there is a strong negative temperature anomaly over Central and Northern Europe, as well as a strong positive precipitation anomaly over southern Europe. However, there tends to be a strong negative temperature anomaly in the west (east) part of Europe when the center of the blocking action is shifted to the Eastern Atlantic and west Europe (east Europe). In particular, when the blocking action center is closer to the European continent, the fall in temperature becomes more evident over Central and south Europe than over other regions. Moreover, it was found that when the region where the blocking action center exists changes from the Eastern Atlantic and west Europe region to the east Europe region, the existing region of dominant positive precipitation anomalies varies from southwest Europe to southeast Europe and the Middle East.
Atmospheric blocking flow is an important low-freq-uency circulation often observed in mid-high latitudes in the Northern Hemisphere (NH) ( Berggren et al., 1949; Rex, 1950a, b). The dynamical mechanism of the blocking flow and its effect on extreme weathers and climates have attracted a great deal of interest ( Charney and Dev-ore, 1979; McWilliams, 1980; Shutts, 1983; Luo, 2005; Yamazaki and Itoh, 2013) because of its important role in mid-latitude climate variability ( Yiou and Nogaj, 2004; Scherrer et al., 2006; Sillmann et al., 2011; Buehler et al., 2011; De Vries et al., 2012).
Previous studies have revealed that the Euro-Atlantic blocking acts as an asymmetric effect on warm and cold extremes ( Buehler et al., 2011; Pfahl and Wernli, 2012). In particular, negative temperature anomalies over Central to Eastern Europe and drier conditions in winter are associated with an increased number of blocking events over Europe. However, it is unclear how the action center of Euro-Atlantic blocking events affects European climates if the blocking action center undergoes a zonal shift under a stronger mean zonal wind, although the climate impact of European winter blocking episodes has been examined in some studies ( Trigo et al., 2004). The aim of this paper is to provide an understanding of how the temperature and precipitation anomalies change as the center of the blocking action exhibits a noticeable shift in the Euro-Atlantic sector.
The remainder of the paper is organized as follows. In section 2, the data and methodology are briefly described. The results are presented in section 3. And finally, conclusions and a discussion are summarized in section 4.
The dataset used in this study was the daily multi-level geopotential height fields on a 2.5° × 2.5° grid from the National Centers for Environmental Prediction/National Center for Atmospheric Research (NCEP/NCAR) during the period from December 1950 to February 2012. In addition, the high-resolution daily precipitation and temperature data over the European continent used here was from the European Climate Assessment and Dataset project (E-OBS gridded dataset) with a 0.5° × 0.5° grid horizontal resolution from December 1950 to February 2012 ( Haylock et al., 2008). The focus of this paper is the winter season, which was considered to be from December to February (DJF). The daily temperature anomaly for which the seasonal cycle had been removed, was defined as a deviation of the daily temperature from its climatology winter mean (DJF) during the period 1950/51-2011/12. The same definition was made for the precipitation anomaly. To reduce the potential impact of the warming trend over Europe in the past six decades, the warming trend of the European surface air temperature was removed before further calculations (not shown) were made.
The TM blocking index designed by Tibaldi and Molteni (1990) was used to identify the blocking action in the Euro-Atlantic sector. The TM index is based on the reversal of the 500-hPa geopotential height gradient, which is described as follows:
| , (1a) |
| , (1b) |
| , (1c) |
| , (1d) |
where GHGS (GHGN) represents the southern (northern) 500-hPa geopotential height gradient at each given longitude. Z represents the geopotential height at a certain grid (
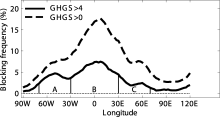
Figure 1 shows the longitudinal distribution of the frequency of days of blocking events (hereafter called the blocking frequency) in the Euro-Atlantic sector for GHGS > 4.0 and GHGS > 0 in terms of the TM index. We can see that the highest blocking frequency in the Euro-Atlantic sector is concentrated in the region from 30°W to 30°E, which is basically consistent with previous results ( Tibaldi and Molteni, 1990; Diao et al., 2006; Davini et al., 2012). The blocking frequency possesses three peaks along the longitude, which is more evident for GHGS > 4.0 than for GHGS > 0. Thus, it is reasonable to divide the geographic distribution of the blocking action in the Euro-Atlantic sector into three sub-regions: the Greenland region (70-30°W), the Eastern Atlantic and west Europe region (30°W-30°E; EAWE), and the east Europe region (30-70°E). In this case, further examination of the potential impacts of the different centers of the blocking action on climates over Europe is likely to be needed.
We calculated the blocking frequencies in the Green-land, EAEW, and east Europe regions using the TM index for GHGS > 4.0; the results are described in Table 1. A blocking event was defined to have taken place if the value of GHGS for GHGS > 4.0 persisted for at least three days. It is clear that there were 65, 157, and 70 blocking events in Greenland, EAWE, and east Europe, whose mean durations were 6.8, 6.7, and 5.9, respectively (Table 1). To further see the variation of blocking intensity with longitude, we defined the day with the maximum intensity during the life cycle of a blocking event as the lag 0 day. In each sub-region, the blocking intensity for every day could be determined according to the composite of the blocking intensity for all blocking events. As shown in Fig. 2a, the composite blocking intensity in the Greenland region is strongest, and it is weakest in the east Europe region. Such a result may be related to the existing position of the maximum Atlantic storm track. Figure 2b shows the relationship between the number and duration of blocking events in the three sub-regions. It is clear that blocking events with timescales of three to eight days are most frequent over the EAWE region and their mean duration is longer than that of those over east Europe. The time series of the mean blocking frequencies over the three regions are shown in Fig. 2c. It can be seen that the blocking frequencies exhibit interannual and decadal variability. As noted by Shabbar et al. (2001), the interannual and decadal variability of Euro-Atlantic blocking is related to the land-sea thermal contrast. We can see that the blocking frequencies in the Greenland and EAWE regions before the 1970s were higher than in east Europe, while the blocking frequency in east Europe was high during 1970-1985. In addition, the blocking frequencies over the EAWE and east Europe have tended to enhance since 2000. This suggests that the decadal variability of blocking frequencies over different regions is more likely to cause the decadal variation of European climates. This topic is further examined below.
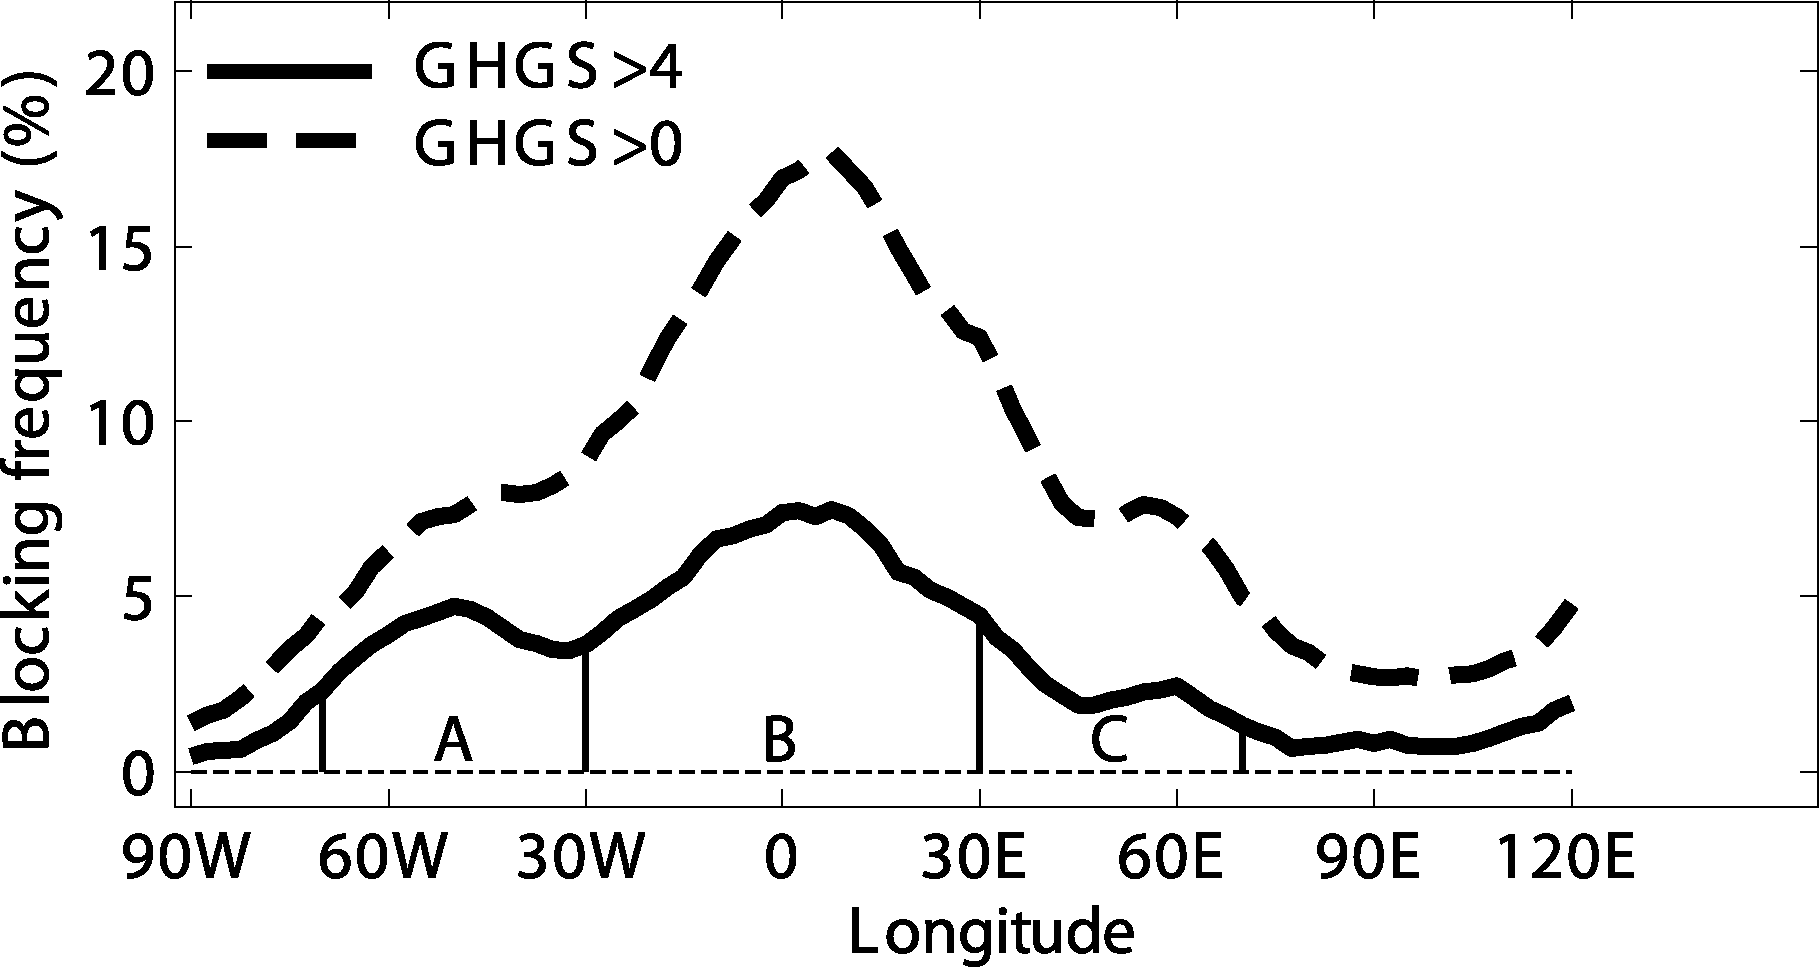 | Figure 1 The percentage of blocking days to the total days of winter (DJF) during 1950-2012 as a function of longitude for blocking events with GHGS > 0 (dotted line) and GHGS > 4.0 (solid line). Units: %. A, B, and C represent the three sub-regions: Greenland, Eastern Atlantic-west Europe (EAWE), and east Europe, respectively. |
| Table 1 Number and mean duration (units: days) of blocking events (equal to or larger than three days) in three sub-regions during the winter period (DJF) from 1950 to 2012. |
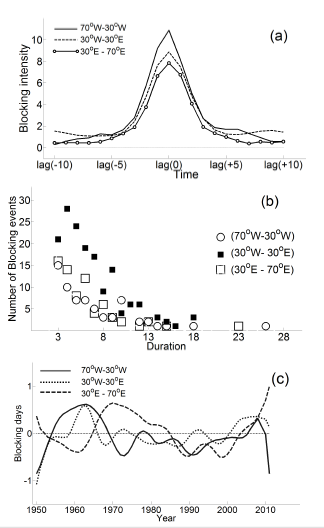 | Figure 2 (a) Composite blocking intensity for the blocking events located in the three regions; (b) number of blocking events as a function of duration (days) over the three regions; and (c) normalized time series of blocking frequency (event days) in the three regions during winter from 1950 to 2012. |
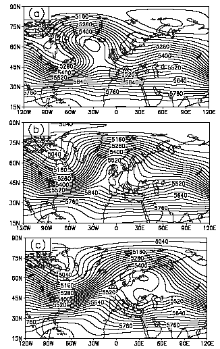
To further understand what factor in the blocking circulation affects the European climate, we produced composites of the flow patterns of blocking events in the three sub-regions: Greenland, EAWE, and east Europe. The blocking pattern in each region was obtained by averaging the height anomalies from lag(-2) to lag(+2) for all blocking events, as shown in Fig. 3. In the Greenland region (Fig. 3a), the blocking ridge is located near 30°W and southeast of Greenland (60°N). A strong trough appears on the upstream side of the blocking. In the EAWE region, the blocking circulation exhibits an Ω-type block (Fig. 3b) with a high pressure center located near 0° and 50°N. However, in the east Europe region (Fig. 3c), the blocking pattern exhibits a high-over-low dipole structure located near 30°E. Thus, the composite blocking flow patterns are different in the three sub-regions. As a result, it is conjectured that the different blocking flow patterns in the three sub-regions can produce different European climates. In the next subsection, we examine whether the different zonal location of the center of blocking action can lead to the variability of European climates by looking at the variations of temperature and precipitation anomalies.
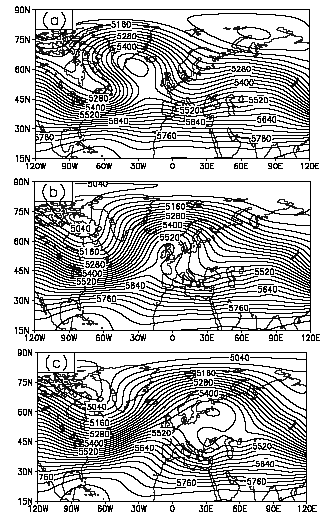 | Figure 3 Composite 500-hPa geopotential height fields for blocking events in (a) Greenland, (b) EAWE, and (c) east Europe for blocking events of GHGS > 4.0 during the period from lag(-2) to lag(+2) days. Units: gpm. |
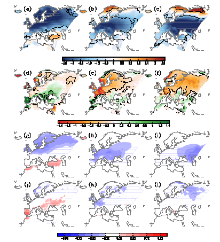
The surface air temperature anomalies in the European continent averaged from lag(-2) to lag(+2) in the three sub-regions are shown in Figs. 4a-c, while the time-mean precipitation anomalies are shown in Figs. 4d-f. We can see that a strong negative temperature anomaly is located in Central and Northern Europe when the center of the blocking action is in the Greenland region (Fig. 4a). When blocking events are active in the EAWE region, a significant negative temperature anomaly is located in Central and southern Europe (Fig. 4b). However, when the action center of blocking events are shifted to the east Europe region, the negative temperature anomaly is shifted eastward (Fig. 4c), so that a strong negative temperature anomaly is seen in Eastern Europe. Thus, the zonal position of the blocking action center is a key factor for the different European climates. This is because the different position of the blocking flow can determine the position of the temperature advection around the blocking region. Moreover, we also calculated the composite temperature anomaly with the warming trend included. The results were basically similar (not shown).
 | Figure 4 Composite (a-c) surface air temperature and (d-f) precipitation anomalies over the European continent averaged from lag(-2) to lag(+2) days for the blocking events over: (a, d) Greenland, (b, e) EAWE, and (c, f) east Europe. Thick solid (dotted) lines in the shaded area denote the positive (negative) anomaly region above the 99% confidence level for a two-sided StudentˇŻs t-test. The units of temperature (precipitation) anomaly are °C (mm). The correlation distribution of (g-i) the surface air temperature and (j-l) precipitation with winter mean blocking frequency time series for the blocking events over: (g, j) Greenland, (h, k) EAWE, and (i, l) east Europe. The shaded area indicates the correlation coefficients above the 99% confidence level for a correlation test. |
On the other hand, it was further found that a significant positive precipitation anomaly is seen over southwestern and Central Europe along the southwest-northeast direction when the blocking pattern is in the Greenland region (Fig. 4d). For blocking events in the EAWE region, the strong positive precipitation anomaly exhibits two clear branches around north and southwest Europe (Fig. 4e), in which the southern branch is dominant. However, when the blocking events are concentrated in the east Europe region, the positive precipitation anomaly becomes weak and is located in southern Europe (Fig. 4f). Thus, the blocking events in different regions can act as an asymmetric effect on temperature and precipitation anomalies. The physical mechanism of how the blocking flow affects the temperature anomaly has been examined in Mullen (1987) and Trigo et al. (2004), but it is beyond the scope of this study.
The correlation distributions of the surface air temperature (precipitation) anomalies over Europe with winter mean blocking frequency time series over the three regions are shown in Figs. 4g-i (Figs. 4j-l). The regions with a statistically significant correlation are basically consistent with the existing regions of significant negative temperature anomalies (Figs. 4a-c). This means that the high blocking frequency in the Greenland, EAWE, and east Europe regions (Fig. 2c) may lead to marked negative temperature anomalies in central-north, central-south, and the east European continent, respectively. A significant positive correlation is seen over southern Europe, especially over southwest Europe (Fig. 4j). This indicates that the high blocking frequency in the Greenland region may cause the most marked positive precipitation anomaly in southwest Europe (Fig. 4d). A small significant positive correlation region is still seen in southern Europe for higher blocking frequencies over the EAWE and east Europe regions (Figs. 4k and 4l). This means that a positive precipitation anomaly can be seen in southern Europe under high blocking frequency conditions over the EAWE and east Europe regions (Figs. 4e and 4f).
In this paper, the action center of Euro-Atlantic blocking events was first divided into three sub-regions: Greenland, EAWE, and east Europe, in terms of the longitudinal distribution of the blocking frequency. Then, the possible impact of different centers of the blocking action in the Euro-Atlantic sector on European climates (temperature and precipitation anomalies) was examined. It was found that the zonal position of the blocking action seems to be able to result in a drastic change in European climates.
When the blocking events are frequent in the Green-land region, a strong negative temperature anomaly is observed in Central and Northern Europe, as well as a positive precipitation anomaly in southwest Europe. A str-ong negative temperature anomaly, with a double branch positive precipitation anomaly structure along the north and south sides of the European continent, appears in the west and south of Europe when the center of the blocking action is in the EAWE region. However, when frequent blocking events are concentrated in the east Europe region, the negative temperature anomaly is enhanced in Eastern Europe, while the positive precipitation anomaly is weak in southern Europe. Moreover, the correlation between the blocking frequency time series and surface air temperature and precipitation anomalies was also presented to confirm the above findings. Thus, the different positions of the blocking action in the Euro-Atlantic sector can cause different impacts on the temperature and precipitation anomalies over the European continent.
Although the impact of the location of the blocking action center on European climates has been examined in this paper, the dynamical mechanism of such an impact was not investigated in this study. Further study on this topic is needed in future work.
Acknowledgements. This work was supported by the National Natural Science Foundation of China (Grant No. 41375067). We also acknowledge the NCEP/NCAR Reanalysis dataset provided by the NOAA and the E-OBS dataset provided by the European
Climate Assessment & Dataset project.
| 1 |
|
| 2 |
|
| 3 |
|
| 4 |
|
| 5 |
|
| 6 |
|
| 7 |
|
| 8 |
|
| 9 |
|
| 10 |
|
| 11 |
|
| 12 |
|
| 13 |
|
| 14 |
|
| 15 |
|
| 16 |
|
| 17 |
|
| 18 |
|
| 19 |
|
| 20 |
|
| 21 |
|