Self-Similar Characteristic for the Ramp Structures of Wind Speed
Cite this Article
SONG Zong-Peng, HU Fei, XU Jing-Jing, CHENG Xue-Ling. Self-Similar Characteristic for the Ramp Structures of Wind Speed. Atmospheric and Oceanic Science Letters, 2014, 7(4): 320-323 
Permissions
Copyright?2014, Editorial office of Atmospheric and Oceanic Science Letters
This is an Open Access article under the terms of CCAL.
Self-Similar Characteristic for the Ramp Structures of Wind Speed
Abstract
Time series of wind speed are composed of large and small ramp structures. Data analysis reveals a power law relation between the linear slope of ramp structures and the time scale. This suggests that these ramp structures of wind speed have a self-similar characteristic. The lower limit of the self-similar scale range was 2 s. The upper limit is unexpectedly large at 27 min. Data are collected from grassland, city, and lake areas. Although these data have different underlying surfaces, all of them clearly show a power law relation, with slight differences in their power exponents.
Keyword:
ramp structure; self-similarity; power law; time series of wind speed
1 Introduction
Self-similarity means the main body is similar to its fragments. It predicts a power law relation between physical quantity and scales. For wind speed, the physical quantity is the energy spectrum, which has a power law relation with scale ( Kolmogorov, 1941; Kader and Yaglom, 1991; Kaimal and Finnigan, 1994). It reveals the self-similarity of various scales of eddies in the inertial range ( Frisch, 1995). The inertial range is usually below 4 min for wind speed ( Van der Hoven, 1957; Stull, 1987). This is a small-scale range. When the inertial range is exceeded and for larger scales, the self-similarity is broken.
However, the large-scale fluctuations of 4-30 min are important for the transport process in the atmospheric boundary layer ( Sakai et al., 2001). This paper tries to recover the self-similarity of large-scale fluctuation, from the perspective of the shape of the time series, rather than the perspective of the energy spectrum. In the time series of wind speed, there are various scales of fluctuations. Almost all these fluctuations have a similar shape-a ramp structure. It suggests the self-similar characteristic for these ramp structures, and a possible power law relation between a certain physical quantity of the ramp structure and the time scale. Antonia et al. (1982) used to study the ramp structure of temperature, and pointed out that it reflects a kind of coherent structure. Coherent structures are often used to study flux transport ( Chen et al., 1997; Katul and Hsieh,1997) and gust ( Cheng et al., 2007; Zeng et al., 2010), but not the self-similarity character. From the analysis results of several ramp structures, we suspect that this physical quantity is the linear slope of the ramp structure. To confirm this hypothesis, sufficient data are analyzed and the results are presented in this paper.
The detail about the linear slope of the ramp structures is introduced in section 2.1. Before calculating its linear slope, an integrated ramp structure must be precisely extracted from the data. However, the time series is very disordered, which makes it extremely hard to distinguish an integrated ramp structure. Therefore, we must use some reliable methods to find the ramp structure. The discrete wavelet transform can manifest ramp structures clearly in data; and this is introduced in section 2.2. Data are collected from three different underlying surfaces: grassland (from Xilin Gol grassland, height 70 m), city (from Beijing 325 m Meteorological Tower, height 47 m), and lake (from Baiyangdian Lake, height 12 m). More details about these data are introduced in section 2.3. In section 3, we show the computed results of the linear slopes of the ramp structures, and verify our hypothesis.
2 Method and data
Ramp structure of wind speed contains two parts: an increase part and a decrease part. Both parts show a linear characteristic and have a linear slope, k. Using the discrete wavelet transform, ramp structures can manifested clearly in the time series of wind speed ( Hu, 1998; Li et al., 2001; Cheng and Hu, 2005). Their linear slope, k, can then be calculated. Time scale is expressed by δ t in this paper.
2.1 Linear characteristic of ramp structure and its linear slope, k
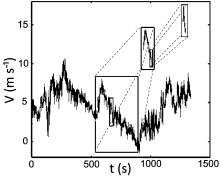
The time series of wind speed are composed of large and small ramp structures, as shown in Fig. 1. In this figure, three ramp structures have been extracted, and these are shown in black frames. We can see that the large ramp structure contains small ramp structures; the small ramp structure contains smaller ones, and so on.
The ramp structure contains two parts: an increase part and a decrease part. The body of the increase/decrease part always shows a linear characteristic. Its linear slope, k, can be computed by linear regression. We compute the k of the three ramp structures extracted in Fig. 1, and these are shown in Fig. 2. kappears to have an inverse power law relation with δ t, during both the increase and decrease parts. Next, we extract many ramp structures from the data, to verify this power law relation.
 | Figure 1 Ramp structures of wind speed. Data collected from Xilin Gol grassland (height: 30 m). V is the wind speed (units: m s-1) of the prevailing wind direction; t is time (units: s). |
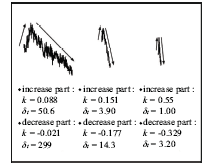 | Figure 2 Three ramp structures extracted from Fig. 1, and the linear slope, k(units: m s-2), and scale, δ t (units: s), of their increase/decrease parts. |
However, the time series of wind speed sometimes seem very complicated and disordered, which makes it extremely hard to distinguish ramp structures; so, we need a reliable method to manifest the ramp structures. The discrete wavelet transform, as we shall see next, is a reliable method.
2.2 Manifesting ramp structures using the discrete wavelet transform
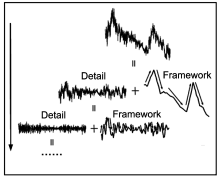
Using the discrete wavelet transform at a certain scale-level, the time series can be decomposed, and then reconstructed into two parts: the framework part and the detail part. The framework part is the framework of the time series at a certain scale-level, and the detail part is the remaining part after the framework part has been removed from the time series. The two parts can be added together to get a complete time series. Very importantly, the ramp structure is clearly manifested in the framework part, and is very easy to distinguish. The detail part can then be decomposed and reconstructed using the wavelet transform again. This time the wavelet scale is smaller than last time. It gives a smaller framework part and a smaller detail part; so, we then obtain smaller ramp structures from the framework part. By repeating this process, the framework part can be manifested continuously from the detail part of the last level, down to the smallest scale-level. Thus, we can obtain ramp structures of all the scale levels.
To illustrate this, we made a sketch as shown in Fig. 3. The original wind speed signal is on the top. We first apply the discrete wavelet transform (here, we use the third order Daubechies wavelet) to the signal on a larger scale-level. The original signal is then divided into two parts (the second line on the figure). The detail part is on the left of the figure. The framework part is on the right, and clearly reveals the ramp structures of the original signal. Next, the detail part is divided again using the discrete wavelet transform on a smaller scale-level. It gives a smaller framework part and a smaller detail part (the third line on the figure). The ellipsis represents the repeating of this process from the large scale to the small scale.
Most of the framework parts fit perfectly with the original signal. Their linear slope, k, are almost the same as that of the original signal. Therefore, we calculate their k instead of calculating that of the original signal. It is important to note there are a small number of framework parts that do not fit the original signal well. We discard these inaccurate ones for the reliability of computing the result.
2.3 Data
Following the above method, we extract ramp structures from three sets of data. They are collected from the Xilin Gol grassland (underlying surface: grassland; Inner Mongolia; sample height: 70 m; sample frequency: 20 Hz; sample time: 1500 LST (local standard time) 24 July 2009 to 1400 LST 25 July 2009), Beijing 325 m Meteorological Tower (underlying surface: city; sample height: 47 m; sample frequency: 20 Hz; sample time: 0000 LST 1 January 2005 to 2300 LST 1 January 2005), and Baiyangdian Lake (underlying surface: lake; Hebei Province; sample height: 12 m; sample frequency: 10 Hz; sample time: 0700 LST 15 September 2005 to 0600 LST 16 September 2005).
3 Results and discussion
Using the above method, we obtain 809 ramp structures from the Xilin Gol grassland data, 782 ramp structures from the Beijing 325 m Meteorological Tower data, and 804 ramp structures from the Baiyangdian Lake data. We compute their linear slope, k, (for both the increase and decrease parts) and scale, δ t. These are shown in Fig. 4. The decrease parts are on the left of the figure, and their linear slope, k, are negative. The increase parts are on the right, and their k are positive. In this figure, there seems to be a power law relation between k and δ t for both the decrease and increase parts:
 | Figure 3 A sketch of how to manifest ramp structures from large scale to small scale. |
 | Figure 4 Analysis result of data from (a) Xilin Gol grassland (height: 70 m; power exponents, θ, are 0.75 (decrease part) and -0.76 (increase part)); (b) Beijing 325m Meteorological Tower (power exponents, θ, are 0.96 (decrease part) and -0.90 (increase part)); and (c) Baiyangdian Lake (height: 12 m; power exponents, θ, are 0.79 (decrease part) and -0.76 (increase part)). |
We then compute the power exponents, θ, by linear regression. θ has opposite sign to k. The θof the decrease parts are 0.75 (Xilin Gol grassland), 0.96 (Beijing 325 m Meteorological Tower), and 0.79 (Baiyangdian Lake). The θof the increase parts are -0.76 (Xilin Gol grassland), -0.90 (Beijing 325 m Meteorological Tower), and -0.76 (Baiyangdian Lake). For both the decrease and increase parts, their linear slope, k, all have an inverse power law relation with scale, δ t.
From the perspective of self-similarity, this power law relation means that the physical quantity has self-similar characteristic. In our research, this physical quantity was the linear slope, k, of the ramp structure. The lower limit of the self-similar scale range was 2 s. The upper-limit scale is higher than expected. It reaches 27 min in the Xilin Gol grassland data, while the upper-limit scale of the inertial range is only 4 min. The large-scale fluctuations that contribute to the transport process are contained in this range. The self-similarity of the large scale is recovered in our work.
4 Conclusions
This paper investigates the self-similar characteristic for the ramp structure of wind speed. There are two important quantities of ramp structures: linear slope, k, and scale, δ t. Data analysis of three different underlying surfaces all show a power law relation between k and δ t. This suggests that the k of the ramp structure has a self-similar characteristic. The data give a self-similar scale range from 2 s to 27 min.
This work extends the self-similar range to a larger scale, while it is often considered that the self-similarity is broken in large scales. It is a little like the work of extended self-similarity ( Benzi et al., 1993), which also extends the inertial range to a larger scale by using a simple algebraic transformation. This reveals the hidden self-similarity in large scales. Our work also reveals this hidden self-similarity from the perspective of the linear slope of the ramp structure. We suppose that this self-similarity may also exist in other fields such as economics, biology, and so on. We intend to verifying this in the future.
However, in the extraction process we do not obtain all the ramp structures that constituted the time series. On the one hand, some ramp structures are too disordered to be distinguished; so, we have to abandon them. On the other hand, the wavelet method we use has its own limitation. It depends on manual intervention to judge the fitting effect. This process takes far too much time if we choose all the ramp structures; therefore, we only choose some of them. However, it is not purposive behavior and the choice is random. The wavelet method needs further development to get rid of the manual intervention. In addition, as a limitation of sample frequency, we cannot obtain smaller ramp structures. To avoid the sampling distortion, we only use ramp structures that are above 2 s. To verify this self-similarity of smaller scales, this research needs higher sample frequency data.
Acknowledgements. This work is supported by the National Natural Science Foundation of China (Grant No. 91215302), "One-Three-Five" Strategic Planning (wind power prediction) of the Institute of Atmospheric Physics, Chinese Academy of Sciences (CAS) (Grant No. Y267014601), and the Strategic Project of Science and Technology of CAS (Grant No. XDA05040301).
Reference
| 1 |
|
| 2 |
|
| 3 |
|
| 4 |
|
| 5 |
|
| 6 |
|
| 7 |
|
| 8 |
|
| 9 |
|
| 10 |
|
| 11 |
|
| 12 |
|
| 13 |
|
| 14 |
|
| 15 |
|
| 16 |
|