Recent Change of the South Asian High
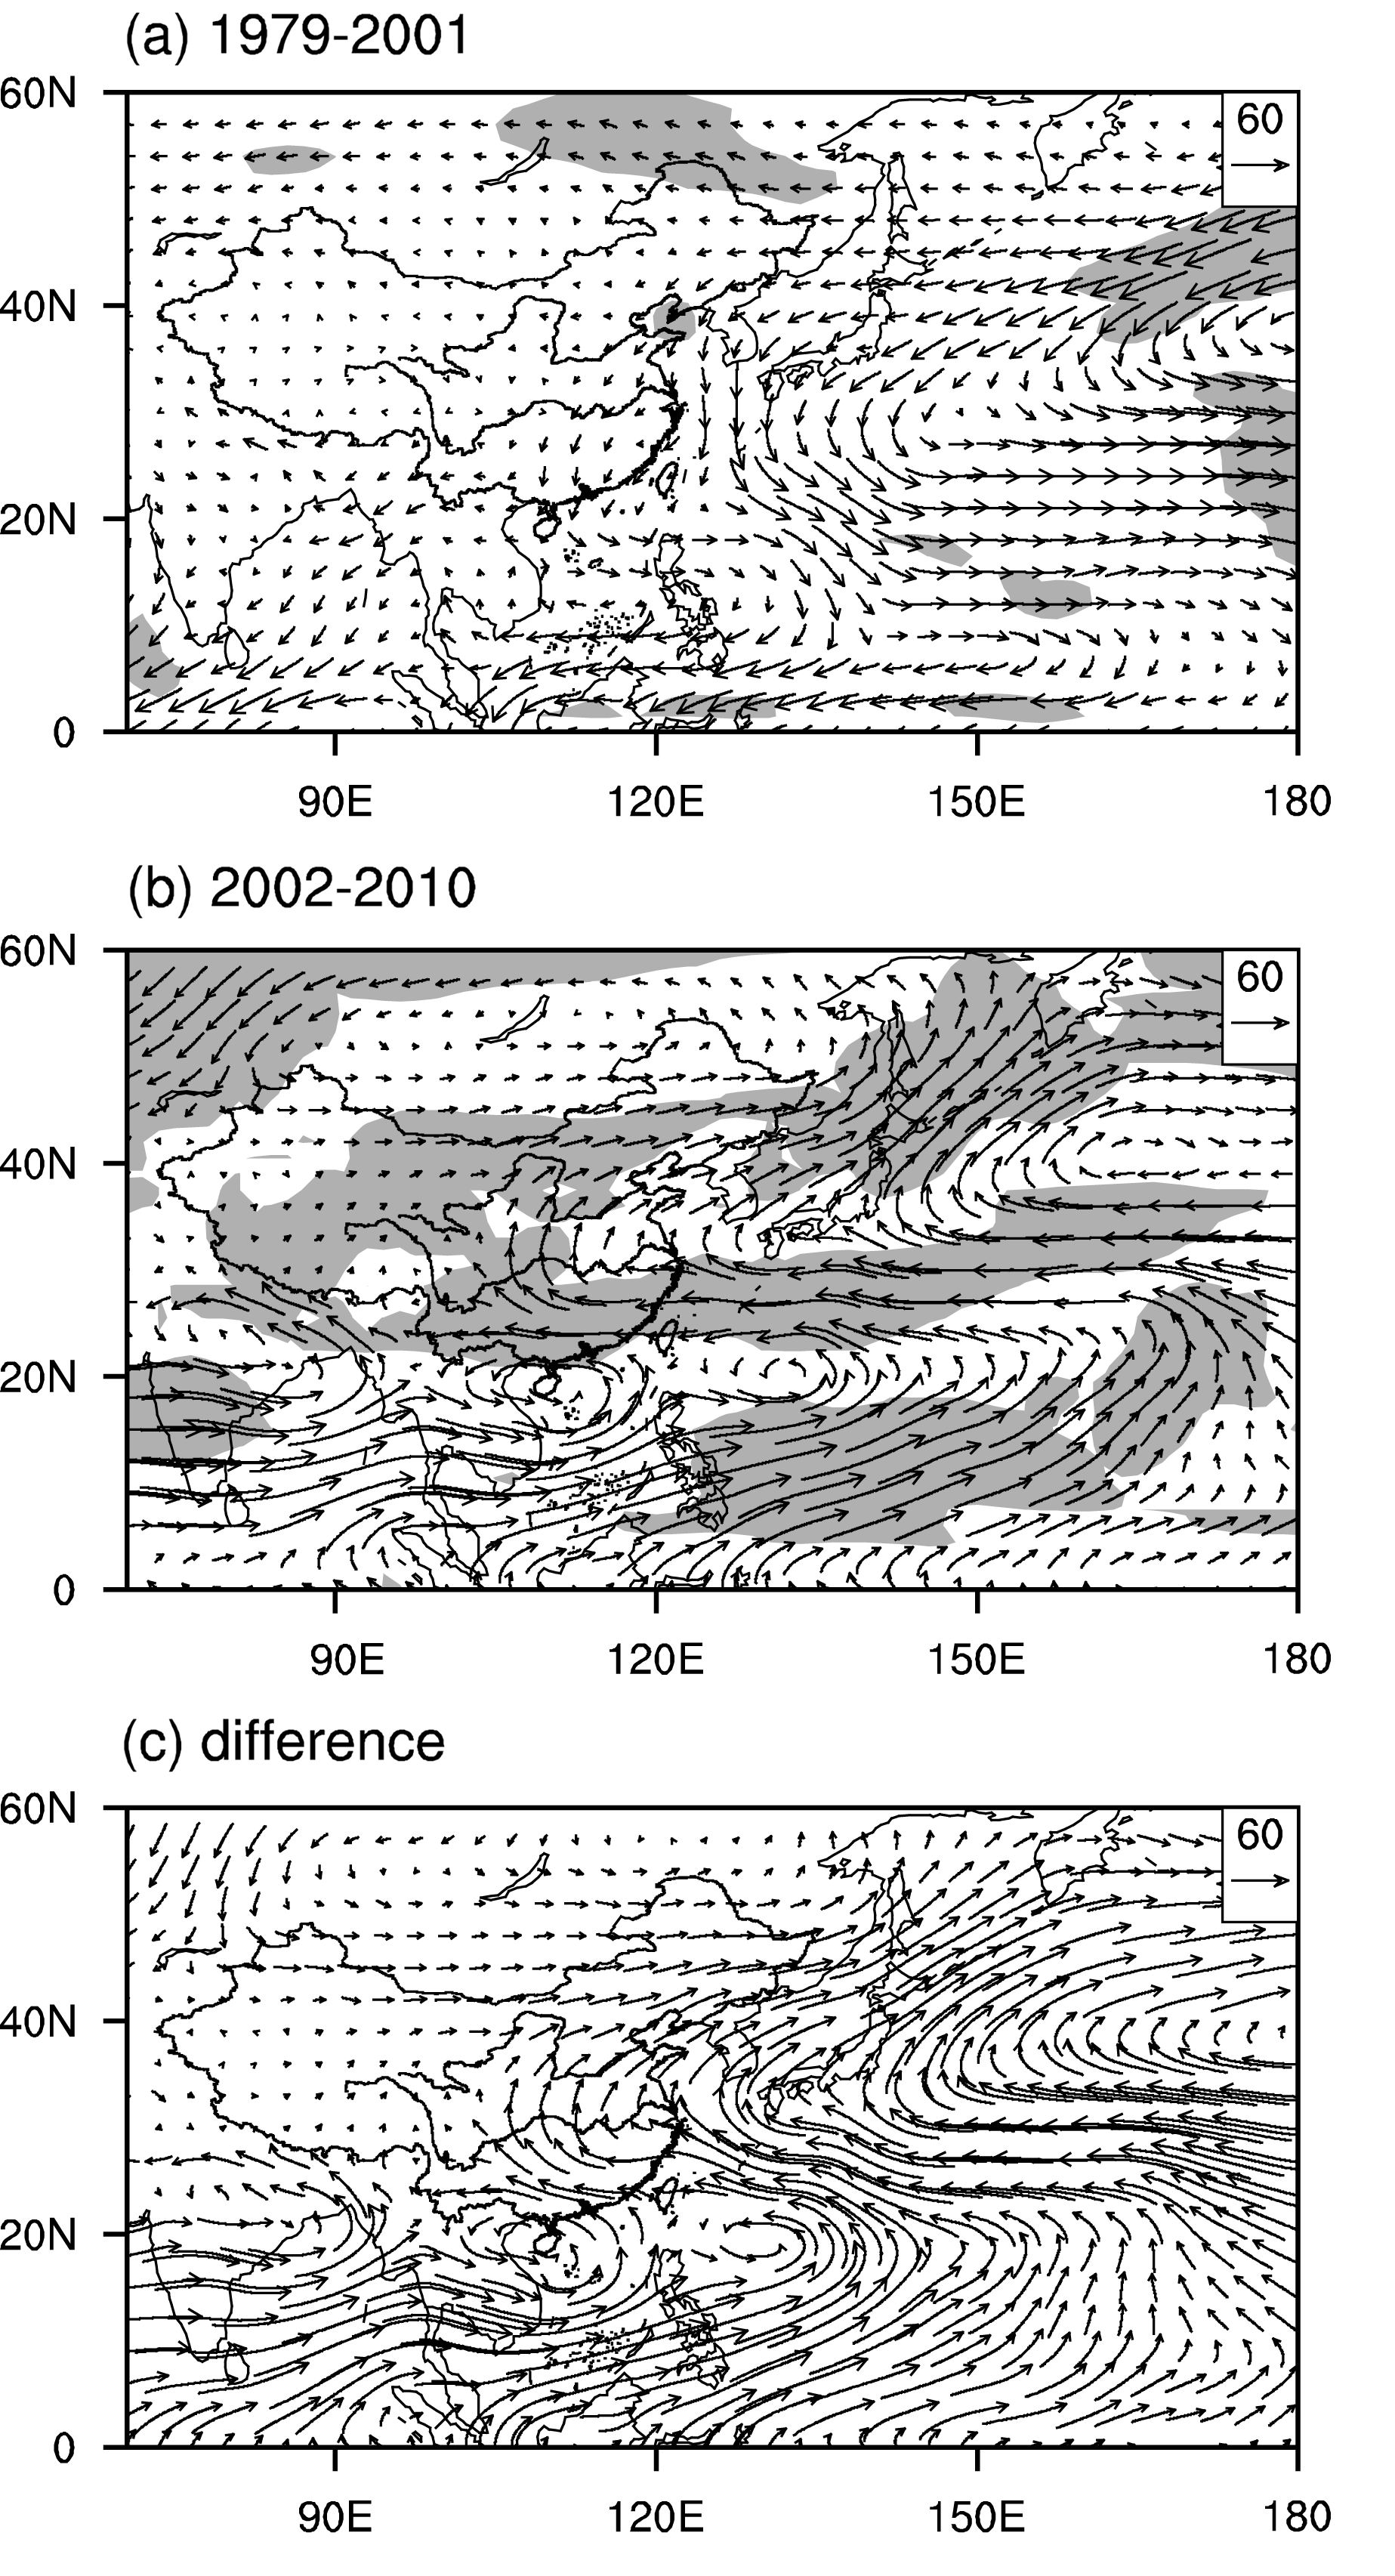
and the variation over the Huang-Huai River is significant at the 95% confidence level. Situations for the regression patterns of the vertical integral of water vapor flux for the two periods show that in 1979-2001 Fig. 4a the relation between the area of the SAH and the moisture flux is not outstanding, while for the period 2002-2010 Fig. 4b the water vapor flux over the Huang-Huai River and South China are presented to be associated more with the area of the SAH. Significant anomalous westerly moisture flux transports from the Philippines to the subtropical western North Pacific, then turns easterly near 170#cod#x000b0;E, and finally arrives at South China. A part of the anomalous water vapor converges in South China, and the rest moves northward and becomes anomalous westerly winds. The anomalous westerly vapor converges again in the Huang- Huai River, resulting in more precipitation in South China and the Huang-Huai River. This anomalous transportation corresponds to a positive index A and indicates a streng-thened connection between the SAH and the precipitation after 2002. 4 Summary and discussion The variability of the zonal-mean subtracted SAH was investigated in this study. The results show an abrupt decadal decrease in the MJJAS SAH intensity and area in 2002. The EAWJ also shows a decrease at the entrance reg-ion along the north of the axis, located just at the north edge of the SAH, and further confirms the summer SAH decadal variation. The precipitation pattern over eastern China exhibits a decadal change during the same period. The link between the two transitions is strengthened after 2002 via the anomalous vertical integral of water vapor flux. It should be noted that the limitations caused by the different time lengths between the circulation data and the precipitation data generate much uncertainty about the results, so more in-depth analyses are needed. Additionally, many studies have pointed out that the SST anomalies in the Indian Ocean and eastern equatorial Pacific are Figure 4 The regressed MJJAS vertical integral of water vapor flux during a 1979-2001 and b 2002-2010, both against index A , and c the difference between the two periods against index A . Shading indicates significant areas that are above the 95% confidence level.