
Bias-Corrected Short-Range Ensemble Forecasts for Near-Surface
Variables during the Summer Season of 2010 in Northern China
Variables during the Summer Season of 2010 in Northern China
|
|


A running mean bias (RMB) correction approach was applied to the forecasts of near-surface variables in a seasonal short-range ensemble forecasting experiment with 57 consecutive cases during summer 2010 in the northern China region. To determine a proper training window length for calculating RMB, window lengths from 2 to 20 days were evaluated, and 16 days was taken as an optimal window length, since it receives most of the benefit from extending the window length.
Received 3 December 2013; revised 26 January 2014; accepted 24 February 2014; published 16 July 2014
The raw and 16-day RMB corrected ensembles were then evaluated for their ensemble mean forecast skills. The results show that the raw ensemble has obvious bias in all near-surface variables. The RMB correction can remove the bias reasonably well, and generate an unbiased ensemble. The bias correction not only reduces the ensemble mean forecast error, but also results in a better spread- error relationship. Moreover, two methods for computing calibrated probabilistic forecast (PF) were also evaluated through the 57 case dates: 1) using the relative frequency from the RMB-corrected ensemble; 2) computing the forecasting probabilities based on a historical rank histogram. The first method outperforms the second one, as it can improve both the reliability and the resolution of the PFs, while the second method only has a small effect on the reliability, indicating the necessity and importance of removing the systematic errors from the ensemble.
Keywords: short-range ensemble forecast, bias-correc- ted ensemble forecast, running mean bias correction, near-sur-face variable forecast
Citation: Zhu, J.-S., F.-Y. Kong, and H.-C. Lei, 2014: Bias-corrected short-range ensemble forecasts for near- sur-face variables during the summer season of 2010 in northern China, Atmos. Oceanic Sci. Lett., 7, 334-339, doi:10.3878/j.issn.1674-2834.13.0098.
The bias-corrected ensemble approach is a promising and inexpensive statistical post-processing technique to improve the accuracy of ensemble forecasts. Stensrud and Yussouf (2003) introduced a seven-day running mean bias (RMB) correction method on station forecasts of each ensemble member to improve the ensemble mean forecast of the near-surface variables in a short-range ensemble forecast (SREF) research. The approach was further eva-luated through a warm and a cool season SREF experiment ( Stensrud and Yussouf, 2005; Yussouf and Stensrud, 2007), and showed advantages for various operational model output statistics approaches. Eckel and Mass (2005) applied this approach on each model grid point in a SREF experiment, and received similar positive results.
It was also demonstrated that the probabilistic forecast (PF) produced from the relative frequency of the RMB- corrected ensemble forecast is more accurate than the raw ensemble PF ( Stensrud and Yussouf, 2007). Another PF calibration approach, introduced by Hamill and Colucci (1997, 1998), computes the forecast probability based on the information of historical rank distribution verification (called 'rank calibration' hereafter). This has been applied in many near-surface variables SREF researches, and has yielded promising results ( Eckel and Mass, 2005; Sten-srud and Yussouf, 2003, 2005).
A real-time regional short-range ensemble forecast sys-tem, the Institute of Atmospheric Physics Regional Ense-mble Forecasts System (IAP-REFS), was developed for the prediction of summer season precipitation events in northern China. The system is based on the Advanced Res-earch Weather Research and Forecasting model (WRF- ARW) version 3.2, with multiple initial conditions (ICs) and lateral boundary conditions (LBCs), and multiple phy--sics options. Evaluated through a single case study and a 65-case summer season study ( Zhu et al., 2012, 2013), the IAP-REFS was demonstrated to have large biases in near-surface variables forecasts, and required an effective bias-correction scheme.
Though the RMB correction and rank calibration are both accurate, and broadly used in producing the PF for near-surface variables, there have been few studies dev-oted to evaluating them under a common ensemble sys-tem, and their relative merits and defects remain unclear. This study aims to evaluate the two approaches through a summer season SREF experiment, and seeks an effective calibration algorithm for near-surface SREF variables, in the northern China region. Section 2 introduces the data and methodology, section 3 presents the results, and section 4 summarizes the study.
The raw ensemble forecast dataset was generated by IAP-REFS in an experiment using 74 consecutive dates (from 1 June 2010 to 18 August 2010, six dates were omitted because of a failure in the data archive). The IAP-REFS is based on the WRF-ARW model version 3.2,
with 11 members. Every ensemble member has 132 × 102 grid points at a 15-km grid spacing and 50 vertical levels, covering most of North and Northeast China (Fig. 1). One control member and ten perturbed members are driven by the National Centers for Environmental Prediction (NCEP) global forecast system (GFS) and ten of the global ens-emble forecast system (GEFS) perturbed forecasts (randomly chosen), respectively. An inflation factor of 2.0 is applied to the IC and LBC perturbations to compensate for the under-dispersion caused by the ICs and LBCs (see Zhu et al., 2013). The configurations of the physics options of each ensemble member are given in Table 1. The IAP-REFS ensemble forecasts were initiated at 0000 UTC for all case dates, and integrated for 48 hours. The IAP- REFS forecasts were outputted and verified with a 6-h time interval against the GFS analysis.
The n-day RMB correction was applied to the IAP- REFS in two steps: 1) the mean bias was calculated by averaging the biases of forecasts against the NCEP GFS analyses remapped to the IAP-REFS domain in the n most recent complete cases. This bias was assumed to be persistent among consecutive case dates as a result of imperfect modeling under the recent regime; 2) the bias was subtracted from the forecast of the present date. This bias correction was applied to each ensemble member at every grid point and forecast time. When there was a gap in the training case dates, the missing dates were replaced with the most recent available cases. Since only a few dates were missing in the seasonal experiment, it should not have caused a big difference compared to an experiment with strictly consecutive dates.
Three sets of near-surface variable PFs were computed: 1) using the relative frequency from raw IAP-REFS forecasts ('RAW-PF' hereafter); 2) using the relative freque-ncy from RMB-corrected IAP-REFS forecasts ('RMB- PF' hereafter); and 3) using rank calibration of raw IAP-
 | Figure 1 The domain of the Institute of Atmospheric Physics RegionalEnsemble Forecasts System (IAP-REFS). |
REFS forecasts based on the historical rank distribution ('RANK-PF' hereafter). The rank calibration in this study follows the method in Stensrud and Yussouf (2003, det-ailed in their appendix), which first projects the forecast event onto a range over the rank distribution histogram based on the values of forecast event threshold and ens-emble members, and then computes the forecasting probability by summing the percentage of the rank bins enclosed in this range. When a rank bin is partly enclosed, a probability distribution, uniform distribution for all inner rank bins, and a Gumbel distribution for the two outside rank bins, is given to compute the fraction of the bin percentage to be taken into account.
The 0.5° × 0.5° resolution GFS analysis remapped to the 15-km IAP-REFS domain was used as the verification dataset (available four times a day at 0000, 0600, 1200, and 1800 UTC).
| Table 1 Physics options for IAP-REFS. C00 is the control forecast, and P01 to P10 are the perturbed forecasts. The longwave radiation in all members is set to Rapid Radiative Transfer Model (RRTM). Abbreviations are as follows: Betts-Miller-Janjic (BMJ); Grell-Devenyi ensemble scheme (GD); Kain-Fritsch (KF); Land-Surface Model (LSM); Mellor-Yamada-Janjic (MYJ); Planet Boundary Layer (PBL); Rapid Update Cycle (RUC); WRF Single-Moment 3/5/6-class (WSM3/5/6); and Yonsei University (YSU). For details on the physical parameterization packages and references, see Skamarock et al. (2008). |
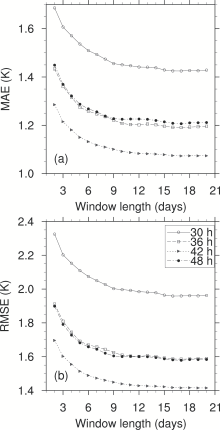
To determine the optimal window length for calculating the RMB for this forecasting experiment, bias corrections of different window lengths ranging from 2 to 20 days were applied to the 74-case dataset, resulting in 19 bias-corrected forecast datasets. In each correction, the first n days of forecasts were used for calculating the bias only, and these had not been bias corrected. The 19 calibrated datasets share common dates from 22 June to 18 August (53 case dates in total). The domain-averaged mean absolute error (MAE) and root-mean-square error (RMSE) of the ensemble mean forecasts of 2-m temperature ( T2), 2-m relative humidity (RH2), and 10-m wind speed (WIND10) from the 19 bias-corrected forecast datasets were computed against the GFS analysis on their corresponding dates. Figure 2 shows the MAE and RMSE of the ensemble mean T2 forecasts of the 19 datasets at different forecast lead times. It is shown that the MAE and RMSE decrease when the window length increases. The gain by increasing the window length is more prominent when the window length is less than eight days, and becomes trivial when the window length exceeds 16 days. The RH2 and WIND10 ensemble mean forecasts show very similar results (figure not shown). Therefore, in this study, a 16-day window was chosen as the optimal window length for RMB correction, resulting in 57 bias-corrected ensemble for-ecasts from 18 June to 18 August. Meanwhile, the RANK-PF also used a 16-day training window to sample the historical rank distribution
 | Figure 2 (a) Mean absolute error (MAE) and (b) root-mean-square error (RMSE) of bias-corrected 2-m temperature ensemble mean forecasts of different training window lengths at 30-h, 36-h, 42-h, and 48-h forecast times. |
to guarantee that it used the same calibrated period as the RMB-PF.
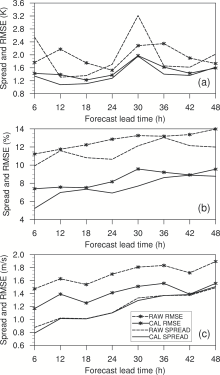
In an ideal ensemble forecast, the ensemble spread (standard deviation among ensemble members) should be comparable with the ensemble mean forecast error growth ( Talagrand et al., 1997; Hou et al., 2001). Figure 3 shows the domain-averaged ensemble spread and ensemble mean RMSE of T2, RH2, and WIND10 from the raw and bias- corrected ensembles averaged among the 57 case dates. For all three variables, the ensemble mean RMSE decree-ases after bias correction, and the bias-corrected ensemble spread moves closer to the bias-corrected ensemble mean RMSE compared to the distance between the raw spread and the raw ensemble mean RMSE. This means that the bias correction improves not only the accuracy of the ensemble mean forecasts but also the spread-error relationship. This is especially true in the T2 forecast, where the raw spread oscillates up (at 6 h, 30 h) and down (at 12-18 h, 36-42 h) around the ensemble mean RMSE. This oscillation pattern is removed relatively well in the bias- corr-ected ensemble forecasts. In RH2, both the ensemble spr-ead and the ensemble mean RMSE decrease prominently in value after the bias correction, but with no obv-ious cha-nge in the spread-error relationship pattern. In WIND10, the ensemble mean RMSE of the bias-corrected forecasts drops remarkably, and moves closer to the ensemble spr-ead, while the latter has no obvious change.
 | Figure 3 Ensemble spread and ensemble mean RMSE of (a) 2-m temperature, (b) 2-m relative humidity, and (c) 10-m wind speed. RAW stands for raw ensemble forecast, and CAL for running mean bias (RMB)-corrected ensemble forecast |
.
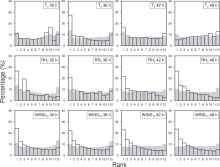
 | Figure 4 Rank histograms of 2-m temperature ( T2), 2-m relative humidity (RH2), and 10-m wind speed (WIND10) from 30 h to 48 h at every 6 h. The outlines are from the raw forecasts and the shaded histograms from the RMB-corrected forecasts. |
Figure 4 shows the rank histograms of the raw and bias- corrected ensemble forecasts of T2, RH2, and WIND10 from 30 h to 48 h at every 6 h, sampled from all the model grids and for all the cases dates. The rank histograms reveal an obvious bias in all the verified variables
in the raw ensemble. T2has a shifting bias from warmer at 36/42 h to colder at 30/48 h. The RH2 and WIND10 have consistent wet and strong bias, respectively, at all forecast lead times, and about 20% to 30% of the verification data fall on the left of the lowest forecast member. After bias correction, all the rank histograms show a symmetric histogram shape, indicating that the biases are removed reasonably well. However, all the variables still show a cer-tain under-dispersion with U-shaped histograms.
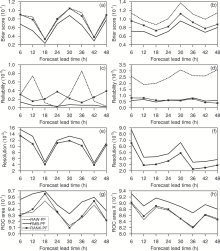
Two forecast events- T2 exceeding 25°C and WIND10 exceeding 5.5 m s-1-are defined to verify the RAW-PF, RMB-PF, and RANK-PF. The thresholds are selected as high as possible to represent rare events for T2 and WIND10, when there was a sufficient sample size for verification (5.5 m s-1, Beaufort scale 4, is the largest available threshold on the Beaufort scale). Figure 5 shows the Brier score, reliability, resolution, and relative operating characteristic (ROC) area of the three sets of PFs averaged among the 57 cases. The Brier score is a root-mean- square probabilistic error, and is negatively oriented with the perfect score at 0 and with a lower score being better, i.e., the lower the better. The Brier score can be further decomposed into three terms: reliability, resolution, and uncertainty. The reliability measures the difference between the forecast frequency and the observed frequency,
which is also the lower the better. The resolution measures the ability of the PF to resolve the events into different frequency subsets, which is the higher the better. The ROC area measures the ability of probabilistic forecast to
discriminate dichotomous events, which is the higher the better, with the perfect score at 1 (details about the verify-ication scores can be found in Wilks (1995), Hou et al. (2001), and Zhu et al. (2012)). In Fig. 5, the RMB-PF shows remarkable advantages towards the RAW-PF and the RANK-PF in almost all verifications, except the reliability for WIND10 in which the RMB-PF and RANK-PF ma-tch each other. The RMB-PF shows it can improve both reliability and resolution, while the RANK-PF only improves the reliability to a lesser extent. The advantage of the RMB-PF can probably be attributed to the removal of systematic bias in each ensemble member before the PF is computed. Checking the probabilistic forecast maps of RMB-PF and RANK-PF (figure not shown), it is noticed that the RANK-PF only calibrates the value of the forecasting probabilities on each grid point, but leaves the spatial distribution pattern almost unchanged compared to the RAW-PF, which is consistent with its inability to affect the resolution. The RMB-PF yields more realistic
 | Figure 5 (a) Brier score, (c) reliability, (e) resolution, (g) relative operating characteristic (ROC) area of RAW-PF, RMB-PF, and RANK-PF for 2-m temperature exceeding 25°C; and (b) Brier score, (d) reliability, (f) resolution, (h) ROC area for 10-m wind speed exceeding 5.5 m s-1. Brier score and ROC area are scaled by 10, while reliability and resolution are scaled by 102. |
spatial patterns of forecasting probabilities, demonstrating the advantage of removing the systematic errors from the ensemble. However, 25°C is too high a threshold to a certain extent for most parts of northern China at night, and it is easier for the model to give correct "no" forecasts. Therefore, all three PFs show better performance at around 18 h and 42 h (02:00 local standard time) compared to other forecast times, and bias corrections show fewer effects.
In this study, an RMB-correction approach was applied to the near-surface variable forecasts of IAP-REFS for the 2010 summer season, to evaluate the feasibility and effectiveness of the approach for SREF in the northern China region. Meanwhile, two PF calibration methods for near- surface variables were evaluated under a common condition through this seasonal experiment.
The effect of different window lengths (from 2 to 20 days) for calculating the RMB were first evaluated. It was found that the MAE and RMSE of the ensemble mean forecasts decrease as the window length increases. The improvement by further extending the window length be-yond 16 days becomes minor; therefore, 16 days was sel-ected as the optimal window length for the SREF system.
The raw and 16-day RMB-corrected forecasts of IAP- REFS were evaluated through 57 case dates, demonstrating that the RMB correction not only reduces the forecast error of the ensemble mean forecasts, but also produces a better ensemble spread-error relationship, and can prod-uce an unbiased ensemble in terms of the rank histogram.
The verification of the RAW-PF, RMB-PF, and RANK- PF revealed that the RMB correction can improve both the reliability and resolution of the near-surface variable PFs, and it outperforms the rank calibration which can only improve the reliability to a lesser extent. The results also indicate that the systematic errors contaminate the PF, and should be removed at as early a stage as possible.
The present study only comprised 57 summer season cases. More cases from more seasons should be included in future work to provide a full evaluation of the RMB correction in SREF near-surface variables in the northern China region. In particular, the method should be evaluated for cases undergoing regime transitions, such as a cold front, severe storm, or even a tropical cyclone, in which the systematic bias changes rapidly and challenges the robustness of the RMB method. Moreover, since the RMB-corrected ensemble still has a U-shape rank histogram, applying a rank calibration after the RMB correction may further improve the reliability of the ensemble PF, and a hybrid calibration approach consisting of RMB cor-rection and rank calibration is worth studying in future work.
Acknowledgements. This research was supported by a project of the National Natural Science Foundation of China (Grant No. 41305099).
| 1 |
|
| 2 |
|
| 3 |
|
| 4 |
|
| 5 |
|
| 6 |
|
| 7 |
|
| 8 |
|
| 9 |
|
| 10 |
|
| 11 |
|
| 12 |
|
| 13 |
|
| 14 |
|