
Characteristics of Gaseous Pollutants at a Regional Background Station in Southern China
Cite this Article
CHAO Na, JI Dong-Sheng, CHEN Jia-Shan, XIN Jin-Yuan, HU Bo, WANG Yue-Si, WANG Hui, MENG Ze. Characteristics of Gaseous Pollutants at a Regional Background Station in Southern China. Atmospheric and Oceanic Science Letters, 2014, 7(4): 340-345 
Permissions
Copyright?2014, Editorial office of Atmospheric and Oceanic Science Letters
This is an Open Access article under the terms of CCAL.
Characteristics of Gaseous Pollutants at a Regional Background Station in Southern China
Abstract
Measurements of gaseous pollutants (O3, NO
Keyword:
gaseous pollutants; O3; NOx ; SO2; CO; backward trajectories
Received 28 January 2014; revised 26 February 2014; accepted 27 February 2014; published 16 July 2014
Citation: Chao, N., D.-S. Ji, J.-S. Chen, et al., 2014: Characteristics of gaseous pollutants at a regional background station in southern China, Atmos. Oceanic Sci. Lett., 7, 340-345, doi:10.3878/j.issn.1674-2834.14.0007.
1 Introduction
The Pearl River Delta (PRD) region is one of the regions of China that has developed most during the past few decades. With the rapid development of urban agglomerations, anthropogenic emissions of air pollutants have increased rapidly ( Lau et al., 2003; Wu et al., 2007; Zheng et al., 2009; Sun et al., 2010). The high levels of atmospheric pollutants have become an important factor affecting human health and have attracted much scientific attention ( Fujii et al., 2001; Kocifaj et al., 2006). O3, NO x, SO2, and CO are important reactive gases that not only have a direct adverse effect on human health and the ecological environment, but also an indirect effect by participating in chemical reactions that ultimately lead to similar adverse impacts. In recent years, many studies have been conducted to investigate air pollution in the PRD region ( Wang et al., 2003; Deng et al., 2008; Wu et al., 2012). However, these studies have mostly focused on urban areas; few have been conducted in background areas. Observations of atmospheric pollutants conducted in atmospheric background regions are an essential way to understand the influence of human activities on the atmospheric environment and climate changes ( Fischer et al., 2003; Jaffe and Ray, 2007; Yan et al., 2008).
In this study, we characterize the levels and variations of gases, and discuss the sources and factors affecting the concentrations of these gases, at Dinghushan (DHS) background station in the PRD region. This study provides important information on the sources and seasonal behavior of air pollutants in the background areas of the PRD.
2 Methods and instrumentation
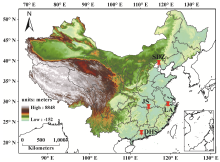
The DHS background station (23°10'N, 112°33'E; 100 m MSL) is situated in the Forest Ecosystem Research Station of DHS, Chinese Academy of Sciences, which is located in the mid-section of Guangdong Province in South China, 84 km away from Guangzhou (Fig. 1). It has a humid subtropical monsoon climate, characterized by an alternating rainy season (April to September) and dry season (October to the following March). The annual average temperature is 20.9°C and the annual relative humidity is 82%. There are no obvious atmospheric pollution sources around this site. Therefore, it is a suitable station to research background atmospheric pollutants in the PRD region.
The setup of the instruments, their precisions and detection limit, and calibration methods have been described in detail ( Ji et al., 2008). Briefly, O3 was measured with a UV photometric analyzer (model 49i, Thermo Fisher Scientific (TE), USA); CO was measured with a non- dispersive infrared analyzer (model 48i, TE); SO2 was
'> | Figure 1 Locations of the Dinghushan (DHS), Lin'an (LA), Shangdianzi (SDZ), and Jinsha (JS) regional background stations of China. |
measured with a pulsed-fluorescence analyzer (model 43i, TE); and NO-NO2-NO x was measured with a chemilu-minescence analyzer (model 42i, TE). The analyzers were calibrated daily by injecting a span gas mixture in scrubbed ambient air. The CO analyzer was zeroed every two hours using an internal catalytic converter.
3 Results and discussion
3.1 Observed levels and comparisons with data from other background sites
The statistics of the concentrations of trace gases at the DHS station are shown in Table 1. The annual mean O3, NO x, SO2, and CO concentrations were 24.6 ± 23.9, 12.8 ± 10.2, 4.0 ± 4.8, and 348 ± 185 ppbv, respectively. The results are comparable with those observed for the period from June 2006 to July 2007 at other regional background stations in China, whose locations are marked in Fig. 1. Table 1 shows that the annual O3 concentration at DHS is close to the values measured at the Jinsha (JS) station ( Lin et al., 2011), a background station in central China, but less than the concentration measured at the Lin'an (LA) station ( Xu et al., 2008) in the Yangtze River Delta (YRD) and the Shangdianzi (SDZ) station ( Lin et al., 2008) in the Beijing-Tianjin-Hebei region (BTH). The concentrations of NO x at the DHS, SDZ, and LA sites are at the same level, where the regions are well developed and the number of motor vehicles has increased rapidly. The SO2 concentration at DHS is close to the concentration measured at the JS site, and is much less than the concentration measured at the LA site. The CO concentration is lowest at the DHS site, compared to the other stations. Overall, the atmospheric pollution is moderate in the PRD region and central China, while it is heavier in the YRD and BTH regions. This spatial variation is in accordance with the volumes of regional emissions of air pollutants ( National Bureau of Stastics of the People's Republic of China, 2012).
| Table 1 Statistical results of the measured trace pollutants in comparison with other observation stations. DHS refers to Dinghushan station, JS refers to Jinsha station, LA refers to Lin'an station, SDZ refers to Shangdianzi station (units: ppbv). |
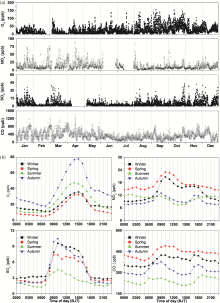
As shown in Fig. 2a, the levels of gaseous pollutants varied greatly from month to month. High values of O3 were observed in September and October, while low values were measured in February. Precipitation could evidently decrease while the temperature remained at a high level in October. This pattern of seasonal distribution reflects the contribution of the photochemical production of O3 caused by intensive solar radiation in the dry season. The SO2 showed a higher concentration in winter and spring, but a lower concentration in summer. This is attributable to seasonal fluctuations of the emissions and meteorology. The seasonal pattern of CO is consistent with that of NO x. The sharp increases of CO and NO x were mostly observed in the dry season. The elevated CO levels are attributed to the transport of regional pollution and also to more intense biomass burning activities in South China ( Deng et al., 2008). The reason for this is discussed in depth in section 3.4.
3.2 Diurnal variations
The average diurnal variations of O3, NO x, SO2, and CO at the DHS station are shown in Fig. 2b. The diurnal cycles of O3 showed minimum values in the early morn-
ing and maximum values in the afternoon. The large daily ranges of O3 indicate that the photochemical formation of O3 is significant, especially in the autumn. The largest daily range was measured in autumn and was 77.8 ppbv, followed by summer (47.5 ppbv), winter (35.9 ppbv), and spring (32.6 ppbv).
The diurnal variations of NO x and CO showed a double-peak pattern, with the primary and secondary peaks appearing near noon and sunset, respectively. The diurnal pattern of NO x at DHS is similar to that in urban areas. This pattern might be the result of a mixture of local
 | Figure 2 (a) Time series of air pollutants at the DHS station in 2013; (b) average diurnal variations of O3, NO x, SO2, and CO for the four seasons. BJT refers to "Beijing time". |
emission and regional transport from source areas during the day. The concentrations of NO x and CO in spring and winter were significantly higher than those in autumn and summer.
Figure 2b clearly shows that the SO2 concentration in the day stayed at high levels but decreased rapidly and reached its minimum at night. One reason for this might be the rapid removal of SO2 by wet vegetation cover as the night-time RH on the mountains is high even in the dry season. The other reason might be that the surface SO2 is strongly influenced by dynamic processes. The peak SO2 concentrations occurred when the boundary layer evolved. This indicated that the high SO2 concentrations can be exchanged to the ground, leading to the increase in SO2 concentrations.
3.3 Air mass backward trajectories and
corresponding pollutant concentrations
corresponding pollutant concentrations
To study the impact of transport on the air pollution, the backward trajectories terminating at the DHS site for
48-h intervals were calculated and clustered using the Hybrid Single Particle Lagrangian Integrated Trajectory (HYSPLIT) 4 model (http://www.arl.noaa.gov/ready/ hysplit4.html) ( Kim et al., 2005; Pongkiatkul and Kim Oanh, 2007), with start times of 0000, 0600, 1200, and 1800 UTC, respectively. The results are shown in Fig. 3. The emissions of NO x, SO2, and CO investigated by National Aeronautics and Space Administration (NASA) ( Zhang et al., 2009) are also shown in Fig. 3. Cluster 1 represents the air mass from north of the DHS station; cluster 2 comes from the PRD region; cluster 3 originates in the East China Sea or Taiwan passing over the PRD region; and clusters 4 and 5 are from the South China Sea. The statistics of the clusters for each month are shown in Table 2. Cluster 1 is the most important for the DHS site, contributing 38.1% for the whole year and being mainly distributed in the dry season. The trajectories in cluster 2 have the second highest frequency of occurrence. Clusters 4 and 5 are mainly distributed in the summer, contributing 13.2% and 7.2% for the whole year, respectively.
 | Figure 3 The results of the cluster analysis of backward trajectories, and the proportions of different clusters shown in the bottom-right of the figure. The background color represents the emissions of (a) NO x, (b) SO2, and (c) CO from the Intercontinental Chemical Transport Experiment-Phase B (INTEX-B) inventory (units: t yr-1). |
| Table 2 Monthly frequency occurrence of each type of air mass arriving at the DHS station in 2013. |
| Table 3 Statistics of average concentrations of gaseous pollutants for each type of air mass. |
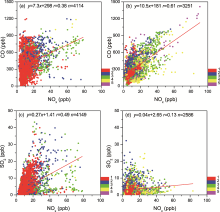
 | Figure 4 Correlation among CO ( y), SO2 ( y), and NO x ( x) for the (a, c) dry season and (b, d) rainy season. Different colors represent the different clusters ( P < 0.00001). |
Figures 4c and 4d show the correlation between SO2 and NO x for the dry season and rainy season. The fact that SO2 is significantly correlated with NO x in the dry season but far less so in the rainy season implies that SO2 and NO x were emitted from a common source in the dry season. During the dry season, the variations of the trace gases are driven mainly by emissions, regional transport, and chemical transformation; While in the rainy season, the wet scavenging process, mixing process, and regional emissions become the important factors driving variations of the trace gases. It is necessary to point out that the data points of SO2 and NO x tend to fall into two groups in the dry season: one with higher SO2/NO x ratios and one with lower SO2/NO x ratios. The high ratios are normally attributed to the emissions from fossil fuels, while the low ratios are characteristic of urban vehicle emissions. Using the analysis of the emission characteristics of the atmospheric pollutants in detail, it was found that the large degree of scattering in SO2 and NO x correlation plots can be attributed to the mixing of individual plumes from industrial areas of the PRD (high SO2/NO x ratios) and Hong Kong (low SO2/NO x ratios) ( Wang et al., 2003). In addition, the SO2/NO xand CO/NO x slopes are consistent with emission inventories developed by Zhang et al. (2009), in which the emissions of SO2/NO xand CO/NO x ratios were 1175/1493, 8693/1493 for Guangdong in 2006 (units: Gg yr-1).
4 Conclusions
Based on observations of O3, NO x, SO2, and CO at the DHS station, the characteristics of the main gaseous pollutants were obtained for the background areas of southern China. The concentrations of O3, NO x, SO2, and CO showed significant seasonal and diurnal variations. High values of O3 were observed in October, and high concentrations of NO x, SO2, and CO were measured in the whole of the dry season. The diurnal cycles of O3 showed minimum values in the early morning and maximum values in the afternoon. The diurnal variations of NO x and CO showed a double-peak pattern with one peak appearing near noon and the other appearing near sunset. The concentration of SO2 remained at high levels in the day, but decreased rapidly and reached its minimum value in the early morning. The levels of trace gases at DHS are close to those at the JS station, and less than those at the LA and SDZ stations. According to the backward trajectories, air masses from the PRD region are responsible for the high concentrations of the gaseous pollutants. The CO and NO x were emitted from a common source in the rainy season, while biomass burning played an important role at the DHS station in the dry season. High SO2/NO xratios are normally attributed to emissions from fossil fuels, while low ratios are characteristic of urban vehicle emissions. The results are in accordance with emissions inventories.
Acknowledgements. This work was supported by Strategic Priority Research Program of the Chinese Academy of Sciences (Grant No.
XDA05100100).
Reference
| 1 |
|
| 2 |
|
| 3 |
|
| 4 |
|
| 5 |
|
| 6 |
|
| 7 |
|
| 8 |
|
| 9 |
|
| 10 |
|
| 11 |
|
| 12 |
|
| 13 |
|
| 14 |
|
| 15 |
|
| 16 |
|
| 17 |
|
| 18 |
|
| 19 |
|
| 20 |
|