
Individual Variations of Winter Surface Air Temperature over Northwest and Northeast China and Their Respective Preceding Factors
Cite this Article
XIN Yu-Fei, LIU Ge, JIN Qi-Hua. Individual Variations of Winter Surface Air Temperature over Northwest and Northeast China and Their Respective Preceding Factors. Atmospheric and Oceanic Science Letters, 2014, 7(4): 346-351 
Permissions
Copyright?2014, Editorial office of Atmospheric and Oceanic Science Letters
This is an Open Access article under the terms of CCAL.
Individual Variations of Winter Surface Air Temperature over Northwest and Northeast China and Their Respective Preceding Factors
Abstract
Based on monthly mean surface air temperature (SAT) from 71 stations in northern China and NCEP/ NCAR and NOAA-CIRES (Cooperative Institute for Res-e-arch in Environmental Sciences) twentieth century rean-alysis data, the dominant modes of winter SAT over nor-thern China were explored. The results showed that there are two modes that account for a majority of the total var-iance over northern China. The first mode is unanimously colder (warmer) over the whole of northern China. The second mode is characterized by a dipole structure that is colder (warmer) over Northwest China (NWC) and war-mer (colder) over Northeast China (NEC), accounting for a fairly large proportion of the total variance. The two components constituting the second mode, the individual variations of winter SAT over NWC and NEC and their respective preceding factors, were further investigated. It was found that the autumn SAT anomalies are closely linked to persistent snow cover anomalies over Eurasia, showing the delayed effects on winter climate over northern China. Specifically, the previous autumn SAT anomalies over the Lake Baikal (LB; 50-60°N, 85-120°E) and Mongolian Plateau (MP; 42-52°N, 80-120°E) regions play an important role in adjusting the variations of winter SAT over NWC and NEC, respectively. The previous autumn SAT anomaly over the MP region may exert an influence on the winter SAT over NEC through modulating the strength and location of the East Asian major trough. The previous autumn SAT over the LB region may mod-ulate winter westerlies at the middle and high latitudes of Asia and accordingly affects the invasion of cold air and associated winter SAT over NWC.
Keyword:
winter temperature; Northwest China; Northeast China; climate forecast
Received 8 February 2014; revised 10 March 2014; accepted 1 April 2014; published 16 July 2014
Citation: Xin, Y.-F., G. Liu, and Q.-H. Jin, 2014: Individ-ual variations of winter surface air temperature over Nort-hwest and Northeast China and their respective preceding factors, Atmos. Oceanic Sci. Lett., 7, 346-351, doi:10.3878/j.issn.1674-2834.14.0010.
1 Introduction
The variability of the East Asian winter monsoon (EAWM) and associated anomalous temperature in winter have always been of concern and extensively studied. Many scholars have explored the influential factors and related mechanisms for the variation of the EAWM and winter climate anomalies ( Tao and Zhang, 1998; Chen and Sun, 1999a, b; Ju et al., 2004; Chen and Kang, 2006; Li and Bates, 2007; Li et al., 2009; Liu et al., 2010; Peng and Bueh, 2012).
EAWM-related atmospheric activities often lead to wide-range cold anomalies over mainland China. Accord-ingly, a pattern with consistent warming (cooling) dominates mainland China, especially eastern China, and should therefore be considered as the first leading mode of the winter surface air temperature (SAT) ( Zhu et al., 2007). This mode has been proved to be closely related to the variation of the EAWM strength, and its associated influential factors and preceding signals have also been extensively discussed in previous studies ( Ding, 1990; Chen et al., 2002; Wang et al., 2010; Liu et al., 2010, 2013; He and Wang, 2012). Sometimes there is a second mode, char-acterized by a north-south dipole structure of winter SAT over eastern China, which has also been of concern in recent years. For example, it was argued that the dipole mode is highly correlated with the Arctic Oscillation on interannual scales ( Chen and Kang, 2006; Kang et al., 2009). Yang and Wu (2013) also found that the second mode of winter SAT shows a north-south dipole structure, and they documented that the interdecadal shift of the second mode may be related to changes in the North Atl-antic SST and the Arctic sea ice concentration. Also, the influential factors and preceding signals for the second mode have been further investigated with respect to the stratospheric atmosphere ( Chen et al., 2013), as well as sea ice and snow cover and related SATs ( Sun et al., 2014).
In addition to the north-south dipole structure over eas-tern China, an east-west structure of winter SAT someti-mes exists over northern China. For example, Northwest China (NWC) experienced a warmer winter, while Nort-heast China (NEC) experienced a cooler winter in 2009/2010 ( Zhang et al., 2013). Is the east-west pattern a dominant mode over northern China? If so, are the respective pre-ceding factors and related influential mechanisms for the individual east and west components in this mode diff-erent from each other? Especially for the winter SAT over NWC, the typical EAWM, which prevails over eastern China, may not play a governing role. Thus, it is nece-ssary to investigate which atmospheric circulation syst-ems are related to the anomalous SAT over NWC and what its preceding factors are. In the present paper, the dominant modes of winter SAT over northern China are examined, and the individual variations of winter SAT over NWC and NEC and their respective preceding factors are investigated.
2 Data and methods
The data used in this study include: the monthly mean SAT data from 160 stations (we used 71 stations) in China during 1981-2012, which were downloaded from the National Climate Center, China Meteorological Administration; the monthly mean geopotential height, air temperature, and U- and V-wind data obtained from the National Centers for Environmental Prediction (NCEP) reanalysis dataset ( Kalnay et al., 1996); and the twentieth century reanalysis monthly percentage of snow coverage at 192 × 94 Gaussian grids obtained from the National Oceanic and Atmospheric Administration-Cooperative Institute for Research in Environmental Sciences (NOAA-CIRES) Climate Diagnostics Center, Boulder, Colorado ( Compo et al., 2011). In this study, winter indicates the period from December to the following February. For example, the 1981 winter is the period from December 1981 to February 1982.
To discuss the individual variations of SAT over different regions and their respective influential factors, the partial correlation method was used. For the detailed calculation of partial correlation, see Zar (1998) and Wu and Kirtman (2007). Other methods used in this paper include empirical orthogonal function (EOF), correlation, and regression analyses.
3 Results
3.1 Individual variations of SATs over Northwest and Northeast China
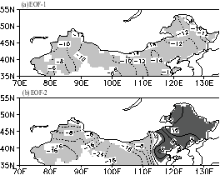
Winter temperatures show clear increasing trends over most parts of China, although the amplitudes of the increasing trends vary between regions ( Li et al., 2010; Zhou et al., 2011). To explore the interannual variation of winter SAT over northern China, the linear trends at 71 stations in northern China (to the north of 35°N) were removed, and then an EOF analysis for the detrended winter SAT during 1981-2012 was performed (Fig. 1). According to North et al. (1982), the first two leading modes are well distinguished from each other and from the rest of the EOFs in terms of the sampling error bars. Thus, the first two EOF modes are both statistically significant modes.
The first EOF mode (EOF-1) accounts for approximately 59% of the total variance and reflects a pattern of uniform winter warming (cooling) over northern China (Fig. 1a). Actually, the time series of the EOF-1 pattern over northern China is closely related to that over the whole of China with a high correlation coefficient of 0.90 (at the 99.9% confidence level; not shown). The consistent variation of winter SAT over the whole of China is due to the strengthening (weakening) of the EASM ( Zhu et al., 2007; Liu et al., 2013; Sun et al., 2014). The EOF-1 pattern over northern China belongs to this situation, and thus it can be modulated primarily by the variation of the EAWM strength. As such, consistent winter SAT anomalies over northern China may be effectively forecasted through predicting the EAWM strength.
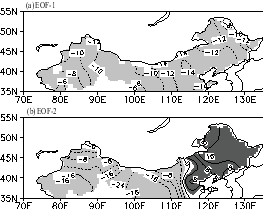 | Figure 1 (a) The first empirical orthogonal function (EOF) mode (EOF-1) (×0.01) and (b) the second EOF mode (EOF-2) (×0.01) of normalized winter surface air temperature over northern China, in which positive (negative) values greater (smaller) than 2 (-2) are shaded. |
In contrast, the second EOF mode (EOF-2) indicates a pattern with opposite winter SAT variations between NWC and NEC, and it also explains a fairly large proportion (approximately 19%) of the total variance (Fig. 1b). The results imply that inconsistent and even opposite variations can often occur over northern China. In some cases, winter SAT anomalies over northern China cannot be predicted as a whole. Therefore, it is necessary to separately investigate the SAT variation over NWC and that over NEC.
The second mode of winter SAT over the whole of China (not shown) indicates that a part of NWC (Xinjiang) does not show an opposite SAT variation relative to NEC ( Fig. 3b in Zhu et al., 2007; Fig. 2a in Kang et al., 2009). In other words, our EOF-2 can better reflect the large-area opposite-variation pattern over northern China compared to that for the whole of China.
3.2 Respective preceding factors for SAT over Nort-hwest and Northeast China
According to the loading of the second mode (Fig. 1b), the station-averaged winter SAT over the NWC (35-45°N, 73-114°E) and NEC (35-55°N, 115-135°E) regions were defined as the TNWC and TNEC indices. To explain the preceding factors for individual variations of the TNWC and TNEC against the background of the EOF-2 pattern, the partial correlation of the previous autumn SAT over Asia with the winter TNWC (TNEC) index after removing the winter TNEC (TNWC) index was calculated (Fig. 2). For the individual variation of the TNWC, a significantly negative correlation appears over the Lake Baikal (LB) region. This indicates that, corresponding to the war-mer (colder) conditions over the LB region during the pre-vious autumn, NWC tends to experience a colder (war-mer) winter (Fig. 2a). For the individual variation of the TNEC, a significantly positive correlation appears over the Mongolian Plateau (MP) region. This result shows that, corresponding to the warmer (colder) conditions over the MP region during the previous autumn, NEC tends to experience a warmer (colder) winter (Fig. 2b).
Based on Figs. 2a and 2b, the regionally averaged SAT
 | Figure 2 (a) Partial correlation of previous autumn surface air temperature with the winter TNWC index after removing the winter TNEC index; (b) the same as (a), except for the winter TNEC index after removing the winter TNWC index; (c) correlation of winter surface air temperature with the previous autumn TLB index; (d) the same as (c), except for the previous autumn TMP index. The shaded areas denote correlation at the 95% confidence level. |
over the LB (50-60°N, 85-120°E) and MP (42-52°N, 80-120°E) regions are referred to as the TLB and TMP indices. The correlation of the winter SAT over northern China with the previous autumn TLB index shows significantly negative values appearing over NWC and positive but not significant values existing over NEC (Fig. 2c), while the correlation of that with the previous autumn TMP index displays significantly positive values emerging over NEC and negative but not significant values appearing over NWC (Fig. 2d). Figures 2c and 2d further show that the autumn TLB (TMP) index can reflect well the individual variation of the winter SAT over NWC (NEC).
It is well known that anomalous signals in the atmosphere have a much shorter persistence than those in land and sea. The effects of the previous autumn TLB and TMP on the winter SAT over NWC and NEC may be attributable to the fact that the TLB and TMP are closely linked to snow cover anomalies over Asia. The autumn TLB is significantly correlated with snow cover in the LB and its adjacent regions, whereas the autumn TMP is significantly correlated with snow cover in northern China (not shown). Thus, the autumn TLB and TMP can to some extent reflect persistent snow cover anomalies and therefore may exert delayed impacts on the Asian climate during the following winter.
3.3 Influential processes of the previous autumn TLB and TMP
Sun et al. (2014) argued that the autumn SAT anomaly over the mid-latitude region of East Asia (41-55°N, 85- 124°E) is an important preceding factor for a north-south opposite pattern of winter temperature over East China, and especially it can indicate winter temperature well over North and Northeast China. Although the definition region for the TMP index is slightly different from that cho-sen by Sun et al. (2014), the former can also indicate the winter SAT over NEC, which is generally consistent with the previous result ( Sun et al., 2014).
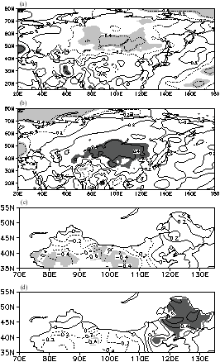
The winter 500-hPa geopotential height anomaly regressed by the previous autumn TMP index (Fig. 3b) shows that there is a significantly positive anomaly over the LB region, which is closely related to the variation of the strength and location of the East Asian major trough. This is in good agreement with the result of Sun et al. (2014), who showed that the strength and location of the East Asian major trough plays a crucial role in modulating winter temperature over NEC. In the present paper, the influential processes of the previous autumn TLB on the winter SAT over NWC, rather than those of the previous autumn TMP on the winter SAT over NEC (generally demonstrated by Sun et al. (2014)), are mainly discussed.
The winter 500-hPa geopotential height anomaly regressed by the previous autumn TLB index (Fig. 3a) shows that a significantly positive anomaly is located to the north of LB, slightly farther north than that in Fig. 3b. Moreover, a significantly negative anomaly appears over the west of the Tibetan Plateau (Fig. 3a), which is clearly different from that regressed by the TMP index (Fig. 3b). Accompanied by the significantly positive and negative anomalies of geopotential height in Fig. 3a, significant easterly flows prevail between LB and the Caspian Sea in the high-level (200 hPa) troposphere (Fig. 3c) and to the northeast of the Tibetan Plateau at the surface level (Fig. 3e). The results imply that, corresponding to a higher (lower) autumn TLB index, the winter westerlies at the high and surface levels of the troposphere seem to be weakened (strengthened). Nevertheless, there is no significantly negative anomaly of geopotential height appearing over the west of the Tibetan Plateau (Fig. 3b), accordingly, no significantly anomalous easterly (Figs. 3d and 3f). This result signifies that the autumn TMP anomaly may not be responsible for the variation of the winter westerlies at the high and surface levels of the troposphere.
The strengthened westerlies may obstruct cold air breaking out southward from high latitudes, leading to positive SAT anomalies over East Asia ( Wu et al., 2011). To investigate whether the westerly anomalies related to the autumn TLB may significantly affect the invasion of cold air, the correlations of winter SAT over northern China with the simultaneous 200-hPa U-component regionally averaged over the region (47-54°N, 55-100°E) and with the surface U-component regionally averaged
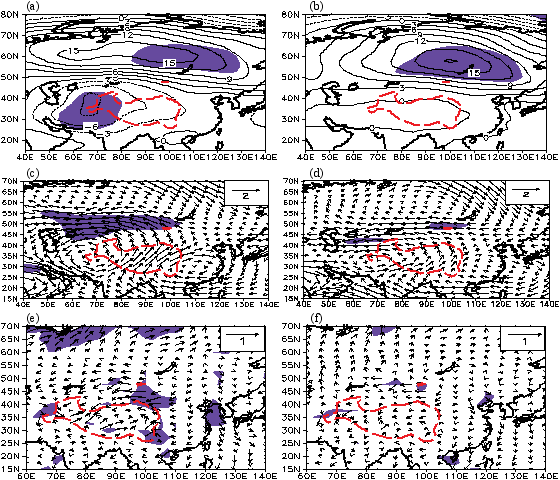 | Figure 3 Anomalies of (a) winter 500-hPa geopotential height (gpm), (c) 200-hPa winds (m s-1), and (e) surface winds (m s-1) regressed by the previous autumn TLB index; (b), (d), and (f) the same as (a), (b), and (c), except for the regressions on the previous autumn TMP index. Shading denotes that the regressed coefficients of geopotential height or wind speed are at the 95% confidence level. |
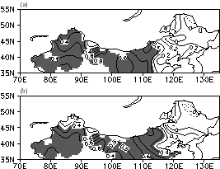
over the region (40-45°N, 90-110°E) were performed (Fig. 4). The averaged regions for U-components at the 200-hPa and surface levels were chosen based on Figs. 3c and 3e. Figure 4 shows that significantly positive correlations appear over NWC, which signify that the westerly
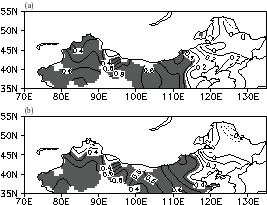 | Figure 4 (a) Correlation of winter surface air temperature with the simultaneous 200-hPa U-component averaged over the region (47-54°N, 55-100°E); (b) the same as (a), except for the simultaneous surface U-component averaged over the region (40-45°N, 90-110°E). The shaded areas denote correlation at the 95% confidence level. |
anomalies related to the autumn TLB may significantly affect the invasion of cold air and accordingly regulate the winter SAT over NWC.
In summary, the variations of the previous autumn TLB may result in circulation anomalies (e.g., anomalous westerlies over Asia) during the subsequent winter. More-over, the TLB-related westerly variation is closely linked to the winter SAT over NWC. The low autumn TLB may lead to stronger winter westerlies which restrain the invasion of cold air into NWC, while the high autumn TLB may give rise to weaker winter westerlies, which are cond-ucive to the invasion of cold air into NWC.
4 Summary and discussion
In this paper, the spatial characteristics of the interannual variation of winter SAT over northern China were studied. The results showed that, besides consistent winter warming (cooling) over northern China, inconsistent and even opposite SAT variations between NWC and NEC also often appear. In this situation, the individual variations of winter SAT over NWC and NEC should be separately discussed.
It was found that the autumn TLB and TMP indices, which are closely linked to persistent snow cover anomalies in different region of Asia, can reflect well the individual variations of the winter SAT over NWC and NEC.
The autumn TMP may exert a considerable influence on the winter SAT over NEC through modulating the stre-ngth and location of the East Asian major trough, which supports the result of Sun et al. (2014). The previous autumn TLB may modulate the Asian high- and low-level westerlies, which affect the invasion of cold air, and eventually result in an anomalous winter SAT over NWC.
The correlation between the time series of the EOF-2 pattern and the previous autumn SAT (not shown) shows a significantly negative region over LB (similar to Fig. 2a). In turn, the variation of the autumn SAT in this LB region is only significantly correlated with the winter SAT over NWC, rather than that over NEC (not shown), which is also similar to Fig. 2c. In other words, this preceding factor cannot reflect well the entire EOF-2 pattern. Therefore, it seems to be inappropriate to use this preceding factor to predict the variation of EOF-2 as a whole. Our results suggest that, for different regions, circulation systems modulating the winter SAT are possibly different from each other, and their preceding influential factors may also be different. It is sometimes incorrect to use the same method to predict the winter SAT over NWC and that over eastern China.
In this work we discussed the effects of the previous autumn SAT over the LB and MP regions (certainly, they are linked to snow cover anomalies). In fact, there are many other factors influencing the variation of winter SAT over different areas, such as soil conditions, SSTs, and sea ice ( Zhang et al., 1996; Walland and Simmonds, 1997; Wang et al., 2000; Gong et al., 2001; Liu et al., 2012). For example, in addition to the previous autumn SAT over Asia, the previous autumn sea ice concentration anomaly in the Arctic Ocean is closely related to the winter SAT over NEC and North China ( Sun et al., 2014). Whether the individual variations of winter SAT over NWC and NEC are affected by other forcing factors and what their influencing mechanisms are remains unclear and should be studied in the future.
Acknowledgments. We acknowledge the support of the National Natural Science Foundation of China (Grant Nos. 41375090 and 41375089) and the Basic Research Fund of the Chinese Academy of Meteorological Sciences (Grant No. 2013Z002).
Reference
| 1 |
|
| 2 |
|
| 3 |
|
| 4 |
|
| 5 |
|
| 6 |
|
| 7 |
|
| 8 |
|
| 9 |
|
| 10 |
|
| 11 |
|
| 12 |
|
| 13 |
|
| 14 |
|
| 15 |
|
| 16 |
|
| 17 |
|
| 18 |
|
| 19 |
|
| 20 |
|
| 21 |
|
| 22 |
|
| 23 |
|
| 24 |
|
| 25 |
|
| 26 |
|
| 27 |
|
| 28 |
|
| 29 |
|
| 30 |
|
| 31 |
|
| 32 |
|
| 33 |
|