A Theoretical Explanation of Anomalous Atmospheric Circulation Associated with ENSO Modoki during Boreal Winter

A Theoretical Explanation of Anomalous Atmospheric Circulation Associated with ENSO Modoki during Boreal Winter |
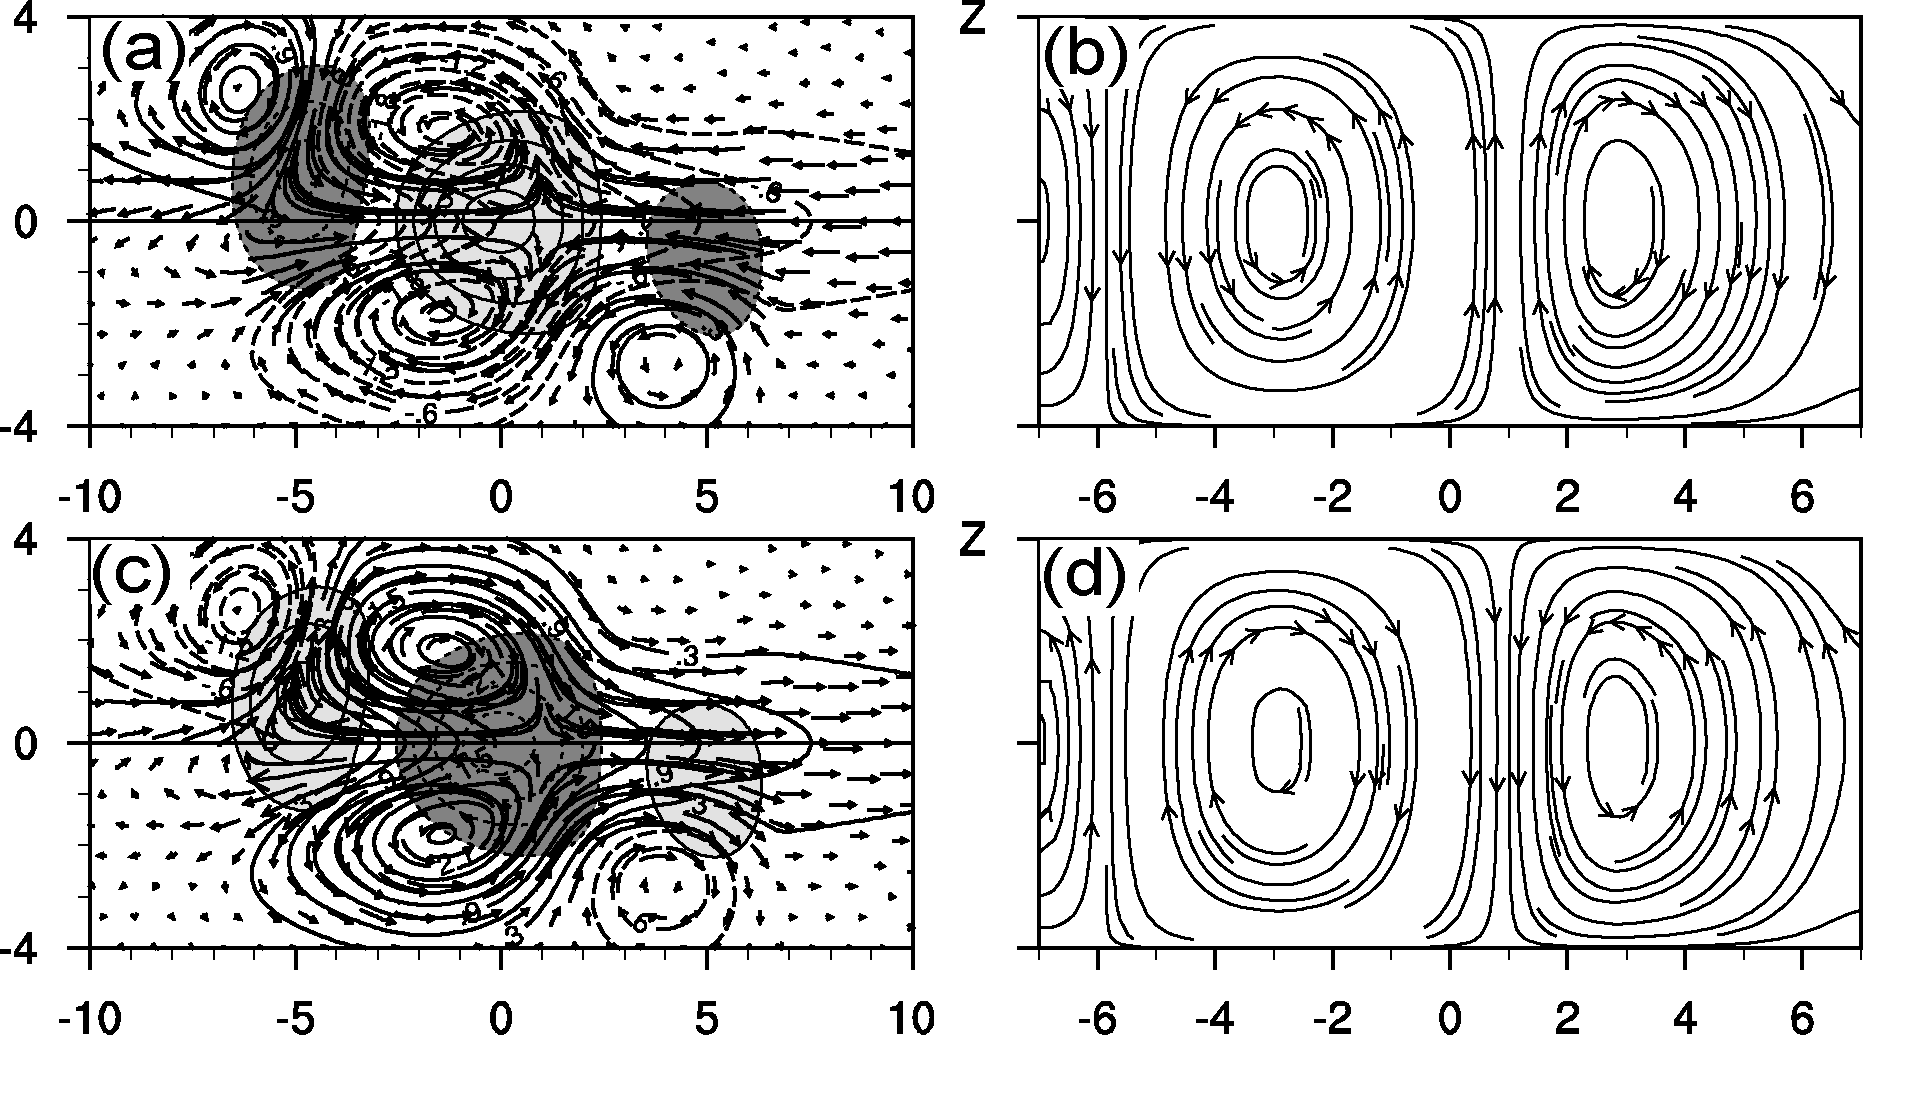
| Figure 3 Low-level horizontal wind arrows, vertical velocity shading, and pressure thick contours solutions a, c and meridionally averaged -1 to 1 stream function contours b, d corresponding to the ideal triple forcing sources in Fig. 2. The thin solid lines represent ascending flows in light shading, while the thin dashed lines represent descending flows in dark shading. The thick solid and dashed lines represent positive and negative pressures, respectively. The contour interval is 0.3 in a and c. The contour line of zero is omitted. |
 |