Comparisons of Two Cloud-Detection Schemes for Infrared Radiance
Observations
Observations
|
|


The cloud-detection procedure developed by McNally and Watts (MW03) was added to the Weather Research and Forecasting Data Assimilation System. To provide some guidelines for setting up cloud-detection schemes, this study compares the MW03 scheme to the Multivariate and Minimum Residual (MMR) scheme for both simulated and real Advanced Infrared Sounder (AIRS) radiances. Results show that there is a high level of consistency between the results from simulated and real AIRS data. As expected, both cloud-detection sch-emes perform well in finding the cloud-contaminated channels based on the channels' peak levels. The cloud- detection results from MW03 are sensitive to the prescribed brightness temperature innovation threshold and brightness temperature gradient threshold. When increasing the brightness temperature innovation threshold for MW03 to roughly eight times the default threshold, the two cloud-detection schemes produce consistent data rejection distributions overall for high channels. MMR generally retains more data for long-wave channels. For both cloud-detection schemes, there is a high level of consistency between the cloud-free pixels and the visible/near-IR (Vis/NIR) cloud mask.
Received 19 February 2014; revised 4 April 2014; accepted 4 April 2014; published 16 July 2014
Citation: Xu, D.-M., X.-Y. Huang, Z.-Q. Liu, et al., 2014: Comparisons of Two cloud-detection schemes for infrared radiance observations, A t mos. Oceanic Sci. Lett., 7, 358-363, doi:10.3878/j.issn.1674-2834.14.0016.
Cloud detection, as part of quality control procedures to reject cloud-affected radiances, is crucial for proper assimilation of clear radiances measured by high-spectral- resolution infrared (IR) sounders ( McNally, 2002). There are two classes of cloud-detection schemes. One class inc-ludes schemes that use information from imagers (e.g., the Moderate Resolution Imaging Spectroradiometer (MODIS), the Advanced Very High Resolution Radiometer (AVHRR), and the Advanced Infrared Sounder/Visible and Near IR (AIRS/VisNIR) instrument) in the vis-ible and near infrared channels to exploit the potentially cloud-affected IR observations ( Saunders, 1988; Ackerman et al., 1998). Th-ese schemes require simultaneous ava-ilability of two sou-rces of independent data and have a high computational
cost. The schemes in the other class seek to detect clouds by comparing the measured radiance and the equivalent clear-sky radiance ( Eyre and Menzel, 1989; Smith and Richard, 1990; Huang et al., 2004; Li et al., 2004). Detecting channels unaffected by cloud according to their peak levels allows a much better use of available data and avoids discarding potentially useful information. McNally and Watts (2003) developed a clo-ud-detection scheme (MW03) by isolating the cloud signal in the vertically ranked departure vector, which is used operationally in the European Centre for Medium-Range Weather Forecasts (ECMWF) and the French glo-bal model Action de Recherche Petite Echelle Grande Echelle (ARPEGE), as well as in other research ( Guidard et al., 2011; Xu et al., 2013). The MW03 cloud-detection scheme is widely used because of its computational efficiency and algorithmic simplicity. All the inputs for the MW03 cloud-detection algorithm are efficiently provided by the radiative transfer models as part of the clear-sky calculation and the assimilation procedure. The Multivariate and Minimum Res-idual (MMR) scheme uses a different approach ( Auligné, 2007, 2014a, b; Xu et al., 2014), which identifies the channels that are affected by cloud by simulating the variation in the cloudy radiance to fit the observations. Different from the traditional IR cloud-detection schemes that discard the whole pixel when cloud is present, both the MW03 and MMR schemes try to identify cloud-free channels by identifying the signals of cloud height, rather than cloud masks, thereby retaining as much information as possible from radiance observations.
The MW03 codes developed by ECMWF are incorporated into the WRF Data Assimilation (WRFDA) ( Barker et al., 2004, 2012) system and used to explore the difference between the two cloud-detection schemes in identifying cloud-free channels. This research aims to provide some guidelines for setting up cloud-detection schemes before data assimilation. The remainder of the paper is structured as follows. In section 2, a brief introduction to the two methods for detecting cloud is provided. Section 3 presents results comparing the MMR and MW03 schemes for simulated cloudy radiance. Real observation experiments and results are presented in section 4, before conclusions are drawn in section 5.
The MW03 algorithm takes the clear-sky first-guess departures (the difference between the observed and the simulated radiance from the clear-sky atmospheric state) as input. Channels are first reordered according to their peak levels, with the highest channels first and the channels closest to the surface last. The peak level, c_k, for each channel (with wavenumber v) is determined as the first level from the surface to the top, at which the relative effect of an opaque black cloud to the total clear radiance is larger than 1%, i.e.,
| , (1) |
where
(a) |departure( i)| (b) |departure( i-1) - departure( i+1)| (c) |departure( i-Interval)- departure( i+Interval)|< Grad_ Threshold, where i is the index of the ranked channel and Interval is the number of channels over which the gradient calculation is made. Channels with high peak levels (near or above the model top) are also removed.
The MMR ( Auligné, 2007) scheme retrieves the cloud fraction, N k, at the model level, k, by minimizing a cost function,
| , (2) |
where
| , (3) |
with
where
Channels can be flagged as cloudy when the relative difference between simulated clear radiance and cloudy radiance is larger than a threshold value (0.01 in this study), as formulated in Eq. (4).
All the cloud detection and other radiance quality control procedures are within the framework of WRFDA. The Community Radiative Transfer Model (CRTM) ( Han et al., 2006; Liu and Weng, 2006) built into WRFDA is used as the radiance forward operator for computing simulated radiance from the model. In this study, we apply a subset of 281 channels pre-selected by the National Centers for Environmental Prediction (NCEP) from all 2378 channels.
The Observing System Simulation Experiment (OSSE) method is regarded as an efficient way to test new data assimilation techniques ( Huang et al., 2013; Wang et al., 2013). Since cloud detection is a pre-processing step of IR sounder assimilation, cloud-detection schemes are first evaluated by the OSSE. The AIRS ( Aumann et al., 2003) is one of the most advanced sensors, the radiances of which are often used to test cloud-detection schemes ( McNally and Watts, 2003; Auligné, 2007). Following those studies, this study first compares the MW03 scheme and the MMR scheme based on simulated AIRS radiances.
Simulated cloud-contaminated AIRS radiances,
100 × 100 horizontal grid and 40 vertical levels with the model top at 30 hPa. Usually, the thresholds of the MW03 cloud-detection algorithm are empirically determined in default settings. We choose three different thresholds in the MW03 scheme, as listed in Table 1, for comparison. Experiments denoted as P4 have larger thresholds than those of P2. The default thresholds are set to smaller values than P2 and P4. The
A parallel procedure for clear-sky simulated radiance,
Figure 1 shows the used-data counts after cloud-det-ection procedures with different configurations. The first model level corresponds to the model top, while level 40 refers to the surface. The peak level, c_
| Table 1 Configurations for the MW03 threshold sensitivity tests, where P2 standing for paremeters with BT_Threshold=2 and P4 for BT_Threshold=4. |
| Figure 1 Data counts (×1000) of cloud-clear data from the MMR scheme (black curve) and MW03 scheme with different thresholds (see Table 1). Peak levels, c_k, in Eq. (3) for selected channels are also shown (black dashed line). |
Whether or not a particular channel for a particular pixel is cloud-free is determined by comparing
To further evaluate the two cloud-detection schemes for more complicated cases, the schemes are applied to real AIRS data onboard Aqua. We perform one-month cloud- detection experiments using MW03 and MMR from 1800 UTC 20 July 2010 to 1800 UTC 20 August 2010 with a 60-km thinning mesh for AIRS data. The domain for the experiments has a 36-km grid spacing on a 330 × 200 horizontal grid and 43 vertical levels with the model top at 30 hPa.
Figure 3 shows the monthly-averaged used-data counts after cloud-detection procedures with different configurations.
| Figure 2 The percentage of pixels wrongly flagged (a) clear and (b) cloudy for each channel. |
| Figure 3 Month-averaged data counts (×1000) of cloud-clear data from the MMR scheme (black curve) and MW03 scheme with different thresholds (see Table 1). Peak levels, c_k, in Eq. (3) for selected channels are also shown (black dashed line). |
There is a high level of consistency between the results from real AIRS data and those from the simulated data. As expected, both cloud-detection schemes have good performances in finding the cloud-contaminated channels based on the channels' peak levels. The cloud-detection schemes reject more pixels for the lower-peaking channels than for the higher-peaking channels.
In general, MMR and MW03-P4 retain comparable clear data for most channels and MMR retains fewer data for short-wave channels than MW03 does. One possible explanation is that for the real case, MMR easily interprets the mix of multiple error sources (such as, the system bias in radiative transfer models and the solar contamination for short channels) as cloud signals are compared for the ideal simulation case. P2 can reject more data than P4, especially for channels with high peak levels. The MW03 scheme using small threshold values results in conservative observations.
Figure 4 shows the time series of the rejection rates (the rejected pixel numbers over the total pixel numbers) for two different channels. We did not adopt the MW03 scheme with default thresholds for further comparison because there were too few data left. Here, we choose channel 1776 corresponding to 6.48 μm (the top panel) to represent the higher channels (peak level of ~ 200 hPa) and channel 950 corresponding to 10.37 μm (the bottom panel) for lower channels (peak level of ~ 850 hPa). All cloud-detection schemes reject more pixels for the lower channel (Fig. 4b) than for the higher channel (Fig. 4a). For the lower channel 950 (10.37 µm), MMR rejects more pixels than MW03 and P4 retains a few more pixels than P2. For the higher channel 1776 (6.48 µm), P2 rejects many more pixels than both P4 and MMR, which is consistent with the results in Figs. 2 and 3.
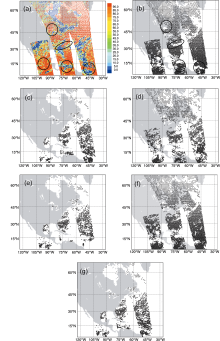
The AIRS instrument also includes four visible/near-IR (Vis/NIR) channels between 0.40 and 0.94 µm with a footprint of 2.3 km at nadir, sharing the scan mirror with the IR channels. The primary function of the Vis/NIR channels is the diagnostics of cloud in the IR field of view (13.5 km footprint at nadir), which is used in this study to evaluate the performance of the two cloud-detection sch-emes. Figure 5a shows the distribution of cloud amount
| Figure 4 Rejection rates from the MMR scheme and MW03 scheme for (a) channel 1776 (6.48 μm) and (b) channel 950 (10.37 μm). |
from the Vis/NIR channels (Fig. 5a). Figures 5b-g show the cloud-free radiances detected from MMR (two top panels), MW03-P2 (two middle panels), and MW03-P4 (two bottom panels) at 1800 UTC 20 July 2010. The three left panels (Figs. 5b, 5d, and 5f) correspond to the cloud- detection results for the higher channel 1776 (6.48 µm), while the right panels (Figs. 5c, 5e, and 5g) are for the lower channel 950 (10.37 µm). In general, the cloud-free radiance distributions from all cloud-detection schemes are in good agreement with the cloud masks in Fig. 5a for both channels (for example, the regions in the black circles). Fewer pixels are clear for the lower channel 950 (10.37 µm) than for the higher channel 1776 (6.48 µm). To conclude, both cloud-detection schemes reasonably identify channels as clear or cloudy according to their peak levels. Generally, P4 obtains similar results to the MMR scheme.
The MW03 cloud-detection scheme codes developed by ECMWF for high-spectral-resolution IR sounders are incorporated into the WRFDA system in this study. The default values for the two thresholds in MW03 to search cloud signals are set quite small in ECMWF to reduce the possibility of cloud-contaminated radiances. This study provides some guidelines for setting up MW03 by comparing its results with those from MMR for AIRS data.
There is high consistency between the results from real AIRS data and those from the simulated data. Both cloud-detection schemes agree closely in the distribution patterns of clear pixels based on the channels' peak levels. The cloud-detection results from MW03 are sensitive to the prescribed brightness temperature innovation threshold and the brightness temperature gradient threshold, especially for higher channels. Smaller thresholds lead to
 | Figure 5 (a) The distribution of cloud amount (color points) from AIRS Vis/NIR channels and distributions of cloud-free pixels left after cloud detections (black dots): (b) channel 1776 from MMR; (c) channel 950 from MMR; (d) channel 1776 from P2; (e) channel 950 from P2; (f) channel 1776 from P4; and (g) channel 950 from P4. |
a cloud signal detected at a higher altitude, thereby rejec-ting more data. In general, MMR and the MW03 scheme, with empirically determined parameters (MW03-P4 in Table 1), can yield comparable results. For real AIRS data, it is found that results from both schemes are generally in better agreement with the visible/near-IR data.
Further work is planned on adopting adaptive thresholds through offline statistics generated over some spin- up periods for the MW03 scheme. More numerical experiments on comparing the two cloud-detection schemes will also be further investigated in the framework of data assimilation and weather forecasting. Other applications based on the MMR cloud-detection algorithm in terms of the cloud fractions retrieval technique is another interesting aspect in future work.
Acknowledgments. This work was jointly sponsored by the National Basic Research Program of China (973 Program, 2013CB-430102) and the Program of Scientific Innovation Research of College Graduate in Jiangsu Province (Grant Nos. CXZZ12-0490 and CXZZ11-0606). The authors would like to thank Dr. Junmei BAN for fruitful discussions on editing the manuscript. The National Center for Atmospheric Research is sponsored by the National Science Foundation. Any opinions, findings, and conclusions or recommendations expressed in this publication are those of the authors and do not necessarily reflect the views of the National Science Foundation.
| 1 |
|
| 2 |
|
| 3 |
|
| 4 |
|
| 5 |
|
| 6 |
|
| 7 |
|
| 8 |
|
| 9 |
|
| 10 |
|
| 11 |
|
| 12 |
|
| 13 |
|
| 14 |
|
| 15 |
|
| 16 |
|
| 17 |
|
| 18 |
|
| 19 |
|
| 20 |
|
| 21 |
|
| 22 |
|
| 23 |
|
| 24 |
|
| 25 |
|
| 26 |
|