Correlation between Atmospheric Water Vapor and Diurnal Temperature Range over China
Correlation between Atmospheric Water Vapor and Diurnal Temperature Range over China |
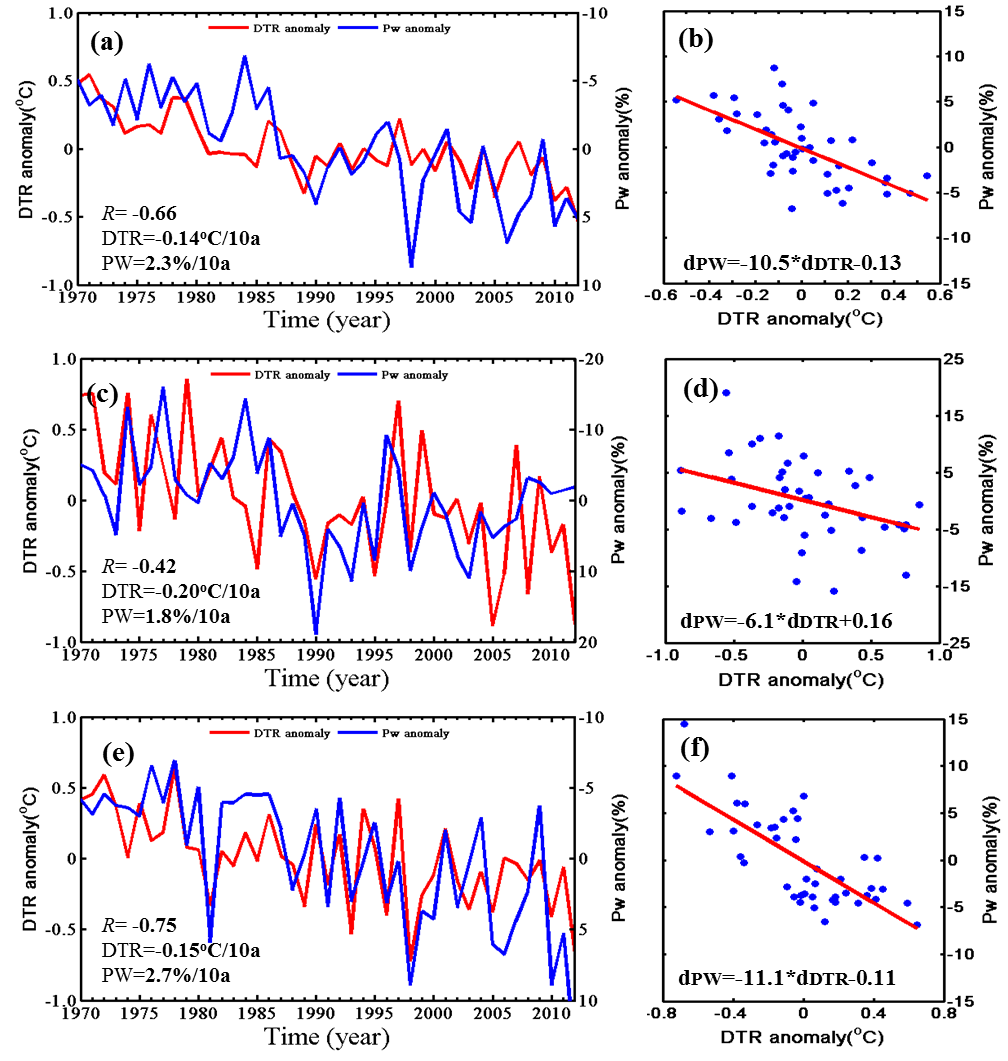
| Figure 4 Time series of PW and the DTR left panels averaged across China, and scatterplots of DTR vs. PW for a, b annual, c, d winter, and e, f summer changes. The correlation coefficient r between the DTR and PW series, as well as their linear trends, are also shown in a, c, e. |
| |