Analysis of Pseudomomentum Wave-Activity Density in a Heavy Rainfall Event in East China
RAN Ling-Kun1  , HAO Shou-Chang
2 , QI Yan-Bin3
, HAO Shou-Chang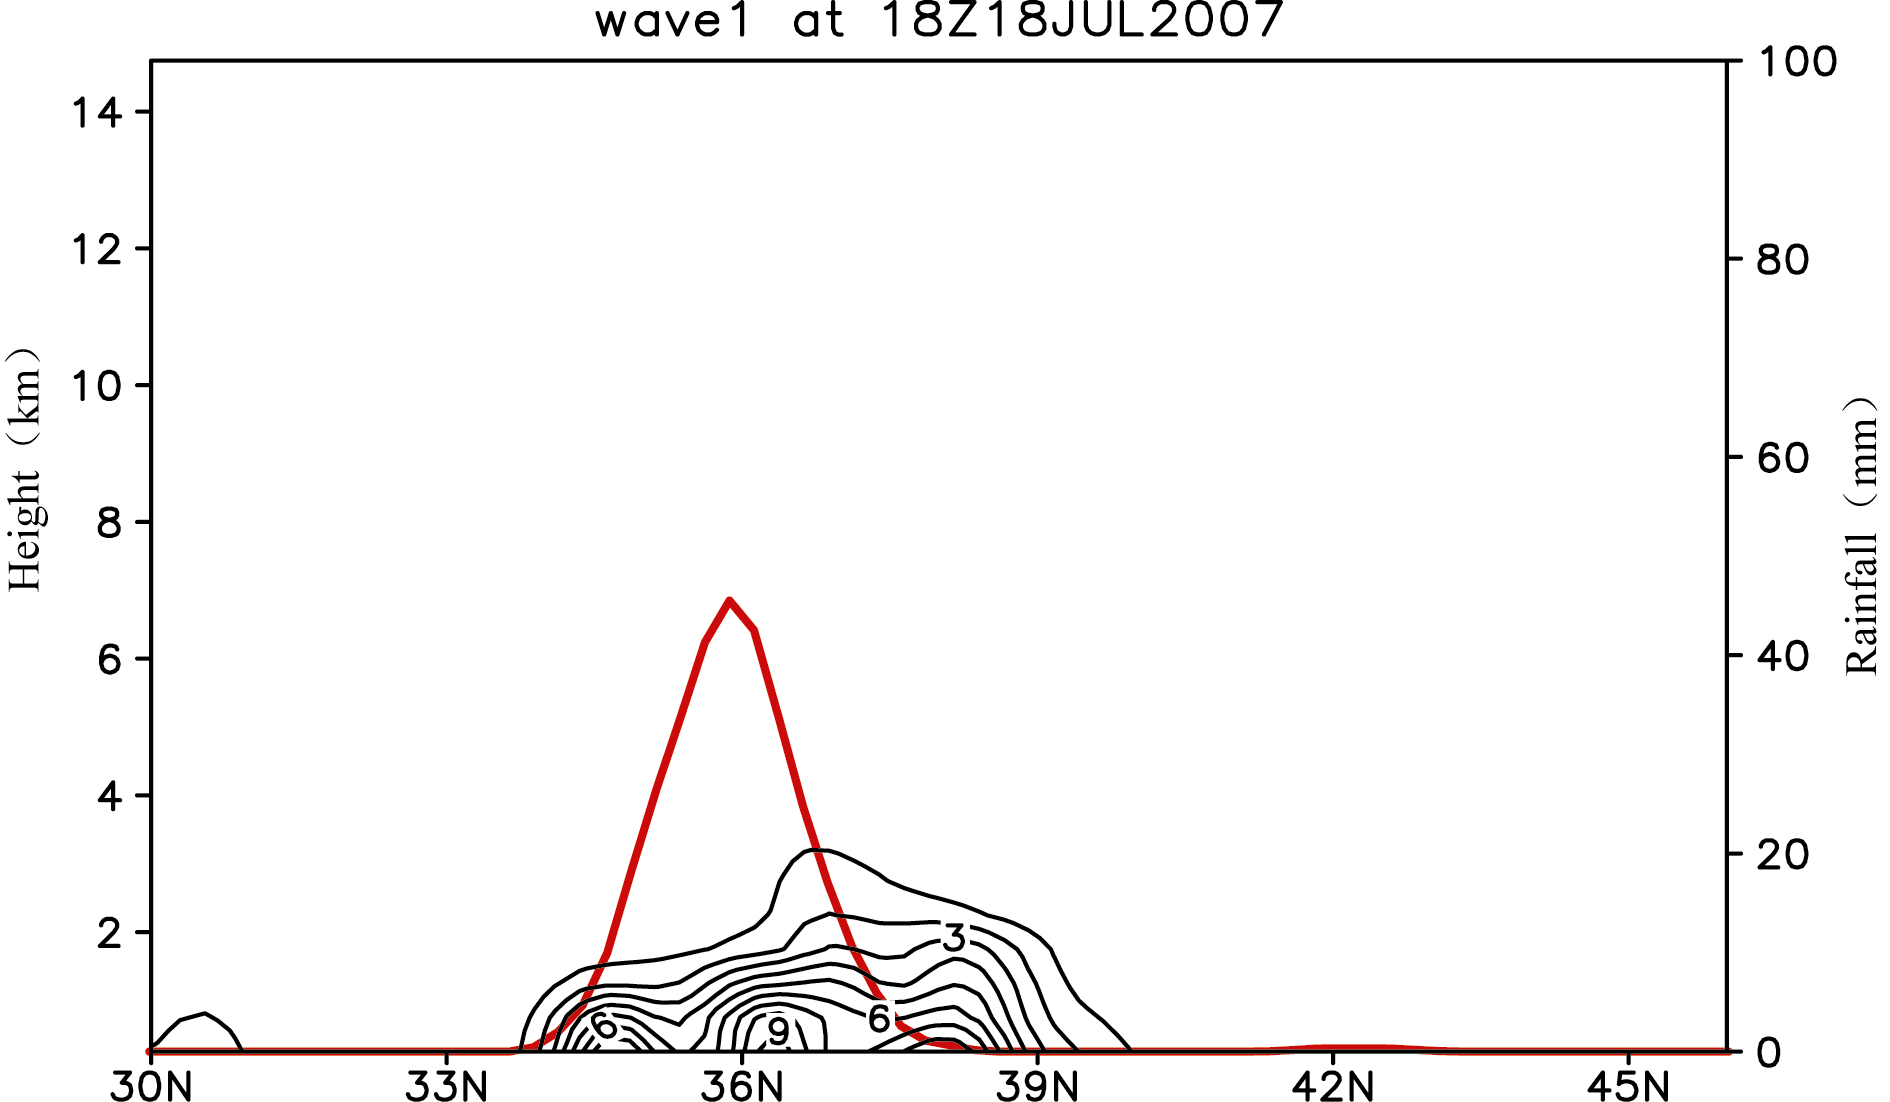
Analysis of Pseudomomentum Wave-Activity Density in a Heavy Rainfall Event in East China |
|
RAN Ling-Kun
, HAO Shou-Chang |
| Figure 1 Meridional vertical cross section of pseudomomentum wave-activity density zonally-averaged over the longitude belt 117-121¡ãE at 1800 UTC 18 July 2007 units: 10 5 kg m -2 s -1 , where the thick solid line denotes the observation of 6-h accumulated surface rainfall zonally-averaged over the longitude belt 117-121¡ãE units: mm. |
| |