Analysis of Pseudomomentum Wave-Activity Density in a Heavy Rainfall Event in East China

Analysis of Pseudomomentum Wave-Activity Density in a Heavy Rainfall Event in East China |
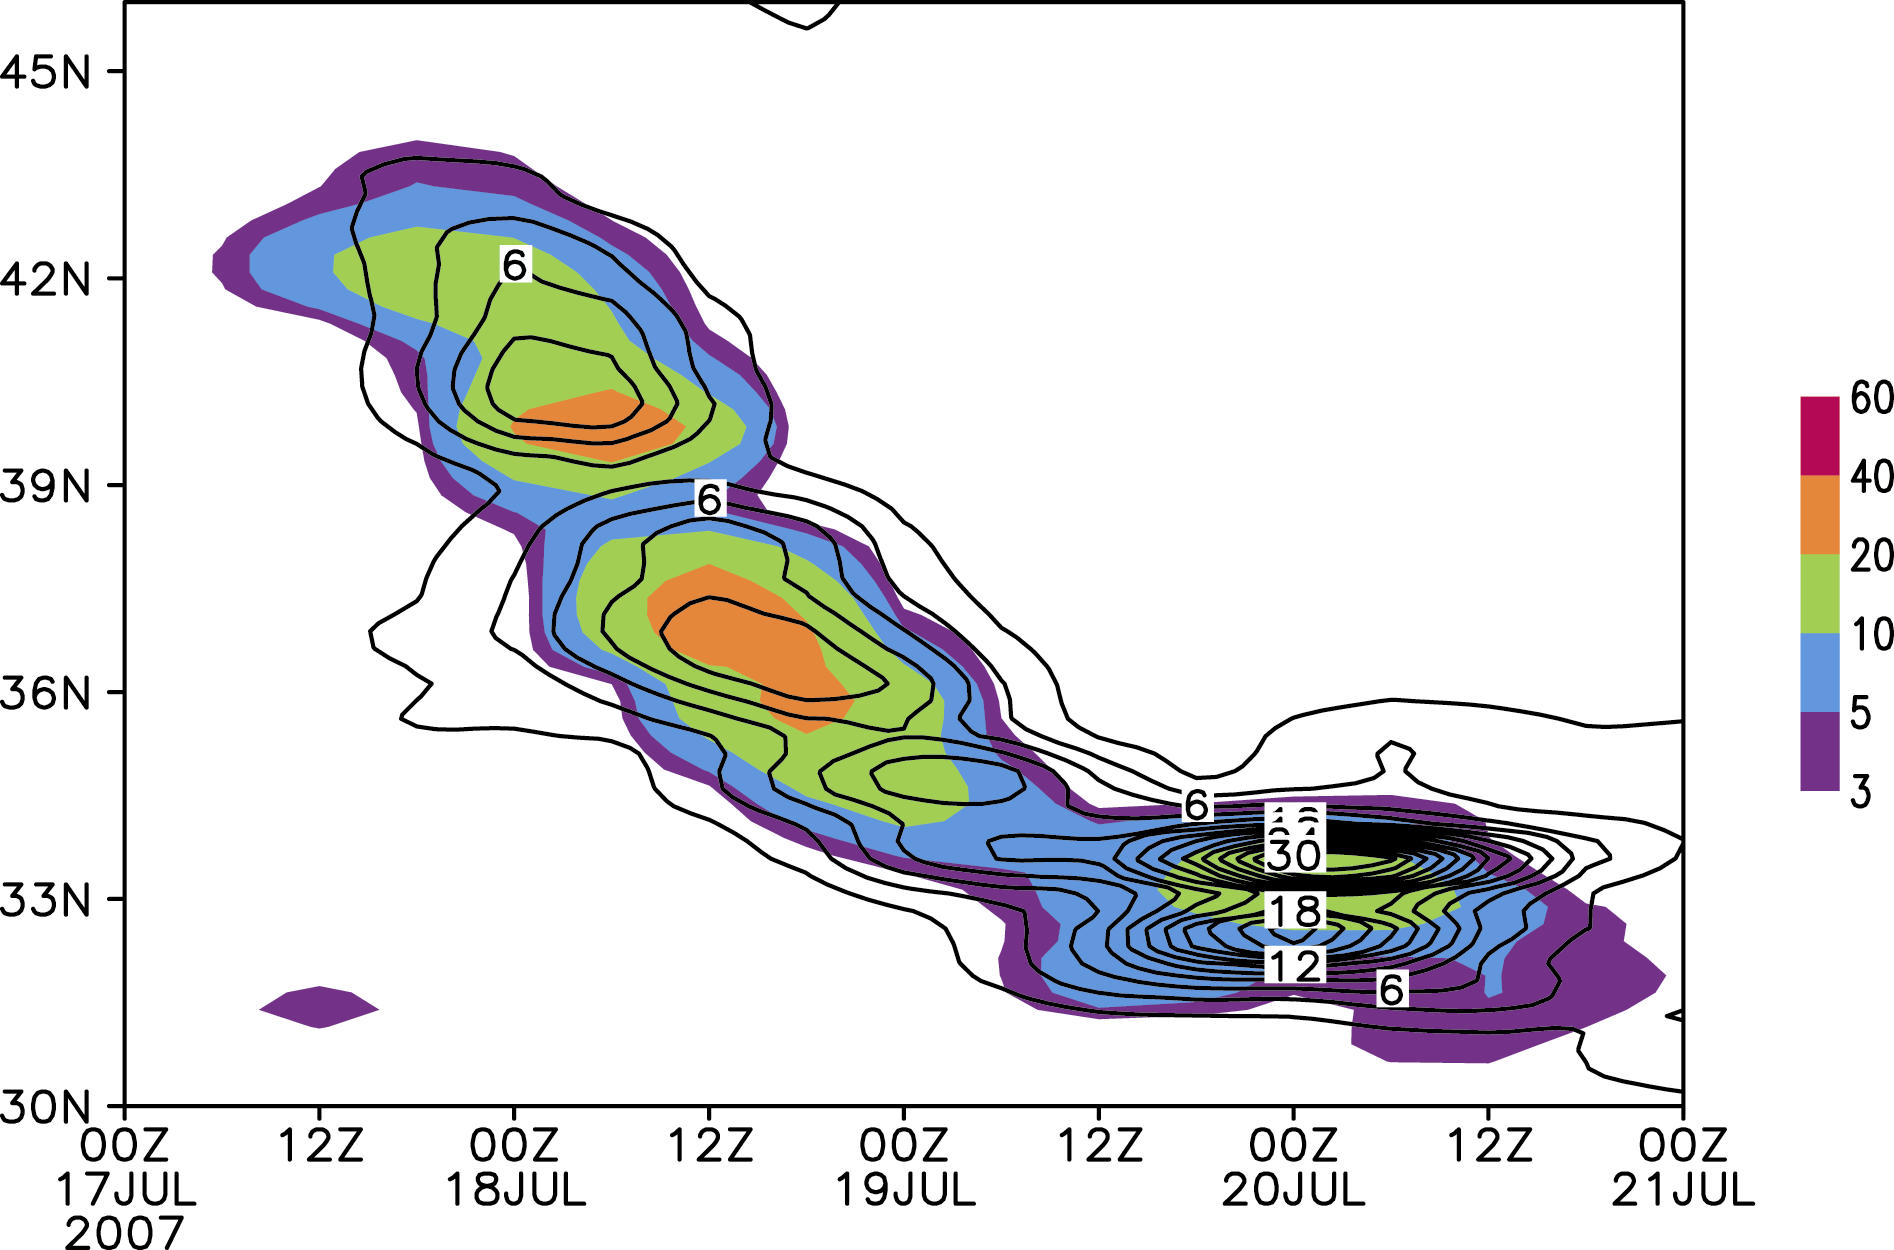
| Figure 3 Temporal-vertical cross section of pseudomomentum wave- activity density zonally-averaged over the longitude belt 117-121”ćE and vertically-integrated for the period 0000 UTC 17 July 2007 to 0000 UTC 21 July 2007 units: 10 8 kg m -1 s -1 . The color shading denotes the observation of 6-h accumulated surface rainfall zonally-averaged over the longitude belt 117-121”ćE units: mm. |
 |