
Influence of Mass and Radius of Ice Crystals on Hydrometeors, Internal Energy, and Kinetic Energy: A Numeric Model Study
RAN Ling-Kun1  , QI Yan-Bin
2 , LI Na1, 3
, QI Yan-Bin|
|


Two cloud-scale experiments with two different ice-phase schemes were carried out for a precipitation event that occurred in eastern China in 2005. The results were analyzed to examine the influences of the change of ice-particle mass and radius on hydrometeors, internal energy, and kinetic energy, as well as the primary factors responsible. It was found that the ice content increases notably and the snow content decreases due to the change. This is the consequence of the modulation of cloud microphysical processes. In particular, the Bergeron process and the accretion of snow and cloud ice are markedly influenced. The differences of internal energy and kinetic energy between the two experiments are caused by adjustments to pressure-flux divergence, the coupling of temperature and divergence, and gravitational work, and the reason is that these three factors result in differences of local changes of internal and kinetic energy.
Interaction between cloud and atmospheric dynamical fields is one of the most important subjects in atmospheric science, receiving extensive attention from meteorologists, and with significant progress having been achieved ( Huang et al., 1987; Hong, 1996; Gu et al., 1993; Xu, 1995; Sun et al., 2003; Deng et al., 2000; Xiao et al., 2004).
Cloud microphysical processes are the most critical aspects of the interaction between cloud and background fields. Accordingly, several cloud schemes have been proposed to describe cloud microphysical processes. For example, the cloud-ice-snow microphysical parameterization scheme by Hsie et al. (1980) (hereafter referred to as H80) has been used in many numerical models ( Sui et al., 1994; Xue et al., 1995). The H80 scheme uses the mass of a natural ice nucleus as the mass of the ice crystal when calculating the increase of cloud ice induced by cloud water deposition and takes the radius of the ice crystal to be 50 µm. Krueger et al. (1995) (hereafter referred to as K95) modified several important parameters of the H80 scheme according to observations. The K95 scheme replaces the mass of a natural ice nucleus of the H80 scheme with the average mass of an ice crystal and takes the radius of the ice crystal to be 100 µm. Li et al. (1999) analysed the differences between the H80 and K95 schemes.
The H80 scheme is the default scheme used in the Advanced Regional Prediction System (ARPS). However, in the present paper, we use the K95 scheme to substitute the H80 scheme in ARPS. The K95 scheme differs from the H80 scheme in the mass and radius of ice particles. Therefore, with respect to the two schemes, this paper examines the influence of the change of ice-particle mass and radius on the macro fields.
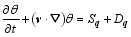
In order to diagnose the impact of ice crystals on the macro fields, the equations of internal and kinetic energies are firstly derived. Since the grid data of the ARPS model are used, the derivation begins with the equations of ARPS. In the local Cartesian coordinates without topography, the ARPS equations can be given by:
 | , (1) |
 | , (2) |
 | , (3) |
 | , (4) |
 | , (5) |
 | , (6) |
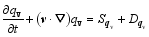
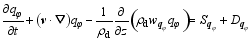
here, v = ( u, v, w) is the three-dimensional velocity vector; p is the pressure; f is the Coriolis parameter; θ is the potential temperature; g is the gravitational acceleration; ρ = ρd+ ρv+ ρc+ ρr+ ρI+ ρs+ ρh is the total density, which is the sum of the densities of dry air ( ρd), water vapor ( ρv), cloud water ( ρc), rain water ( ρr), cloud ice ( ρi), snow ( ρs), and graupel ( ρh); qv is the water vapor mixed ratio; qφ represents the mixing ratios of hydrometeors (namely, cloud water ( qc), rain water ( qr), cloud ice ( qi), snow ( qs), and graupel ( qh)); 


The state equations of dry air and water vapor can be written as
 | , (7) |
and
 | , (8) |
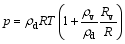
respectively. Here, pd is the pressure of dry air; e is the water vapor pressure; R and Rv are the specific gas constants of dry air and water vapor, respectively; and T is the temperature. Summing Eqs. (7) and (8) yields
 | , (9) |
where p = pd + e. With the definitions
 | (10) |
and
 | , (11) |
one has

Substituting Eqs. (10) and (12) into Eq. (9) yield
 | , (13) |
where ε = R/ Rv.
The dry-air mass is conserved:
 | , (14) |
Substituting Eq. (10) into Eqs. (5) and (6), and cancelling 
 | , (15) |
and
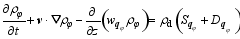 | , (16) |
where
 | , (17) |
The summation of Eqs. (14)-(16) yields
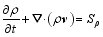 | , (18) |
where
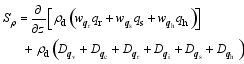 | (19) |
is the source or sink.
With Eq. (13), the potential temperature becomes
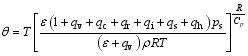 | , (20) |
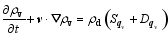
Substituting Eq. (20) into Eq. (4), and using Eqs. (5), (6), and (18), one obtains
 | , (21) |
The local change of internal energy results from the combination of four terms on the right-hand side of Eq. (21). In order, they represent: the advection of internal energy; the coupling of temperature and divergence; the source or sink and turbulence dissipation of potential temperature; and the source or sink and turbulence dissipation of water vapor.
With Eqs. (1)-(3), the kinetic equation can be given by
 | , (22) |
where D = ( Du, Dv, Dw) is the vector of the sub-grid turbulence dissipation of momentum.
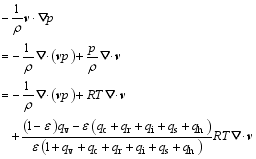
With Eq. (13), the term 
| , (23) |
The local change of kinetic energy is dominated by the four terms on the right hand side of Eq. (22). In order, they are: the advection of kinetic energy; the advection of pressure; gravitational work; and the work by frictional force. The advection of pressure is composed of the divergence of pressure flux, the coupling of temperature and divergence, and the coupling of water substances, temperature and divergence. Equations (21) and (23) share the coupling of temperature and divergence with an opposite sign. The term denotes an exchange between kinetic energy and internal energy.
The potential energy equation can be written as
 | , (24) |
Obviously, the gravitational work that appears in Eqs. (22) and (24) presents the exchange between kinetic energy and potential energy.
Equations (6) and (21) are used to analyse the influence of the change of ice-particle mass and radius on the hydrometeors, internal energy, and kinetic energy in the following section.
A precipitation event that occurred in eastern China from 1200 UTC 20 March 2005 to 1200 UTC 21 March 2005 was simulated by the ARPS model. The event was a stratiform precipitation event, not a cumulus precipitation one. The chosen microphysics parameterization of the ARPS model was more suitable for stratus. The simulation was configured by three one-way nested domains with resolutions of 27 km, 9 km, and 3 km, and the vertical spacings were 500 m, 500 m, and 400 m, respectively. The central location of the three domains was the same. The outer simulation was interpolated to the 9-km domain and provided the IC (initial condition) and LBC (lateral boundary condition) for the 9-km simulation. Then, the middle simulation was interpolated to the 3-km domain and provided IC and LBC for the 3-km simulation.The 3-km simulation was composed of a control experiment (Ctrl) and a sensitivity experiment (Sice). NCEP/NCAR final analysis data, surface observations and soundings were objectively analysed to produce the initial conditions. The H80 scheme was used in Ctrl, while Sice adopted the K95 scheme. The H80 scheme employs the mass of the natural ice nucleus as the mass of the ice crystal and takes the radius of the ice crystal to be 50 µm. The K95 scheme adopts the average mass of ice crystals instead of the mass of the natural ice nucleus and takes the radius of the ice crystal to be 100 µm.
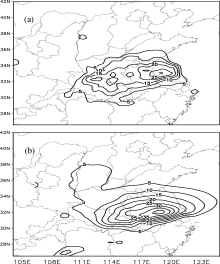
The observed precipitation presents a band pattern, stretching from the southwest of Hubei Province to the east of Jiangsu Province (Fig. 1). The precipitation center is located near (32.5°N, 118.5°E). The 27-km simulation of 24-h precipitation has a band pattern similar to the observation except that the simulated precipitation is a little stronger. The simulations of potential height, wind vector, moisture, and temperature resemble the observations (not shown). Overall, the 27-km simulation is reliable. Based on this, two 3-km experiments were conducted.
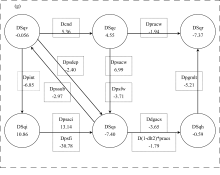
How the changes of mass and radius of ice-phase particles influence cloud hydrometeors is examined firstly. As shown in Fig. 2a, the cloud ice and snow is markedly influenced. A significant increase at the 8-km level and a decrease at the 5.5-km level can be seen after the change of ice-phase particles. This pattern results in an evident increase of the total amount of hydrometeors in the upper-level troposphere. In addition, there is also an increase of cloud water at the 2-8-km levels, with a slight decrease of rain water and graupel in the lower troposphere.
To find the possible factors resulting in the difference of hydrometeors, we calculated the differences of all the terms in the hydrometeor equations between Sice and Ctrl. It was found that the difference of the local time change (such as 

 | Figure 1 (a) Observation of 24-h accumulated precipitation and (b) simulation of 24-h precipitation with a horizontal resolution of 27 km during the period 1200 UTC 20 March 2005 to 1200 UTC 21 March 2005. Units: mm. |
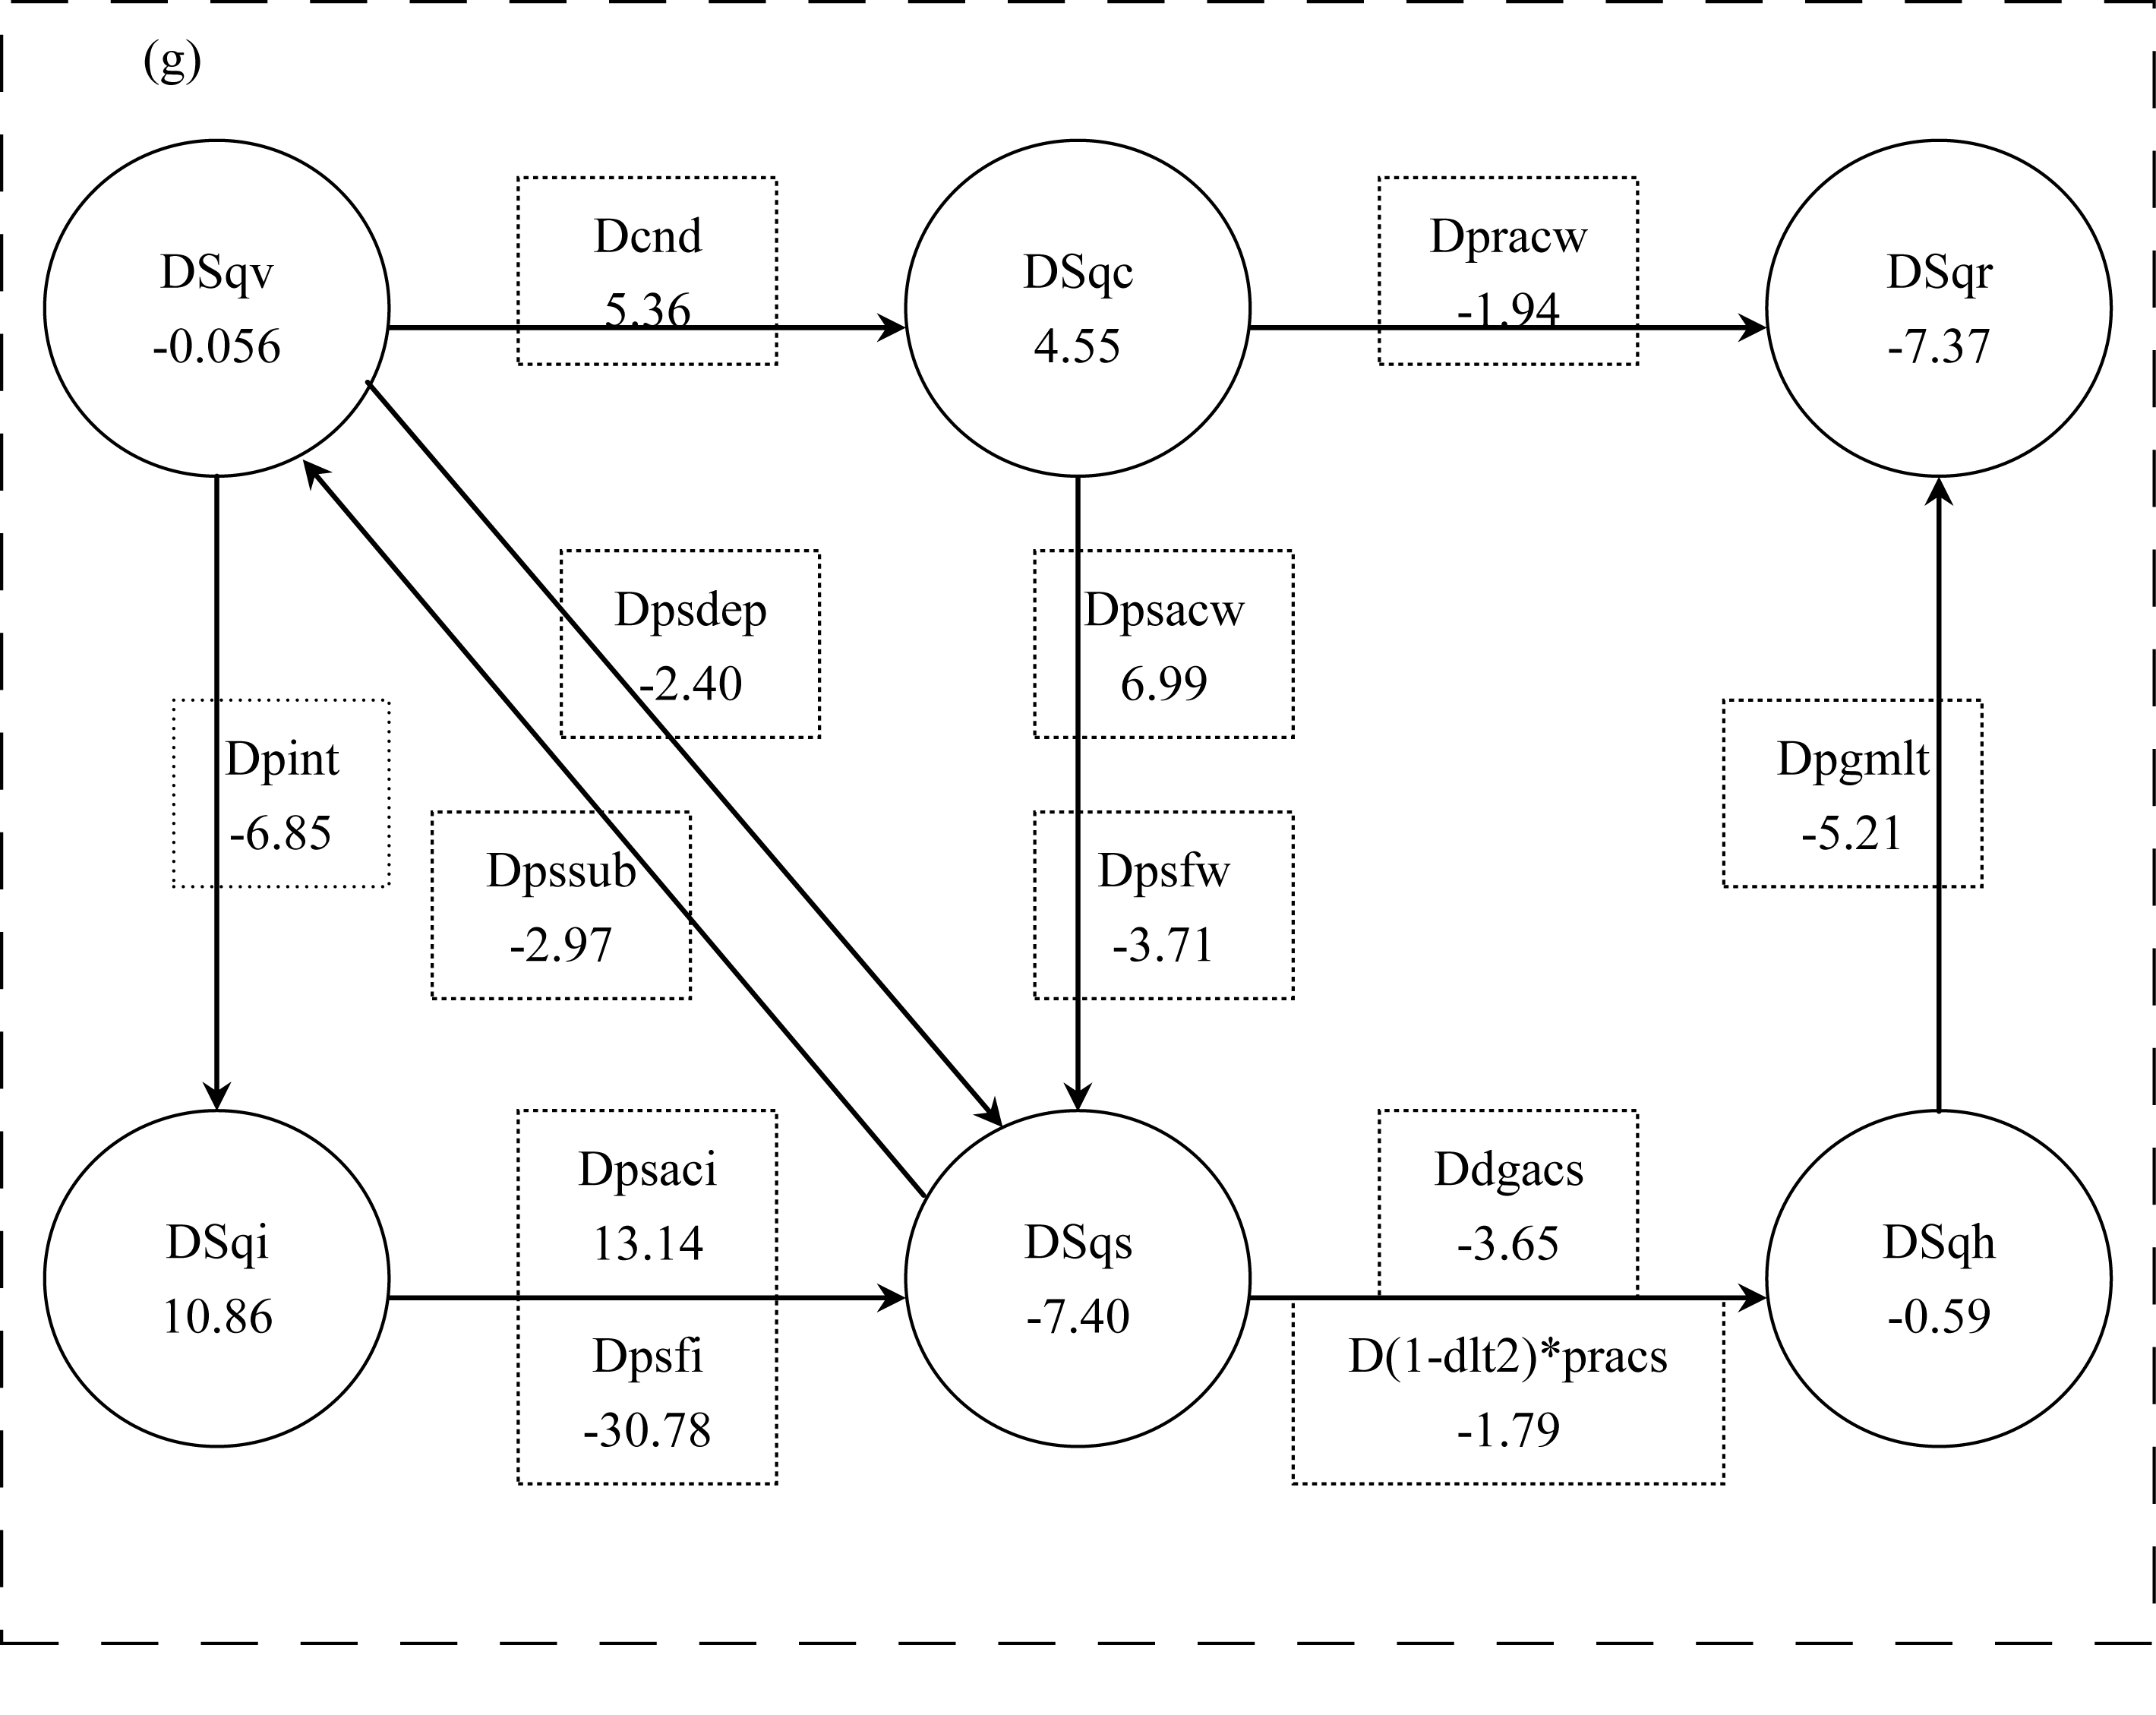
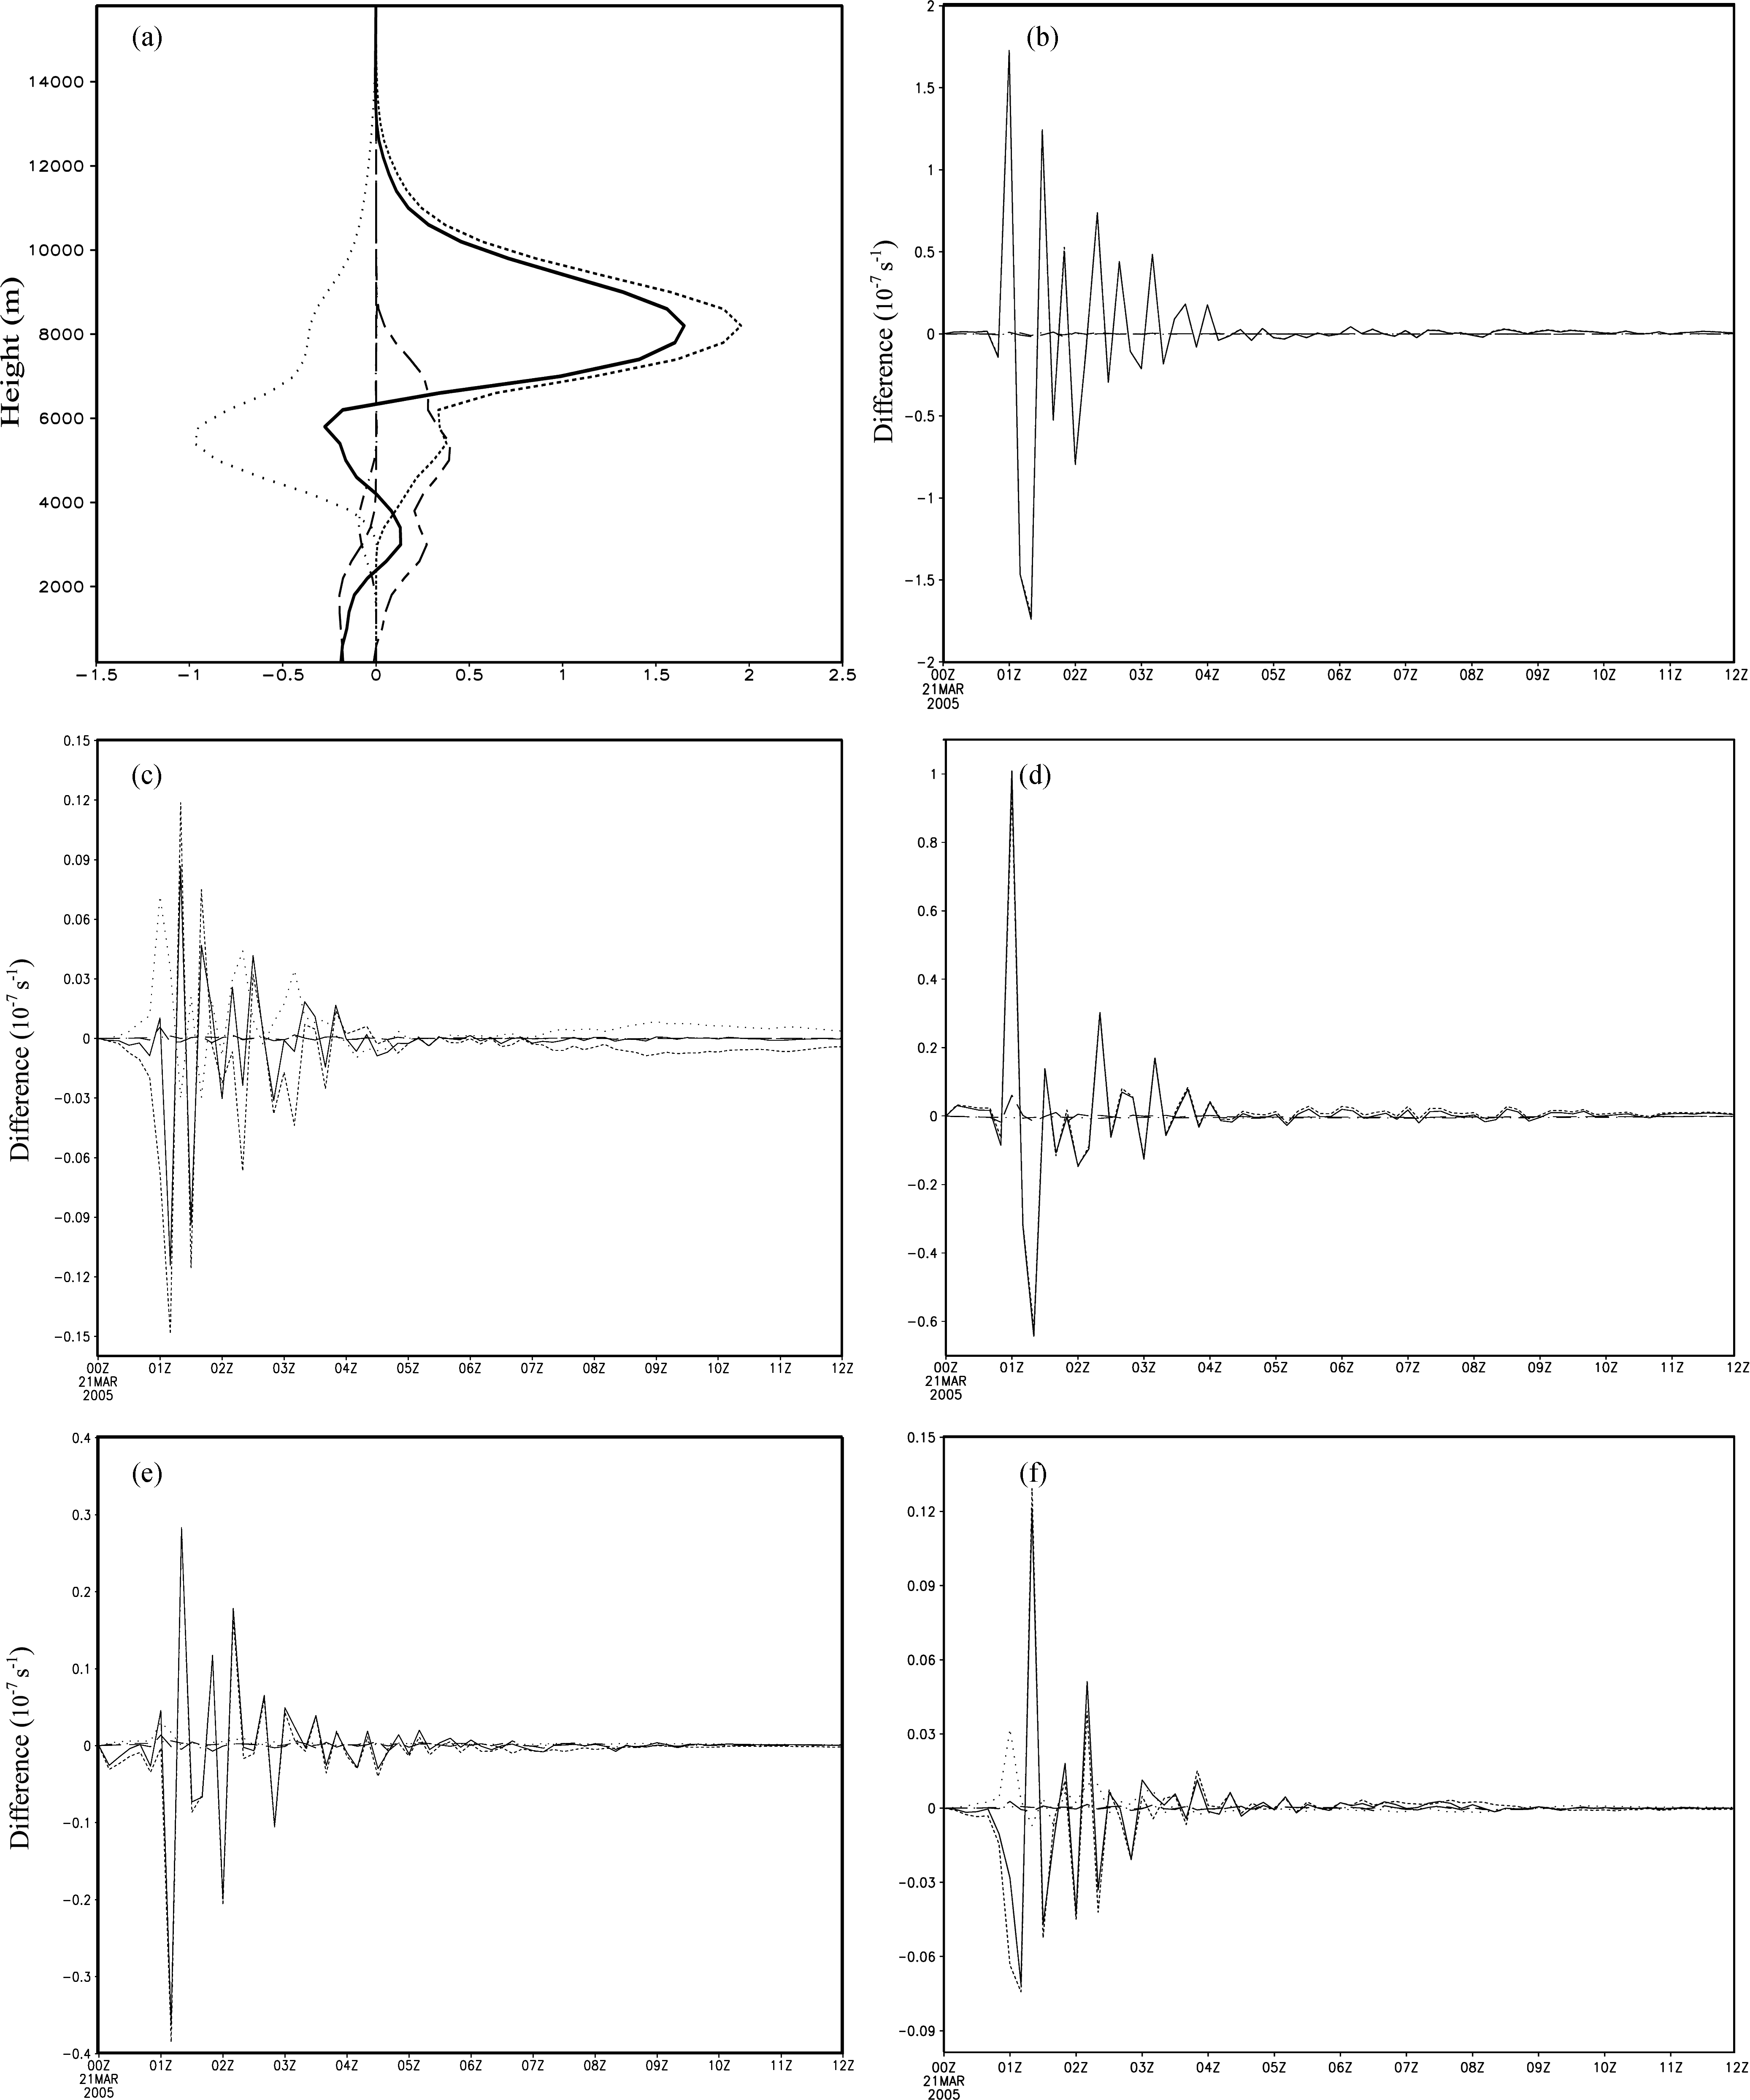 | Figure 2 (a) Vertical section of horizontally and temporally averaged cloud-hydrometeor differences between Sice and Ctrl: the long/short-dashed line denotes the difference of cloud water; the long-dashed line is the difference of rain; the short-dashed line is the difference of cloud ice; the dotted line is the difference of snow; the dot-dashed line is the difference of graupel; and the solid line is the difference of total cloud hydrometeors (units: 10-5g g-1). (b-f) Temporal section of spatially averaged differences of cloud-hydrometeor equations between Sice and Ctrl: (b) cloud water equation; (c) rain equation; (d) cloud ice equation; (e) snow equation; (f) graupel equation. The solid line is the difference of local change terms; the long-dashed line is the difference of advection terms; the short-dashed line is the difference of source or sink terms of microphysical processes; the dotted line is the difference of terminal velocity terms; and the dot-dashed line is the difference of turbulence terms (units: 10-7s-1). (g) The budget of the major microphysical differences, spatially, and temporally averaged: the spring “D” denotes the microphysical-process difference between Sens and Ctrl; for example, Dpsaci=psaci|Sens-psaci|Ctrl (units: 10-8 g g-1). |
 | Figure 2 (a) Vertical section of horizontally and temporally averaged cloud-hydrometeor differences between Sice and Ctrl: the long/short-dashed line denotes the difference of cloud water; the long-dashed line is the difference of rain; the short-dashed line is the difference of cloud ice; the dotted line is the difference of snow; the dot-dashed line is the difference of graupel; and the solid line is the difference of total cloud hydrometeors (units: 10-5g g-1). (b-f) Temporal section of spatially averaged differences of cloud-hydrometeor equations between Sice and Ctrl: (b) cloud water equation; (c) rain equation; (d) cloud ice equation; (e) snow equation; (f) graupel equation. The solid line is the difference of local change terms; the long-dashed line is the difference of advection terms; the short-dashed line is the difference of source or sink terms of microphysical processes; the dotted line is the difference of terminal velocity terms; and the dot-dashed line is the difference of turbulence terms (units: 10-7s-1). (g) The budget of the major microphysical differences, spatially, and temporally averaged: the spring “D” denotes the microphysical-process difference between Sens and Ctrl; for example, Dpsaci=psaci|Sens-psaci|Ctrl (units: 10-8 g g-1). |
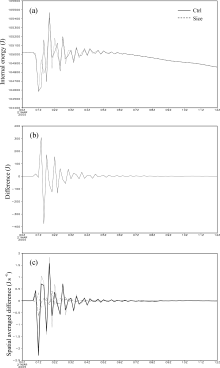
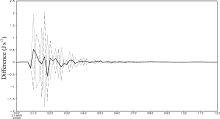
The response of internal energy to the change of ice- particle mass and radius is focused on in this subsection. As shown in Fig. 3a, the temporal evolution of internal energy in Ctrl is characterized by a fluctuating pattern during 0.7?06Z. The internal energy in Ctrl begins to decrease at 06Z, and its fluctuation gradually weakens. Meanwhile, the Sice experiment shows a tendency of internal energy different to that in Ctrl. The difference of internal energy between Sice and Ctrl mainly appears in the period 01?04Z, fluctuating around zero and reaching a peak at 01Z (Fig. 3b).
All the terms in the internal energy equation (Eq. (21)) were calculated to find the factors accounting for the difference of internal energy, and their differences between Sice and Ctrl were analysed. The difference of the local time change of internal energy shares a temporal tendency pattern with that of the coupling of temperature and divergence (Fig. 3c). This means that the difference of the terms plays a role in inducing the difference of internal energy between the two experiments. The differences of the internal-energy advection, diabatic heating and moisture sources or sinks are less significant.
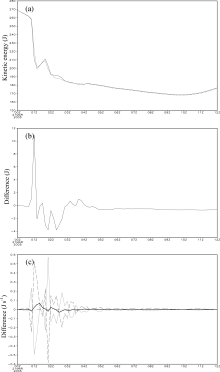
The kinetic energy adjusts to respond to the change of ice-particle mass and radius. The two experiments show a similar evolutionary pattern of kinetic energy, decreasing with time (Fig. 4). The difference of the kinetic energy between the two experiments appears in the period 0.7-03Z, with the kinetic energy in Sice being greater than that in Ctrl during 0.7-1.1Z and 03-04Z, and smaller than that in Ctrl in the other period.
The primary factors responsible for the difference of kinetic energy were examined through calculating the terms in the kinetic-energy equation. The differences in pressure advection and gravitational work are larger than the differences of kinetic-energy advection and turbulence dissipation between the two experiments. The former two terms are correlated with a reverse phase. Their summation is consistent with the difference of the local change of kinetic energy. This indicates the differences in pressure advection and gravitational work are the primary factors leading to the difference of the local time change of kinetic energy. The contributions from the differences in kinetic-energy advection and turbulence dissipation are negligible.
The analysis reveals that, after the change of ice-particle mass and radius, the coupling of temperature and divergence in the internal-energy equation, as well as the pressure advection and gravitational work in the kinetic-energy equation, undergo significant adjustment. These terms modulate the internal energy and kinetic energy. In nature, gravitational work represents the transformation between kinetic and potential energy, and so the change of ice-particle mass and radius also have an indirect impact on the potential energy.
The pressure advection in Eq. (23) is decomposed into three portions: the divergence of pressure flux; the coupling of temperature and divergence; and the coupling of water substances, temperature and divergence. As shown in Fig. 5, the difference of the coupling of water substances, temperature and divergence between Sice and Ctrl is relatively small. The differences of the pressure- flux divergence and coupling of temperature divergence are large. Hence, they are the primary components of the difference of pressure advection. The temperature-divergence coupling represents the transition between kinetic and internal energy, and so the change of ice-particle mass and radius in fact influences the pressure-flux divergence and transition between kinetic and internal energy.
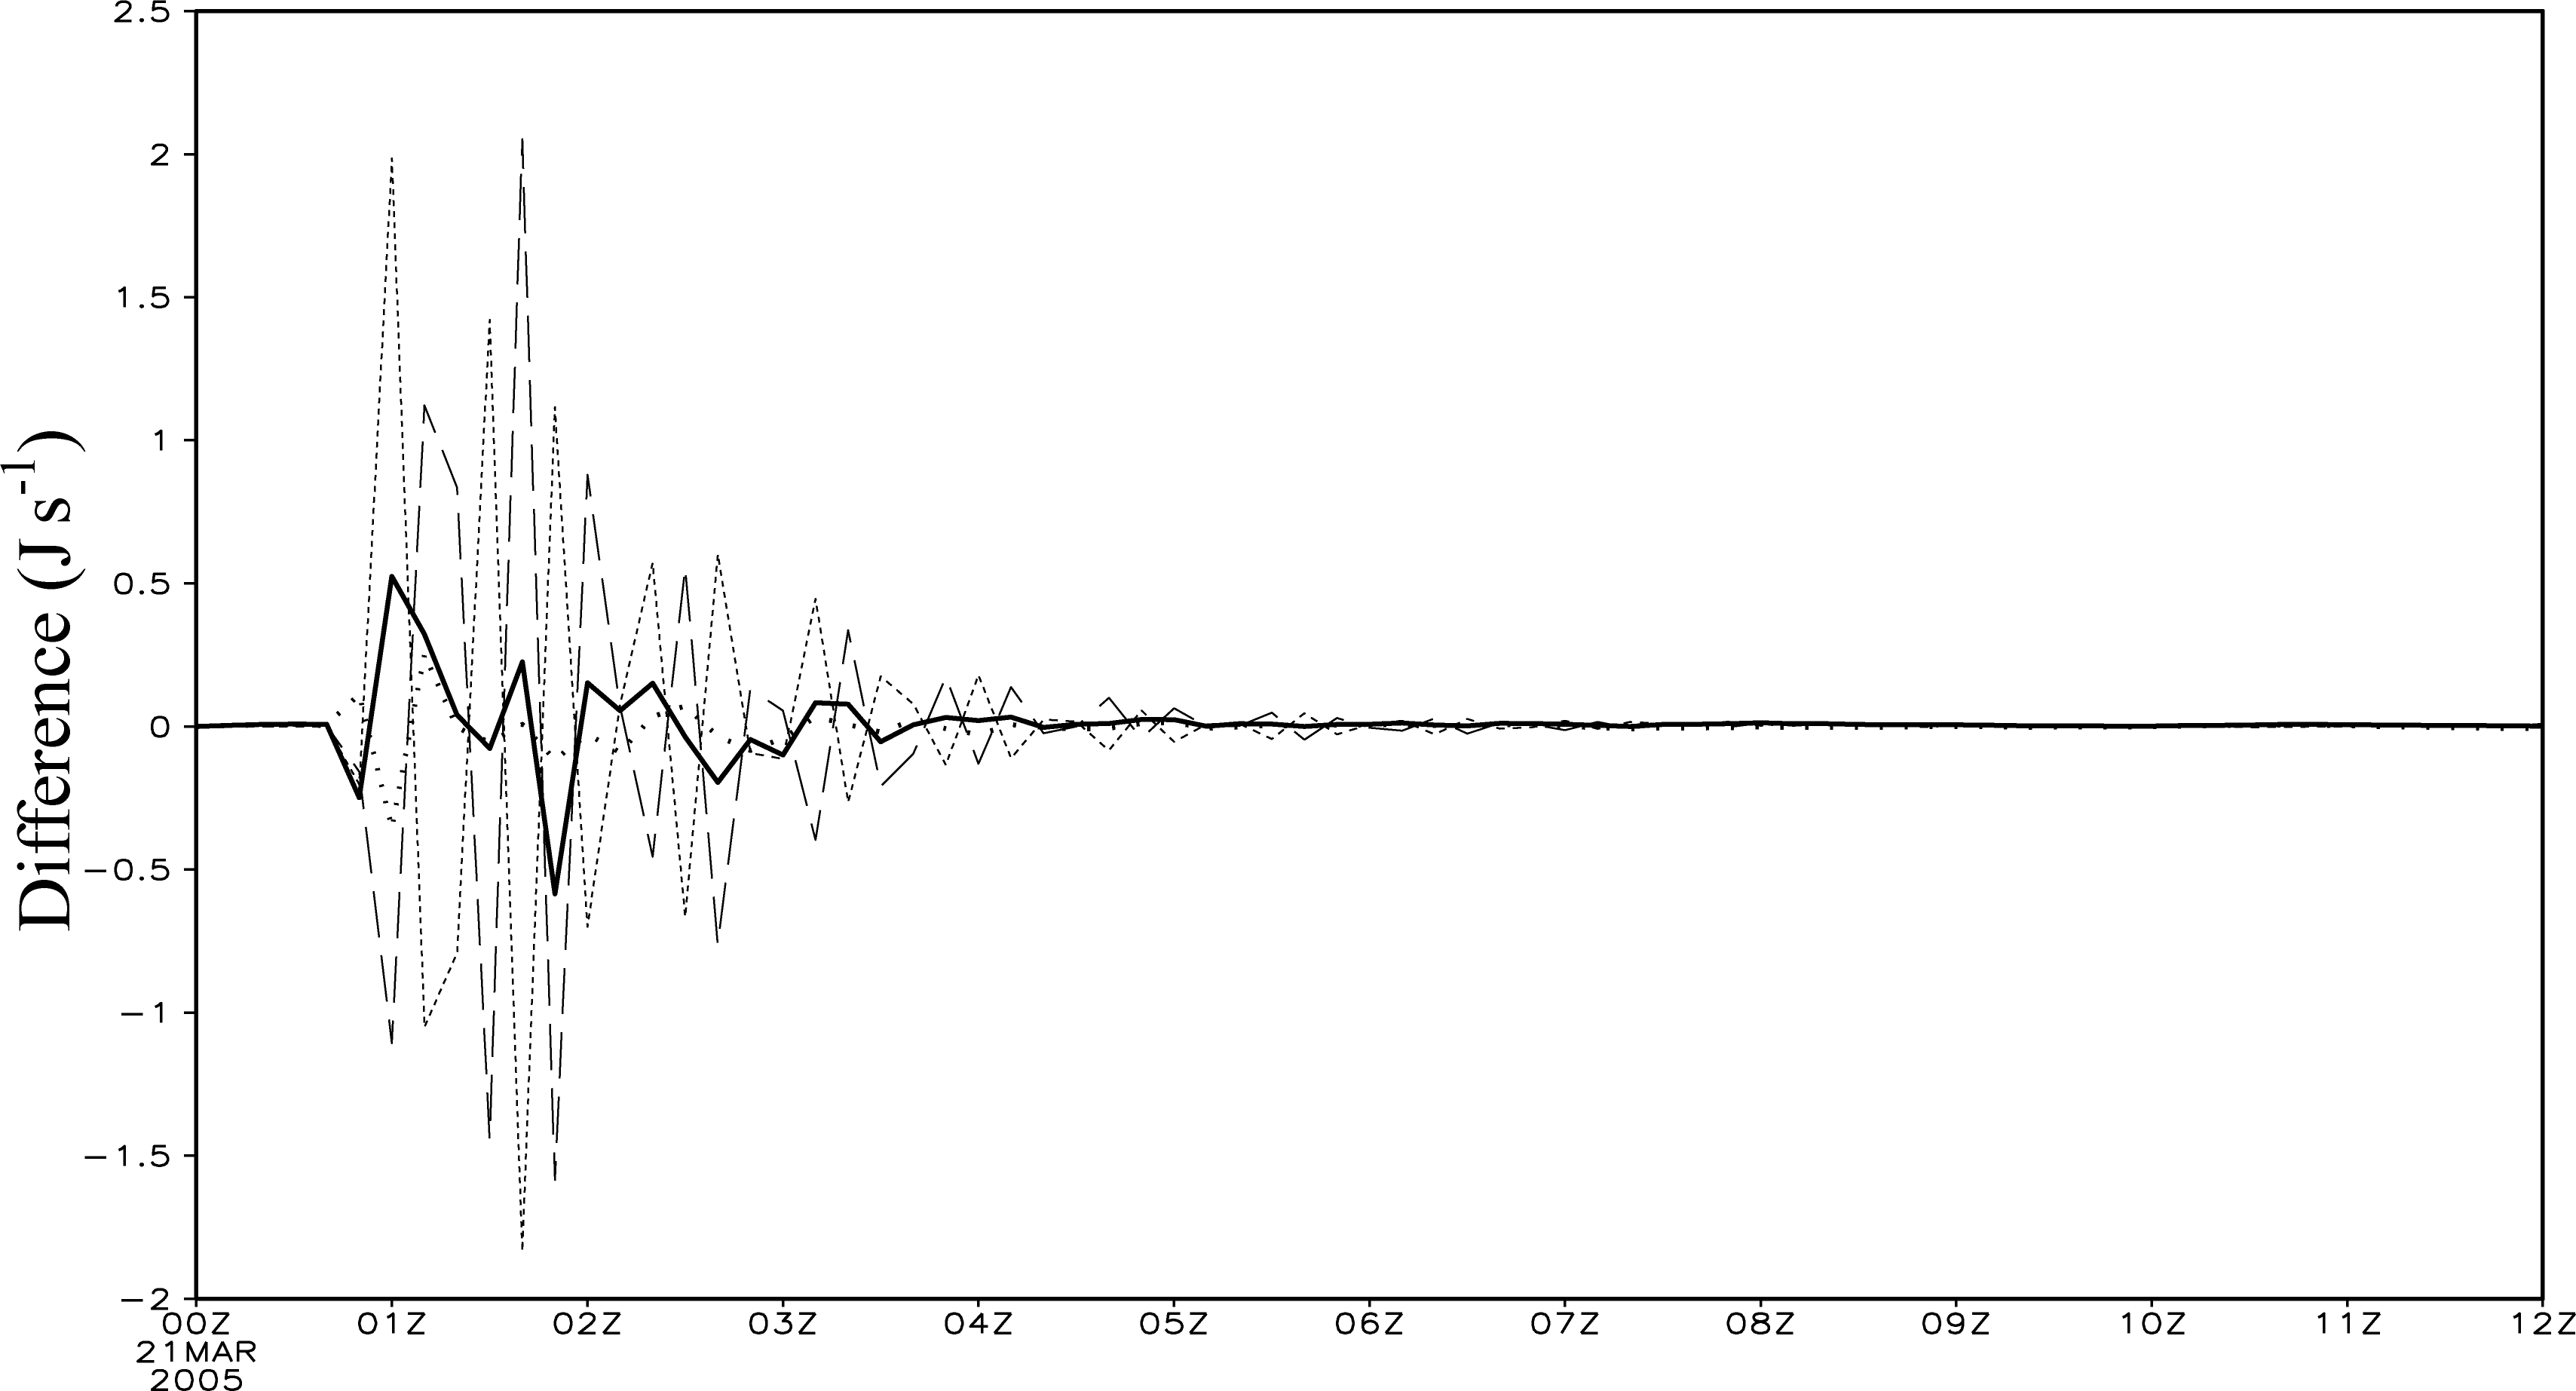
 | Figure 3 (a) Vertical sections of spatially-averaged internal energies of Sice (dashed line) and Ctrl (solid line) (units: J), (b) their difference (units: J), and (c) the temporal section of the spatially-averaged difference of the internal-energy equations between Sice and Ctrl (the solid line is the difference of internal-energy local changes; the long-dashed line is the difference of internal-energy advections; the short-dashed line is the difference of temperature-divergence coupling terms; the dot-dashed line is the difference of internal-energy thermal sources or sinks; and the dotted line is the difference of internal-energy moisture sources or sinks (units: J s-1). |
To investigate the impact of the change of ice-particle mass and radius, two 3-km simulations with the H80 and K95 schemes were carried out, respectively. The adjustments to hydrometeors, internal energy, and kinetic energy due to the change of ice-particle mass and radius were analysed. The primary factors responsible for the adjustments were also examined. The key conclusions can be summarized as follows:(1) The change of ice-particle mass and radius increases the ice content and decreases the snow content. The adjustment to hydrometeors is mainly caused by the difference of microphysical sources or sinks between the two experiments. The Bergeron process from ice crystal to snow and the accretion of snow and cloud ice are the most affected by the change.
 | Figure 4 (a) Vertical sections of spatially-averaged kinetic energies of Sice (dashed line) and Ctrl (solid line) (units: J), (b) their difference (units: J), (c) the temporal section of the spatially averaged difference of the kinetic-energy equations between Sice and Ctrl (the solid line is the difference of kinetic local changes; the dotted line is the difference of kinetic-energy advections; the short-dashed line is the difference of vertical-transportation terms; the long-dashed line is the difference of pressure advection terms; and the dot-dashed line is the difference of momentum dissipation terms (units: J s-1). |
 | Figure 5 Temporal section of spatially-averaged differences of pressure advection (solid line); pressure-flux divergence (long-dashed line); temperature-divergence coupling (short-dashed line); and the coupling of water, temperature, and divergence (dotted line) (units: J s-1). |
(2) The change leads to an adjustment of internal energy in terms of the coupling of temperature and divergence.
(3) The pressure advection and gravitational work respond to the change. The pressure-flux divergence and temperature-divergence coupling are the primary components of the pressure advection, and make important contributions to the adjustment of the local time change of kinetic energy.
The microphysical modification due to the change of ice-particle mass and radius directly influence local changes to hydrometeors. The microphysical sources or sinks do not make major contributions to the evolution of internal and kinetic energy, and thus it can be inferred that this microphysical modification alters the release of latent heating. This arises locally through a change of potential temperature, and the pressure and temperature are correspondingly changed. Via the pressure-flux divergence and coupling of temperature and divergence, this microphysical modification plays an indirect role in the evolutions of internal and kinetic energy.
| 1 |
|
| 2 |
|
| 3 |
|
| 4 |
|
| 5 |
|
| 6 |
|
| 7 |
|
| 8 |
|
| 9 |
|
| 10 |
|
| 11 |
|
| 12 |
|